
 3 months ago
36
3 months ago
36

The broader crypto market sits in extreme fear as the Ripple price presses against local support, with XRPUSDT trying to stabilize after a prolonged downtrend.
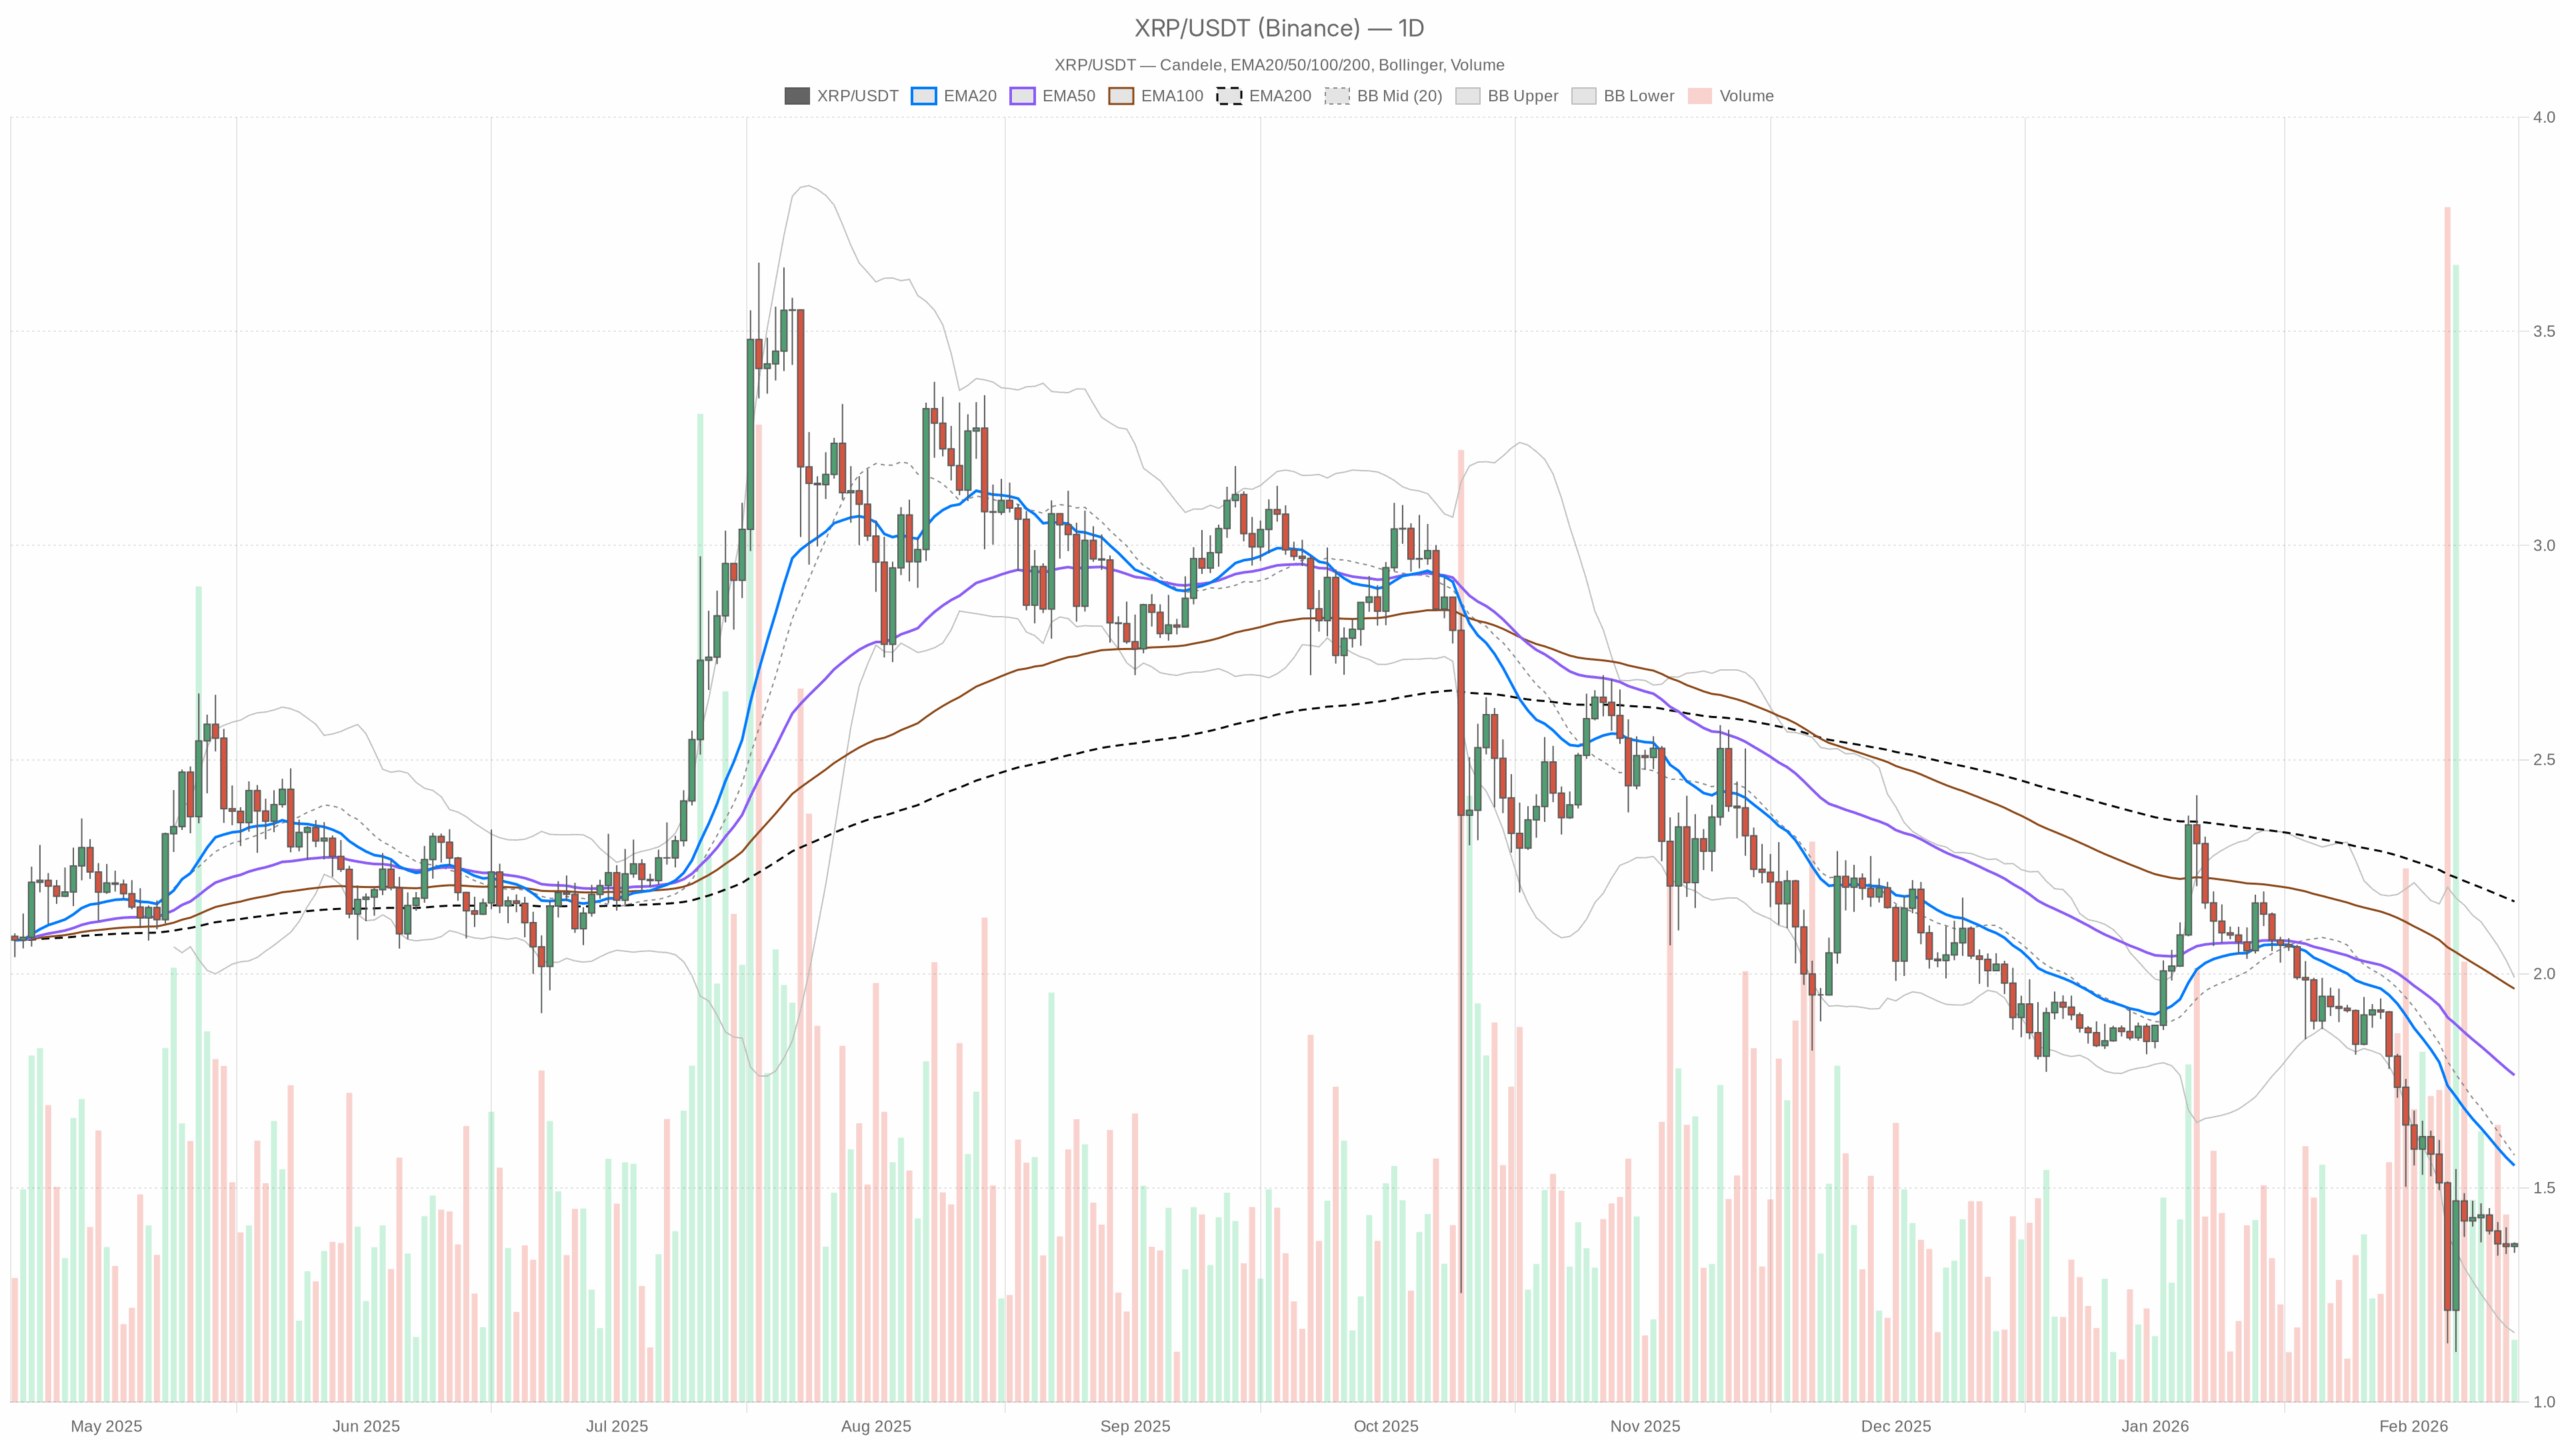 XRP/USDT — daily chart with candlesticks, EMA20/EMA50 and volume.
Daily Chart (D1): Macro Bias – Bearish, But Near a Potential Support Pocket
The main scenario from the daily chart is bearish. XRPUSDT is in a downtrend, trading under all major moving averages and below the Bollinger midline, with momentum still weak. However, the price is hovering just above the lower Bollinger Band and near the daily pivot, hinting that we are closer to the late phase of the current leg down rather than the middle of it.
Daily EMAs (Trend Structure)
- Price (close D1): 1.37 USDT
- EMA 20: 1.55 USDT
- EMA 50: 1.76 USDT
- EMA 200: 2.17 USDT
Price is well below the 20, 50, and 200 EMAs, and those EMAs are stacked in a textbook bearish order. This confirms a mature downtrend on the daily chart. Any bounce toward 1.55–1.76 would currently be a rally into resistance, not a confirmed trend reversal.
Daily RSI (Momentum & Exhaustion)
- RSI 14 (D1): 32.9
Daily RSI is below 40 and leaning toward oversold, but not yet at full capitulation. That usually means bearish momentum is still in control, but sellers are no longer early; they are pressing an already extended move. This is where shorting blindly becomes less attractive and where snapback rallies can appear if news or liquidity shifts.
Daily MACD (Trend Momentum)
- MACD line: -0.15
- Signal line: -0.14
- Histogram: -0.01
MACD is negative and almost flat with a tiny negative histogram. The downtrend is losing momentum, not reversing yet. Bears are still in charge, but the strong directional push seen earlier has cooled. This aligns with a market that is drifting lower more than impulsively breaking down.
Daily Bollinger Bands (Volatility & Value Zone)
- Middle band: 1.58 USDT
- Upper band: 1.99 USDT
- Lower band: 1.16 USDT
- Price vs Bands: 1.37 is below the mid, well above the lower band
Price is trading in the lower half of the band structure, under the midline at 1.58 but not hugging the lower band at 1.16. That is consistent with a soft grind lower rather than a panic flush. The lower band around 1.16 stands out as a potential line in the sand for deeper capitulation: if XRP slides toward that region, volatility could spike as weak hands exit.
Daily ATR (Range & Volatility)
- ATR 14 (D1): 0.14
An average daily range of about 0.14 on a 1.37 asset points to moderate volatility. This is not a volatility blow-off; the market is moving, but it is not in a frenzy. That fits the picture of a controlled downtrend in a fearful macro environment.
Daily Pivot Levels (Reference Support/Resistance)
- Pivot point (PP): 1.36
- R1: 1.38
- S1: 1.35
Price at 1.37 is sitting almost exactly on the daily pivot, wedged between S1 at 1.35 and R1 at 1.38. That tells you the market is undecided at this precise spot. A sustained break under 1.35 would open the door to a fresh downside leg, while holding above 1.38 would be the first small win for intraday bulls within a broader bearish trend.
1-Hour Chart (H1): Short-Term Bias – Neutral Stabilization
On the 1H timeframe, XRPUSDT is transitioning from weakness into a more balanced, sideways posture. The H1 data shows a neutral regime, with price sitting right on top of short-term EMAs and momentum indicators flatlining. This does not flip the daily trend, but it does indicate that selling pressure is pausing here.
H1 EMAs
- Price (close H1): 1.37 USDT
- EMA 20: 1.37 USDT
- EMA 50: 1.37 USDT
- EMA 200: 1.42 USDT
Price is glued to the 20 and 50 EMAs, while the 200 EMA sits higher at 1.42. Intraday, that is a range-trading environment under a larger bearish ceiling. Short-term players are balancing buyers and sellers, but any push into the 1.40–1.42 zone will run into structural resistance.
H1 RSI
- RSI 14 (H1): 51.39
RSI on the 1H is basically dead-center around 50, indicating no clear intraday edge. The impulsive selling has cooled, and price is catching its breath. From here, either side can take control, so the next push away from this equilibrium will matter for direction.
H1 MACD
- MACD line: 0
- Signal line: -0.01
- Histogram: 0
MACD on the 1H is flat at the zero line with the signal basically matching. Trend momentum is neutral intraday. There is no strong push either up or down; this fits with a consolidating market sitting on the pivot.
H1 Bollinger Bands
- Middle band: 1.36 USDT
- Upper band: 1.37 USDT
- Lower band: 1.35 USDT
- Price vs Bands: 1.37, hovering near the upper/mid band area
The bands on 1H are tight, with price near the upper half. This reflects a low-volatility squeeze, where a breakout can follow once one side commits. Given the bearish daily backdrop, upside follow-through needs confirmation; otherwise, these tight bands can just break lower.
H1 ATR & Pivot
- ATR 14 (H1): 0.01
- Pivot (PP): 1.37
- R1/S1 (H1): both calculated near 1.37 in this dataset
An ATR of 0.01 on 1H is very small, indicating quiet tape and thin intraday ranges. Combined with price hugging the pivot at 1.37, this reinforces the idea of a short-term equilibrium zone inside a larger downtrend.
15-Minute Chart (M15): Execution Context – Short-Term Bid Inside a Range
The 15m chart is useful only for timing entries and exits. Here, XRPUSDT shows a slight bullish tilt but still within a tight band.
M15 EMAs
- Price (close M15): 1.37 USDT
- EMA 20: 1.36 USDT
- EMA 50: 1.36 USDT
- EMA 200: 1.37 USDT
On 15m, price is fractionally above the 20 and 50 EMAs and roughly in line with the 200 EMA. That is a modest intraday upward bias inside a sideways micro-structure. It is useful for scalpers looking for quick mean-reversion longs, but not evidence of a genuine trend reversal.
M15 RSI
- RSI 14 (M15): 58.86
RSI leaning toward 60 on the 15m tells you short-term buyers are a bit more aggressive. This is a local bid, not a macro shift. It does, however, support the idea that pushing below 1.35 immediately might require fresh news or a broader risk-off spike.
M15 MACD & Bollinger Bands
- MACD line: 0
- Signal: 0
- Histogram: 0
- Bollinger mid: 1.36 USDT
- Upper band: 1.37 USDT
- Lower band: 1.35 USDT
MACD is flat and bands are tight with price near the top half, echoing the H1 picture: short-term controlled buying in a compressed volatility box. Any breakout move from here is likely to be fast compared with the current pace.
Putting It Together: Conflicting Timeframes
Daily trend is clearly bearish: price is below all major EMAs, RSI is depressed, and MACD is negative. On the other hand, H1 and M15 are neutral to slightly constructive, with price stabilizing around 1.37, intraday momentum flat, and a modest short-term bid.
This conflict usually resolves in one of two ways:
- The higher timeframe reasserts, the daily downtrend resumes, and intraday consolidation breaks lower.
- Intraday stabilization grows into a larger bounce, and XRP mean-reverts higher toward the daily EMAs before the market decides on the next big leg.
Given extreme fear across crypto, the market is vulnerable to both a capitulation flush and a sharp short-covering bounce. Positioning needs to respect that binary risk.
Bullish Scenario for Ripple Price (Against USDT)
The constructive path from here is a mean-reversion rally from this consolidation zone. In this context, the ripple price has room for a relief move if key levels hold.
For the bullish scenario:
- XRPUSDT needs to hold above the 1.35–1.36 daily pivot/S1 area. That is the immediate floor. Consistent 1H closes above 1.37 would reinforce this view.
- On H1, price should stay anchored above the 20/50 EMAs and then start pressing toward the 1.40–1.42 resistance band, where the H1 200 EMA sits.
- A decisive break and hold above 1.42 would be the first real signal that the market wants to challenge the daily Bollinger mid at 1.58 and then the EMA 20 at 1.55. That area (1.55–1.60) is the natural first target zone for a relief rally.
- Momentum-wise, you would want to see daily RSI climb back above 40–45 and MACD histogram turning positive on lower timeframes, then flattening on D1.
If this plays out, the narrative shifts from controlled downtrend to oversold bounce inside a still-bearish macro structure. The bigger trend would remain down until daily closes reclaim and hold above the EMA 50 (around 1.76). Bulls do not need that for a tradeable relief leg, though.
What invalidates the bullish scenario? A clear, sustained break below 1.35 on the daily close with RSI failing to recover would undercut the idea of an immediate bounce. That would imply the consolidation was just a pause before another push lower, likely toward the lower Bollinger Band region around 1.16.
Bearish Scenario for Ripple Price
The bearish path is a continuation of the existing trend: intraday stabilization fails, and the higher timeframe downtrend resumes. Sellers would then look to press price toward deeper support zones.
For the bearish scenario:
- Price loses the 1.35 support with conviction, turning the current pivot zone into resistance instead of support.
- H1 RSI rolls back under 45 and MACD on H1 dips more firmly negative, confirming that sellers have retaken control of the short-term tape.
- On the daily chart, price drifts or accelerates toward the lower Bollinger Band at 1.16. In an extreme fear environment, a spike into or slightly through that band would fit a capitulation phase.
- ATR on D1 could tick higher as ranges expand, signaling a volatility expansion to the downside.
In this scenario, rallies back into 1.36–1.40 are likely to be treated as selling opportunities by trend-followers, at least until the daily structure changes meaningfully and key EMAs are reclaimed.
What invalidates the bearish scenario? A firm reclaim of the 1.42–1.45 zone on a closing basis with intraday EMAs flipping into supportive roles would weaken the continuation case. If daily closes start to stack above the EMA 20 around 1.55, the narrative shifts away from sell the rip and toward a more balanced or even constructive medium-term bias.
Positioning, Risk and Uncertainty
XRPUSDT is currently a bearish-trend, low-volatility, high-fear market. The downtrend is intact on the daily chart, but intraday data shows the first signs of balance and a mild bid at 1.37. That combination often precedes either a final washout or the start of a grinding recovery.
For traders, the key is to recognize that:
- The macro bias remains bearish as long as XRP trades under the daily EMAs (1.55 / 1.76 / 2.17).
- The tactical battleground right now is the 1.35–1.38 band, where pivots and short-term EMAs cluster.
- Extreme fear and compressed intraday volatility mean that when the next move comes, it can be sharper than current ranges imply.
Whether traders lean bullish or bearish, the environment calls for respecting both downside continuation risk and the possibility of a sharp mean-reversion rally. Position sizing, leverage, and stop placement matter more than usual here because the market can move quickly once it chooses a direction out of this consolidation zone.


 English (US) ·