
 1 month ago
35
1 month ago
35

Robinhood stock enters earnings week balanced on a knife’s edge. HOOD closed at $101.58 on July 23, sitting almost exactly on the daily pivot of $101.67. Momentum has stalled. The intraday structure tilts bearish ahead of the July 29 print.
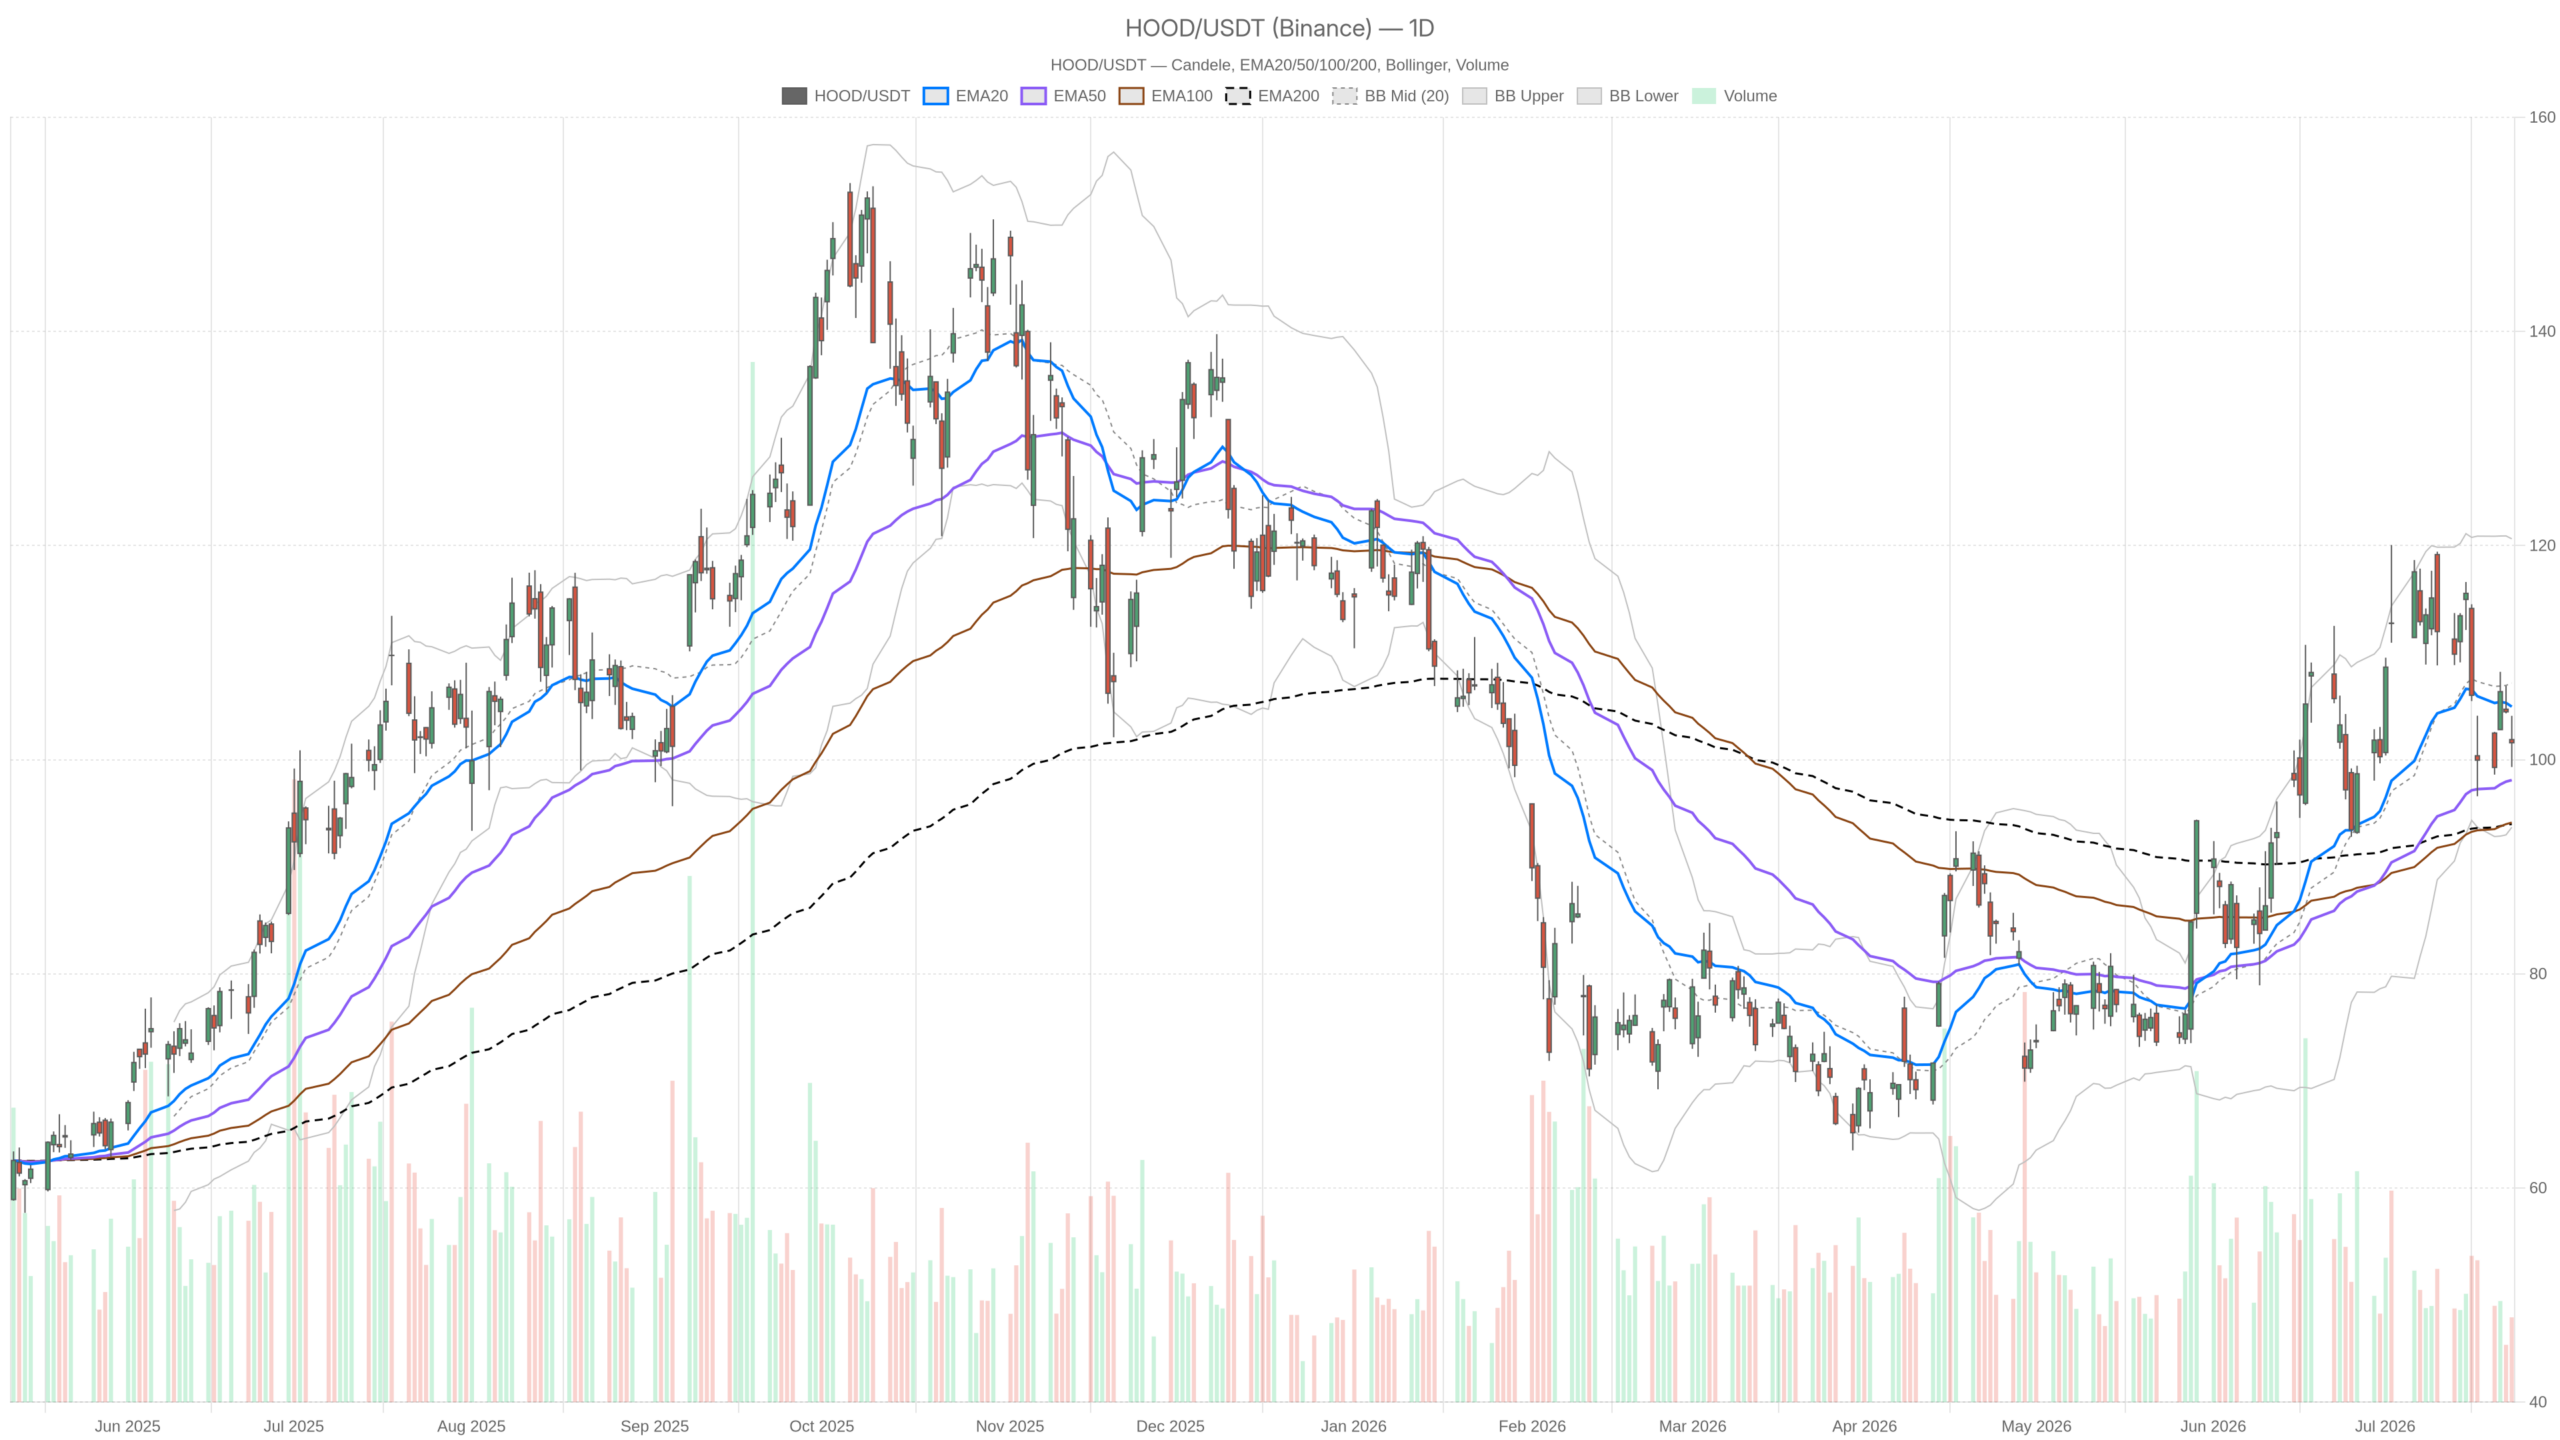 HOOD — daily chart with candlesticks, EMA20/EMA50 and volume.
Key takeaways
- HOOD closed at $101.58 on July 23, nearly identical to the daily pivot of $101.67
- Daily structure remains constructive above EMA50 ($98.10) and EMA200 ($93.99)
- A MACD bearish crossover and price below EMA20 ($104.96) confirm fading near-term momentum
- Options markets price a 9.2% implied move — roughly $9 either way — around the July 29 earnings release
- Prediction-market revenue could overtake crypto revenue in Q2, potentially reshaping the investment narrative
Daily Bias: Robinhood Stock Remains Supported, But Momentum Fades
The daily trend for Robinhood stock remains moderately bullish on a structural basis. At the same time, near-term momentum has rolled over decisively. Long-term support is intact while short-term signals flash caution.
Price trades above both the EMA50 at $98.10 and the EMA200 at $93.99. This reflects a solid medium-to-long-term trend. However, the EMA20 at $104.96 now sits above current price. That signals near-term buying pressure has clearly faded.
The daily MACD reinforces the concern. The MACD line sits at 2.10, but it has crossed below the signal line at 4.03. The resulting negative histogram of -1.93 confirms buying pressure has softened meaningfully from recent highs. Meanwhile, the RSI at 48.2 sits effectively neutral — not yet oversold enough for dip buyers, nor overbought.
Bollinger Band Structure Still Offers Room
The Bollinger Bands on the daily frame tell a nuanced story. The midline sits at $107.16 and the lower band at $93.69 provides a wide structural cushion. The upper band extends to $120.63, illustrating the residual upside volatility HOOD still carries. The ATR of $6.32 confirms daily ranges remain substantial. Any single catalyst could move the stock meaningfully within this band.
Overall, the daily regime is flagged as neutral. That aligns with the mixed evidence: long-term trend supports bulls, but short-term momentum supports caution.
Hourly Timeframe Complicates the HOOD Picture
The hourly chart introduces a clear short-term bearish lean for HOOD. Price sits below key moving averages, and bearish momentum is still building rather than exhausting.
On the 1H chart, price at $101.58 trades below both the EMA20 at $103.54 and the EMA50 at $105.40. Only the EMA200 at $103.17 offers nearby resistance context. This EMA stacking above current price confirms the intraday trend points lower.
The 1H MACD has turned negative. The line reads -0.97 with the signal at -0.75. The histogram of -0.22 indicates bearish momentum on this timeframe is still building. In contrast, the 1H RSI at 40.43 drifts toward oversold territory without quite reaching it. That level reflects a stock under quiet selling pressure, not panic.
The hourly Bollinger midline at $104.60 sits well above price. The lower band at $100.25 marks the nearest meaningful support. The hourly ATR of $1.60 frames reasonable intraday swings. Overall, the hourly picture weakens the daily bullish case in the near term. The longer-term uptrend remains intact, but the intraday structure suggests sideways to slightly lower is the path of least resistance.
15-Minute Context: Bearish Regime, Tight Range
The 15-minute timeframe is explicitly bearish for Robinhood stock. The micro-structure offers no clear entry signal, with price compressing into a tight range ahead of the earnings catalyst.
Price is compressed between the 15m pivot support at $101.26 and resistance at $101.90. The MACD histogram at 0.07 hints at marginal stabilization. Still, with RSI at 40.60 and all three EMAs stacked above current price, the micro-structure gives no clear buy signal for bulls.
At this resolution, HOOD grinds along the lower end of its intraday range. The 15m ATR of $0.58 confirms range compression. A tight coil ahead of a binary event like earnings is typical. It does not alter the strategic bias one way or the other.
Bullish Scenario: Earnings Beat Could Reignite the Robinhood Stock Trend
The bullish case for Robinhood stock hinges on a Q2 earnings beat. A confirmed break above $104.96 and $104.01 would be the first technical signal that bulls are regaining control.
The Q2 earnings report is due July 29, and market expectations lean toward outperformance. Analysts cited by Yahoo Finance suggest HOOD possesses the right combination of factors for an earnings beat. Separately, Bernstein analysts project that Robinhood’s prediction markets could reach $1.7 billion in revenue by 2028. This structural growth narrative could reset sentiment sharply higher if Q2 numbers validate it.
Notably, analysts expect prediction-market revenue to overtake crypto as early as the second quarter. That would mark a meaningful shift in the company’s revenue mix. It could also attract a new class of institutional investors beyond the crypto-adjacent crowd.
On the chart, a break above the EMA20 at $104.96 and resistance at $104.01 — the daily R1 — would be the first confirmation. A sustained move toward the Bollinger midline at $107.16 would add further weight. The daily structure above EMA50 and EMA200 gives that scenario room to develop.
Bearish Scenario: HOOD Momentum Deterioration and Earnings Risk
The bearish scenario for HOOD is harder to dismiss given current momentum readings. A disappointment on July 29 could drive price toward support at $99.23 and potentially as low as the $93.69–$93.99 zone.
The MACD cross on the daily, combined with price trading below the EMA20, reflects a stock that may be in the early stages of a larger pullback. If earnings disappoint — or if guidance fails to meet elevated expectations — a move toward the daily S1 at $99.23 becomes likely. A break below that level opens the path toward the Bollinger lower band at $93.69 and the EMA200 at $93.99.
The implied move of 9.2% around the July 29 earnings report underscores the binary risk embedded in Robinhood stock. In dollar terms, that maps to roughly $9 in either direction. That is not a comfortable range to hold through without conviction.
Furthermore, the hourly trend already points lower. Even a neutral outcome that merely meets expectations may not reverse the current intraday drift. The stock would need a genuine positive catalyst to overcome the weight of deteriorating momentum.
Institutional Interest Adds a Layer of Context
Institutional disclosures lend fundamental credibility to the Robinhood stock thesis. Larger players are treating HOOD as a legitimate portfolio holding, not merely a speculative trade.
Farmers & Merchants Investment Inc., a $4.1 billion bank holding company, recently disclosed direct exposure to HOOD alongside Bitcoin and XRP. That disclosure at current price levels suggests some larger institutions view the stock with genuine conviction. It does not change the technical picture. Still, it adds weight to the bullish argument on a fundamental level.
Positioning Ahead of the July 29 Print
Robinhood stock is trapped in a pre-earnings holding pattern. The most sensible stance is to treat the $99.23–$104.01 range as the decision zone and await a convincing break on volume.
The daily structural trend favors bulls over the medium term. However, near-term momentum has clearly softened. The hourly and 15-minute frames both lean bearish. This multi-timeframe conflict argues against aggressive directional positioning before the earnings release.
Therefore, the current range — roughly $99.23 to $104.01 based on daily pivot levels — should be treated as the decision zone. A convincing break in either direction, ideally on volume, will set the post-earnings tone. With an estimated 9.2% implied move priced into options, volatility is expected to expand materially around July 29. Traders should size accordingly and stay alert to how the prediction-markets narrative and Q2 results align — or conflict — with the chart.
FAQ
What is the technical outlook for Robinhood stock ahead of earnings?
The daily trend remains moderately bullish with price above the EMA50 ($98.10) and EMA200 ($93.99). However, near-term momentum has softened, with the MACD crossing bearish and price below the EMA20 ($104.96). The hourly and 15-minute timeframes lean bearish, creating a multi-timeframe conflict ahead of the July 29 print.
What are the key price levels to watch for HOOD?
On the upside, a break above the EMA20 at $104.96 and daily R1 at $104.01 would signal bulls regaining control. On the downside, daily S1 at $99.23 is the first support. Below that, the Bollinger lower band at $93.69 and EMA200 at $93.99 represent the next structural floor.
How much could Robinhood stock move on earnings?
Options markets are pricing an implied move of 9.2% around the July 29 earnings report. That translates to roughly $9 in either direction from current levels near $101.58, reflecting the significant binary risk embedded in the stock.
What is the bullish catalyst for Robinhood stock?
The bullish case centers on a potential Q2 earnings beat and the structural growth of prediction markets. Bernstein analysts project prediction-market revenue could reach $1.7 billion by 2028 and may overtake crypto revenue as early as Q2 2025.
Disclaimer: This article is for informational purposes only and does not constitute financial advice, an investment recommendation, or a solicitation to buy or sell any financial instrument or cryptocurrency. The analysis provided is not indicative of future results. Investing in crypto assets and financial markets carries a high risk of capital loss. Always do your own research (DYOR) and consult a qualified financial advisor before making any decision.
Article produced with the assistance of artificial intelligence and reviewed by the editorial team.






 English (US) ·