
 2 hours ago
8
2 hours ago
8

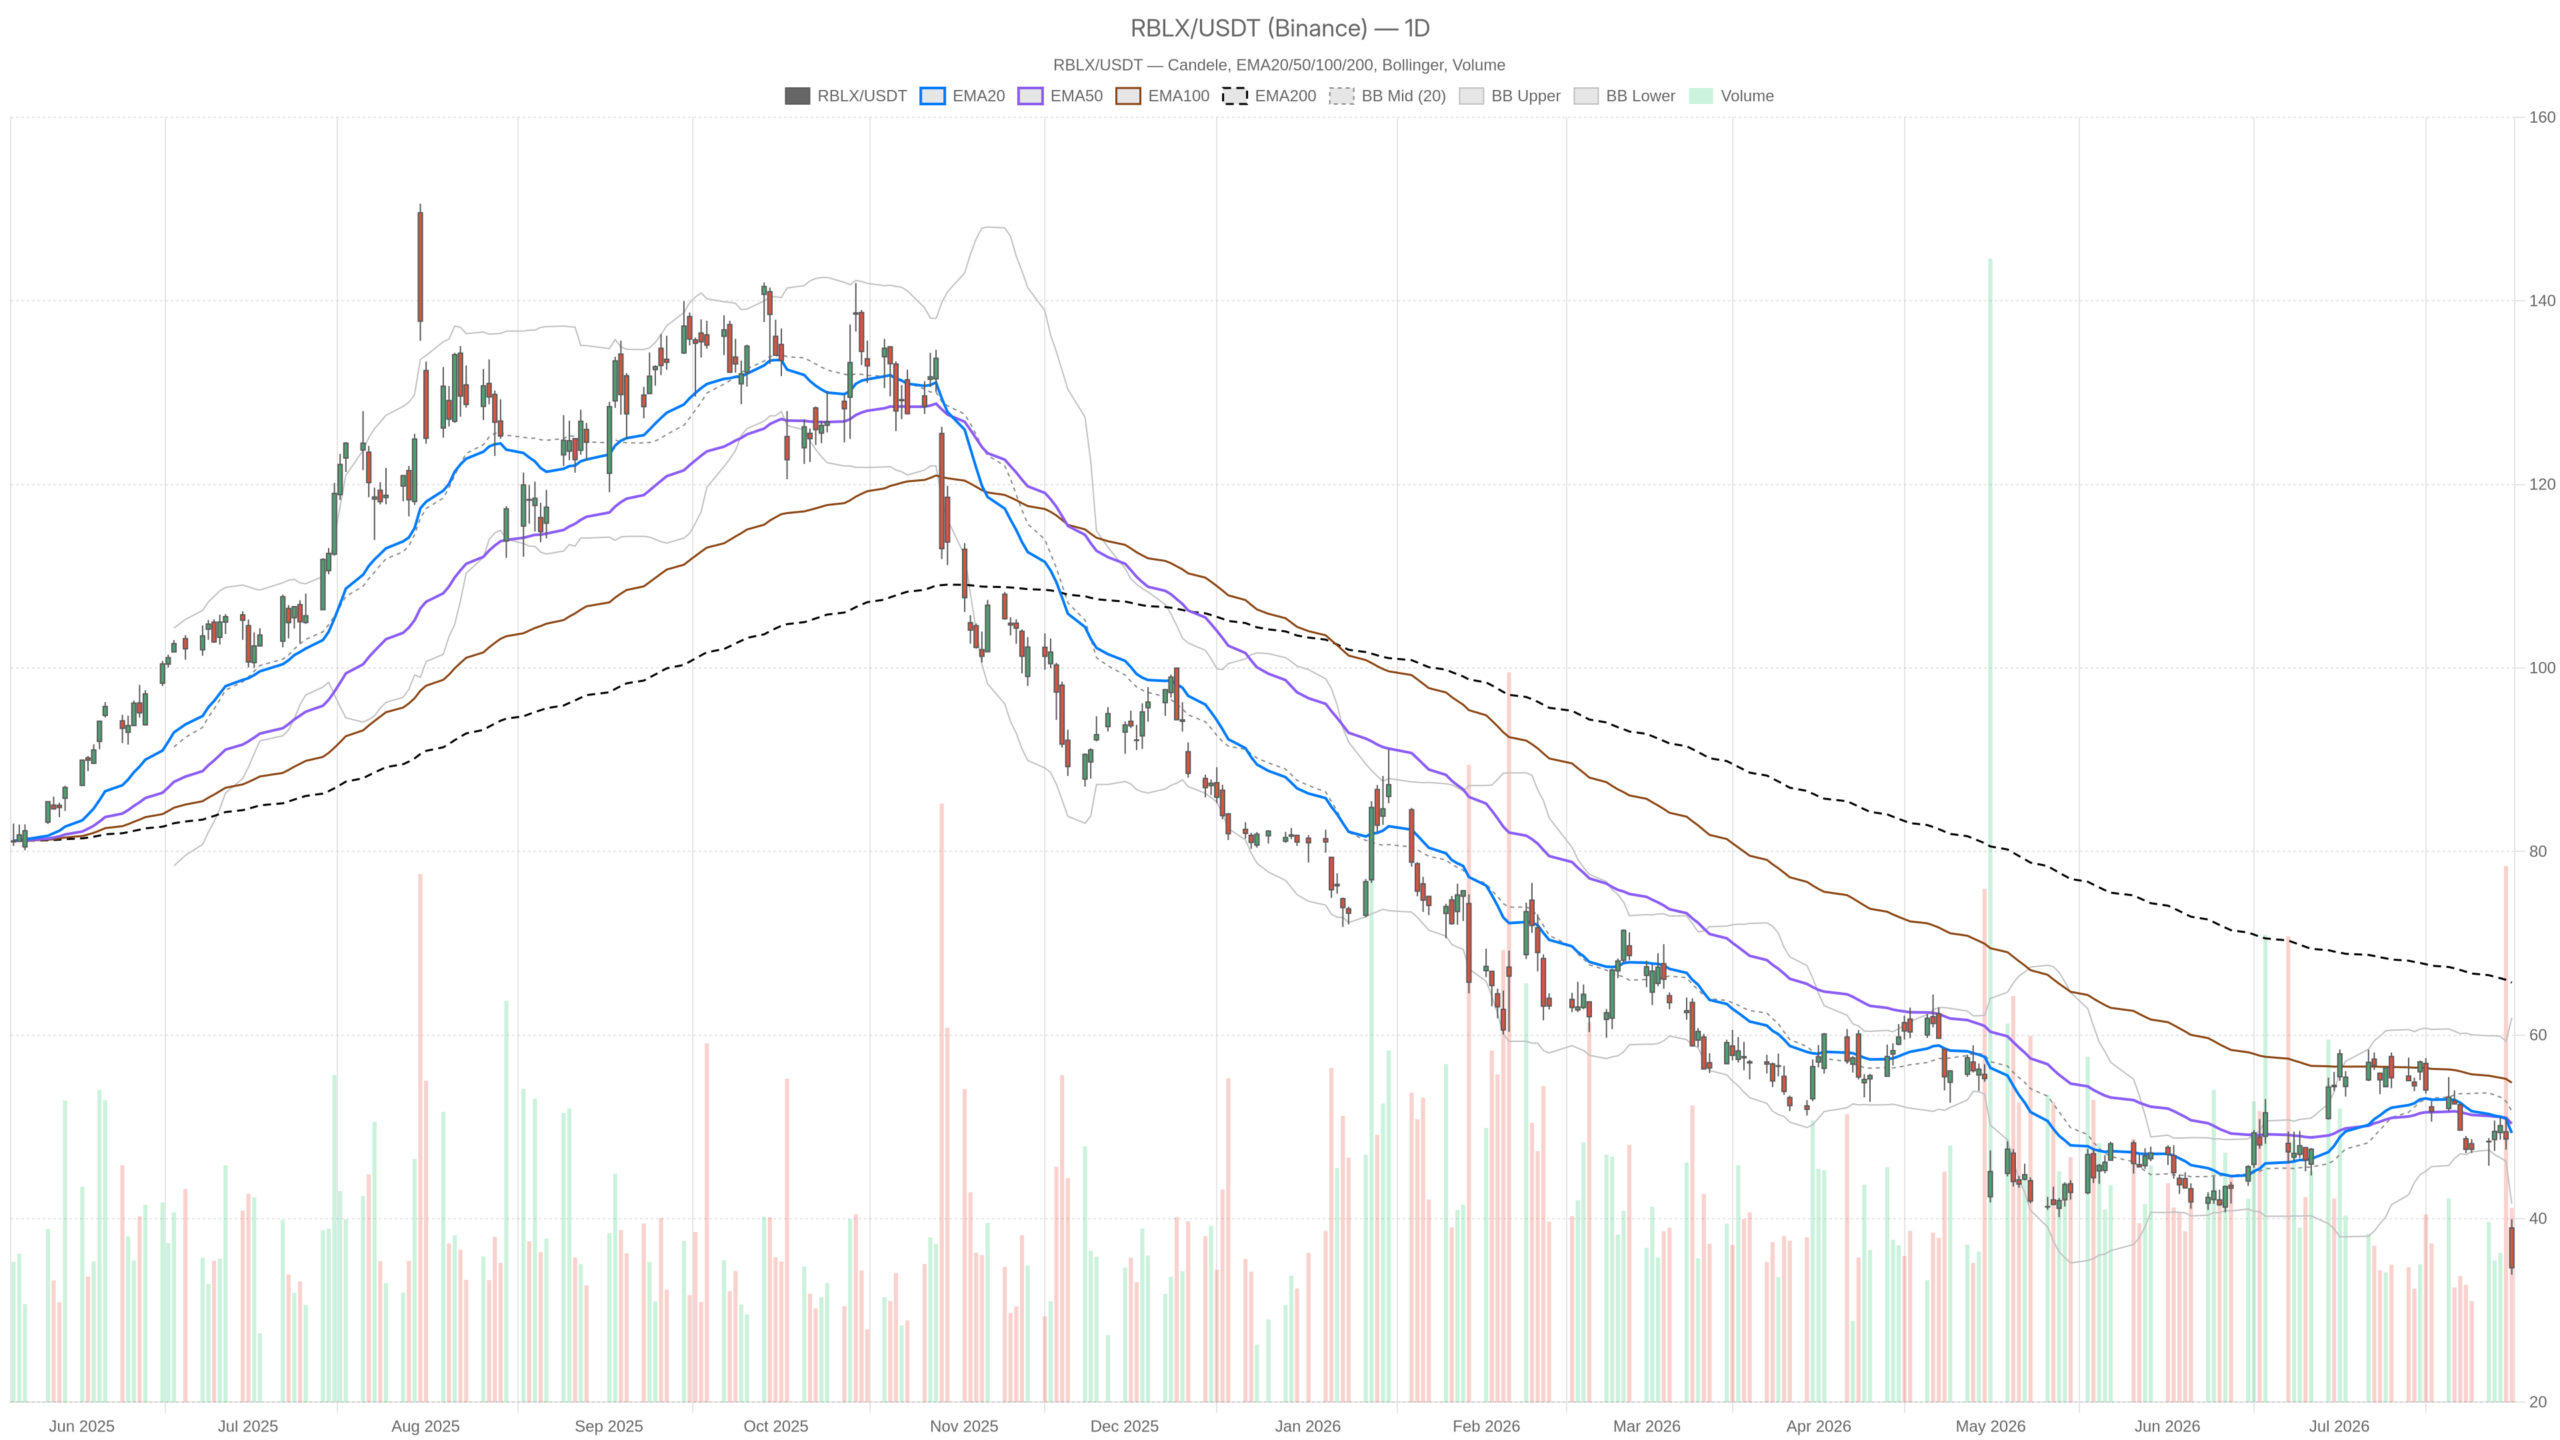 RBLX — daily chart with candlesticks, EMA20/EMA50 and volume.
Roblox Corporation Stock Takes Its Worst Single-Day Hit on Record
Roblox Corporation stock collapsed 29% on July 31 after the company missed Q2 revenue expectations and withdrew full-year guidance entirely. Closing at $34.65, RBLX suffered its worst single session on record. This is a structural reassessment, not a routine dip.
Key takeaways
- RBLX crashed 29% on July 31 — its worst single-day loss ever — after missing Q2 revenue and pulling full-year guidance.
- Daily RSI hit 25.88, deeply oversold, but this signals exhaustion without a clear floor during a trend breakdown.
- Price at $34.65 sits far below all key daily moving averages: EMA20 at $49.33, EMA50 at $50.34, and EMA200 at $65.71.
- The daily pivot at $36.15 is the first resistance bulls must reclaim; failure opens the path to S1 at $32.37.
- Daily ATR of $3.62 represents over 10% of the stock price, confirming extreme volatility hostile to precision positioning.
What Drove the Roblox Corporation Stock Selloff
Weaker bookings, slowing daily active users, and friction from child safety guardrails converged to undercut the revenue growth narrative. When a company pulls full-year guidance entirely, it signals genuine visibility problems. Wall Street responded with a wave of sell ratings. A handful of analysts defend a longer-term view. However, that debate is secondary to what price action is communicating right now.
Daily Timeframe: RBLX Bias Is Unambiguously Bearish
The daily chart confirms an unambiguously bearish trend across every major indicator. Price at $34.65 sits dramatically below the EMA20 at $49.33, the EMA50 at $50.34, and the EMA200 at $65.71. That separation reflects advanced trend deterioration, not a shallow pullback.
At 25.88, the daily RSI sits firmly in oversold territory. During a trend breakdown, however, oversold RSI rarely signals an immediate reversal. It more accurately reflects exhaustion without a clear floor. Meanwhile, the MACD paints an equally grim picture. The line stands at -1.71 against a signal of -0.13. The resulting histogram of -1.58 shows sharply widening negative divergence. This is consistent with accelerating bearish momentum, not deceleration.
Bollinger Bands add further context. With the lower band at $41.60, RBLX has broken well below that boundary on a daily close. That is an extreme deviation. The daily ATR of $3.62 underscores the violent volatility. Today’s candle alone spanned nearly $6. The daily pivot structure places support at $32.37 and resistance at $38.42. The pivot point sits at $36.15. Price is currently sandwiched between S1 and the session low of $33.88. There is very little structural cushion below.
Hourly Timeframe: Confirming the Damage, Adding Depth
On the hourly chart, the same bearish regime appears with even more extreme readings. The H1 RSI sits at 17.03, reflecting near-total selling exhaustion on the shorter timeframe. Notably, the MACD shows a line of -3.65 against a signal of -2.00. The histogram of -1.65 confirms momentum remains negative and has not yet begun to curl.
Mirroring the daily, the H1 EMA structure shows the EMA20 at $43.22, the EMA50 at $46.83, and the EMA200 at $50.06. All sit far above price. No moving average support exists anywhere close to current levels. In contrast, the Bollinger lower band on the hourly stands at $32.70. This is below the current price. It technically leaves room for additional downside before that band is tested. The H1 pivot places resistance at $34.88 and support at $34.45. This very tight range suggests the stock is consolidating after the initial shock.
15-Minute Chart: A Modest Flicker, Nothing More
No meaningful reversal signal appears on the 15-minute chart. At best, it shows a brief stabilization after an extraordinary selling event. The MACD histogram has turned marginally positive at 0.48. However, the MACD line remains deeply negative at -2.50. This micro-level divergence suggests only that very short-term selling pressure may be easing slightly.
At 23.16, the 15m RSI is also deeply oversold. The Bollinger midline on this timeframe sits at $34.63, essentially at current price. This indicates price has stabilized around the 15m mean after the spike down. The 15m ATR of just $0.46 and the tight pivot range between $34.52 and $34.77 confirm intraday volatility has compressed significantly. Overall, this timeframe is useful only for short-term execution context. It changes nothing about the broader directional story.
The Bullish Scenario: What Would Need to Happen for RBLX
A credible bullish recovery requires several conditions to align. First, the company must demonstrate a path back to monetization growth. This would likely require loosening age verification friction. Alternatively, it could involve a new revenue stream or a clear timeline for guidance reinstatement. Second, price would need to reclaim the daily pivot at $36.15 with volume. That alone would not erase the structural damage. Still, it would represent the first meaningful technical step forward.
At 25.88, the daily RSI does create conditions for a technical bounce. In past extreme selloffs, stocks this deeply oversold have seen sharp counter-trend rallies. This can happen even without fundamental resolution. At the same time, the few analysts pushing back against the sell narrative could provide a catalyst. Their argument that the long-term growth story remains intact might gain traction if any positive data point emerges. The daily S1 at $32.37 remains the next structural floor if price continues lower.
The Bearish Scenario: What Invalidates Any Recovery
Currently, the bearish case represents the path of least resistance. Withdrawn guidance is not a short-term problem. It signals that management itself cannot project the impact of safety guardrails on forward revenue. That uncertainty is precisely what keeps institutional capital on the sidelines. Notably, the revenue miss compounded by slowing DAUs points to real user-monetization friction. This is not just a one-quarter blip.
Technically, any failure to reclaim $36.15 would confirm sellers remain in control. A break below the session low of $33.88 would open a path toward the daily S1 at $32.37. With the EMA200 sitting at $65.71, RBLX would need an extraordinary fundamental reversal. Only that could rebuild a constructive long-term technical structure. Therefore, the MACD histogram widening further into negative territory would be the clearest signal. It would confirm the capitulation phase has not yet concluded.
Positioning, Volatility, and the Risk Ahead for RBLX
RBLX is currently one of the most technically damaged large-cap names in the market. The daily ATR of $3.62 against a stock priced at $34.65 represents extraordinary relative volatility. It exceeds 10% of price in expected daily movement. That environment is hostile to precision positioning. It is favorable only for those comfortable with sharp, fast swings in either direction.
This fundamental picture will not clarify until the company provides updated guidance. Alternatively, it must demonstrate tangible monetization recovery. Until then, the path of least resistance remains lower. The technical regime across all three timeframes is classified as bearish. The burden of proof rests entirely with the bulls. Uncertainty, for now, is the defining characteristic of Roblox Corporation stock.
FAQ
Why did Roblox Corporation stock crash on July 31?
Roblox Corporation stock crashed 29% after the company reported Q2 results that missed revenue expectations and withdrew full-year guidance entirely. Weaker bookings, slowing daily active users, and friction from child safety guardrails — particularly the age verification rollout — converged to undermine the revenue growth narrative that supported RBLX’s valuation.
Is RBLX stock oversold enough to buy?
The daily RSI at 25.88 and the hourly RSI at 17.03 are both deeply oversold. However, during a trend breakdown, oversold readings rarely signal an immediate reversal. They more accurately reflect selling exhaustion without a clear floor. A credible bullish case would require the stock to reclaim the daily pivot at $36.15 with volume, alongside fundamental improvement in monetization.
What is the next support level for Roblox stock?
The session low of $33.88 is the immediate level to watch. Below that, the daily S1 at $32.37 represents the next structural support floor. The Bollinger lower band on the hourly chart at $32.70 provides additional technical reference. A break below $33.88 would confirm sellers remain in firm control.
What would it take for RBLX to recover?
A meaningful recovery would require the company to demonstrate a credible path back to monetization growth. This could involve loosening age verification friction, launching a new revenue stream, or providing a clear timeline for guidance reinstatement. Technically, price must reclaim the daily pivot at $36.15 with volume as a first step. With the EMA200 at $65.71, rebuilding a constructive long-term structure would take an extraordinary reversal.
Disclaimer: This article is for informational purposes only and does not constitute financial advice, an investment recommendation, or a solicitation to buy or sell any financial instrument or cryptocurrency. The analysis provided is not indicative of future results. Investing in crypto assets and financial markets carries a high risk of capital loss. Always do your own research (DYOR) and consult a qualified financial advisor before making any decision.
Article produced with the assistance of artificial intelligence and reviewed by the editorial team.






 English (US) ·