
 2 hours ago
15
2 hours ago
15

Strategy stock remains trapped in a structural downtrend, but a surprise capital framework announcement has sparked short-term buying interest. MSTR closed at $100.77 on July 2, well below all major long-term averages. The intraday rally complicates an otherwise bearish picture.
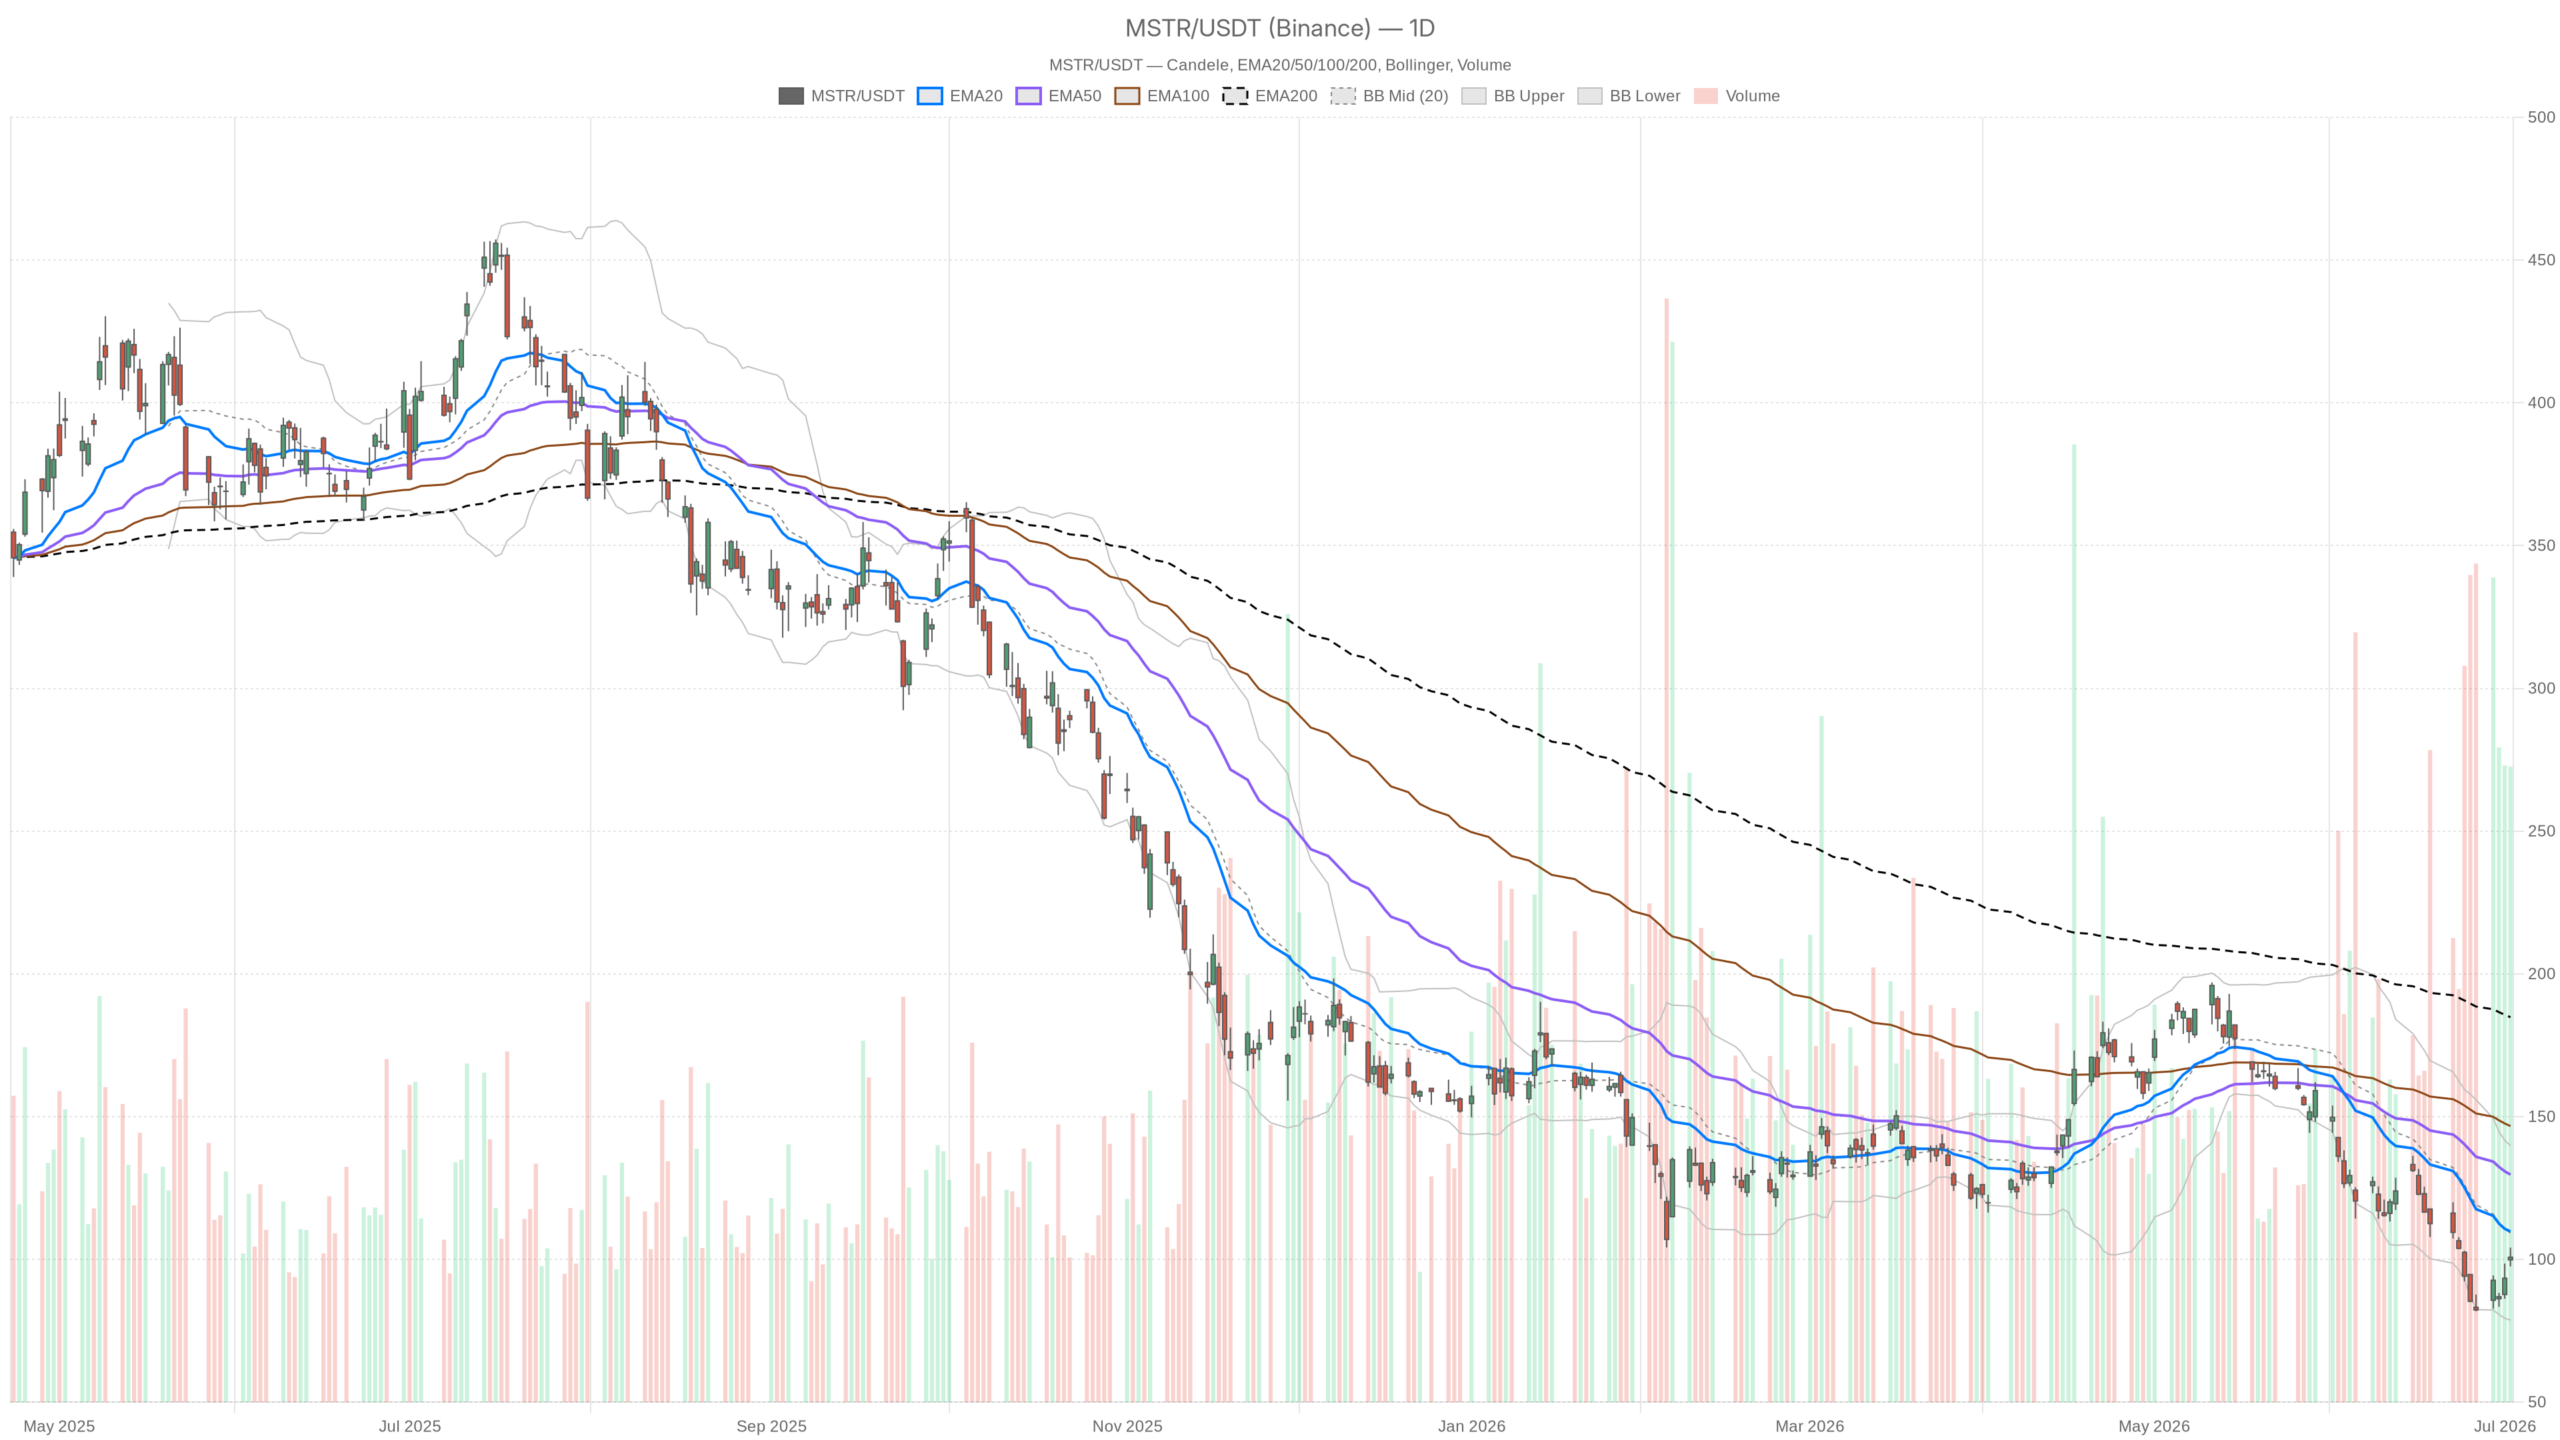 MSTR — daily chart with candlesticks, EMA20/EMA50 and volume.
Key takeaways
- Strategy stock closed at $100.77 on July 2, trading below all three major daily EMAs in a confirmed bearish regime.
- Daily RSI at 40.62 shows no oversold exhaustion signal, while the MACD histogram near zero suggests waning downside momentum rather than a reversal.
- A new $1.25 billion Digital Credit Capital Framework triggered a 7.2% intraday rally, shifting 1-hour momentum to bullish.
- Hourly RSI at 62.04 and a positive MACD crossover confirm real short-term buying interest, though the 15-minute chart shows fading momentum near $101.
- The $100.82–$104.06 range represents the critical battleground between structurally dominant daily bearish forces and news-driven intraday strength.
Strategy Stock Daily Structure: A Broken Trend Confirmed
Strategy stock trades in an unequivocal bearish regime on the daily timeframe, with price sitting below every major moving average in a cascading breakdown. Price trades below the EMA20 at $109.77, the EMA50 at $129.67, and — most strikingly — the EMA200 at $184.82. This cascading EMA breakdown reflects sustained selling pressure over an extended period. Strategy stock is not simply pulling back. It is trading near multi-year lows, having shed a substantial portion of its peak value. The gap between current price and the 200-day EMA alone — roughly $84 — signals just how far the trend has deteriorated.
Meanwhile, the daily RSI at 40.62 reinforces that picture. The reading is not yet in oversold territory. No strong technical exhaustion signal is forcing a reversal. The MACD line at -14.96 sits just below the signal at -14.92, producing a negligible histogram of -0.04. That near-zero reading indicates the bearish trend is losing downside momentum. However, it is not yet a bullish crossover. It is a pause, not a pivot.
Bollinger Bands place the midline at $109.27, well above current price. The lower band sits at $78.73. MSTR trades in the lower half of its Bollinger range, consistent with a stock under sustained distribution. The daily ATR of $10.14 reflects a genuinely volatile instrument — meaningful in absolute terms for a sub-$110 stock. Daily pivot support is at $97.52, with resistance at $104.06. The close at $100.77 puts price roughly in the middle of that short-term daily range.
Intraday Momentum Shifts to Neutral-Bullish for MSTR
On the 1-hour chart, Strategy stock shows a markedly more constructive picture. Price trades above short-term averages as momentum indicators flash a confirmed bullish signal. The 1H regime is classified as neutral, but indicators lean constructively. RSI on the hourly stands at 62.04 — a reading reflecting real buying interest, not mere noise.
The hourly MACD is positive. The line at 2.64 sits above the signal at 1.89, generating a histogram of 0.75. That is a confirmed bullish crossover on the intraday timeframe. Meanwhile, the 1H EMA20 at $96.23 and EMA50 at $96.40 both trail below current price. Short-term momentum has already pushed MSTR above its near-term averages.
The Catalyst — Digital Credit Capital Framework
Strategy stock’s intraday strength stems directly from the newly announced Digital Credit Capital Framework, a structural shift in how Michael Saylor manages the balance sheet. Strategy announced the framework on July 1. It authorizes up to $1.25 billion in Bitcoin sales to fund capital actions. It also includes a $2 billion share buyback program and an elevated preferred dividend rate. The stock jumped 7.2% in early trade on July 2.
This marks a meaningful shift away from a pure Bitcoin accumulation model. The company is moving toward active balance sheet management. Markets initially read that as bullish. However, reactions to capital structure changes can prove complex and short-lived.
15-Minute Micro Structure Shows Fading Momentum
The 15-minute chart confirms the micro-trend remains bullish, though early signs of momentum exhaustion are appearing near the $101 level. Price holds above all three short-term EMAs. However, the 15m MACD histogram has turned slightly negative at -0.15. This suggests the immediate push is losing steam near the $101 area. Hourly pivot resistance sits at $101.38, just above the current close. That level becomes the immediate ceiling to watch for short-term traders. Support on the 15m is clustered around $100.41.
Scenarios for Strategy Stock
Two distinct scenarios frame the outlook for Strategy stock. The bullish case relies on catalyst continuation. The bearish case remains anchored in structural damage. Both deserve careful attention given the clash between daily trend and intraday momentum.
Bullish Case — Catalytic Continuation
The bullish scenario hinges on whether the capital framework catalyst can sustain buying pressure beyond the initial intraday pop. If MSTR clears $101.38 on the hourly and consolidates above the daily pivot at $100.82, the next meaningful level becomes daily R1 at $104.06.
A sustained move toward $109 — the daily EMA20 — would require continued Bitcoin strength or a significant rerating of the new financial structure. Valuation analysts already argue the stock looks undervalued on both DCF and book value metrics at these levels. This could attract fundamental buyers to support any technical bounce.
Bearish Case — Structural Dominance
The bearish case remains structurally dominant, with the daily downtrend posing a significant headwind that could absorb any short-term catalyst. In contrast to the bullish view, the daily trend is deeply negative. All three major daily EMAs are stacked above current price in a bearish sequence. If the catalytic intraday rally fades, MSTR could drift back toward daily pivot support at $97.52. Over a longer horizon, it could test the lower Bollinger Band at $78.73. The key risk for bulls: if markets interpret Saylor’s new framework as a retreat from conviction rather than a strategic evolution, initial enthusiasm could reverse quickly.
Overall Assessment
Strategy stock presents a genuinely split technical picture, with bearish daily structure clashing against real short-term momentum driven by a newsflow catalyst. The daily structure is bearish with no confirmed reversal signal. The 1-hour timeframe shows tangible short-term momentum. The 15-minute chart offers a minor caution flag near current levels.
Positioning here carries asymmetric uncertainty. The news-driven bounce could extend, but it is doing so against a significant structural headwind. Volatility remains elevated given the daily ATR and MSTR’s inherent sensitivity to Bitcoin price moves. Traders should treat the $100.82–$104.06 range as the key battleground in the sessions ahead.
FAQ
Is Strategy Stock in a bear market?
Yes. MSTR trades well below the EMA200 at $184.82, and all three major daily EMAs are stacked above current price in a bearish sequence. The daily RSI at 40.62 confirms the downtrend, though it has not reached oversold extremes that would signal imminent reversal.
What caused Strategy Stock to rally on July 2?
Strategy announced a new Digital Credit Capital Framework on July 1, authorizing up to $1.25 billion in Bitcoin sales, a $2 billion share buyback, and an elevated preferred dividend. The stock gained 7.2% in early trade on the news as markets reacted to the balance sheet restructuring.
Can the rally in Strategy Stock be sustained?
It faces significant structural headwinds. The bullish case requires MSTR to clear $101.38 and consolidate above $100.82, targeting $104.06. However, the dominant daily downtrend means any fade in catalytic momentum could push price back toward $97.52 or lower. The daily EMA20 at $109.77 remains a formidable resistance level.
What is the key level to watch for Strategy Stock?
The $100.82–$104.06 range is the critical battleground. A sustained break above $104.06 would strengthen the bullish case. A failure to hold $100.82 would shift control back to the structurally dominant bearish daily trend.
Disclaimer: This article is for informational purposes only and does not constitute financial advice, an investment recommendation, or a solicitation to buy or sell any financial instrument or cryptocurrency. The analysis provided is not indicative of future results. Investing in crypto assets and financial markets carries a high risk of capital loss. Always do your own research (DYOR) and consult a qualified financial advisor before making any decision.
Article produced with the assistance of artificial intelligence and reviewed by the editorial team.


 English (US) ·