
 3 weeks ago
54
3 weeks ago
54
ServiceNow, Inc. stock delivered a strong Q2 2026 earnings beat on July 22, yet closed at $95.46 amid persistent technical weakness. Despite 24% revenue growth and an upgraded outlook, the charts across all timeframes remain firmly bearish — creating a sharp disconnect between fundamentals and price.
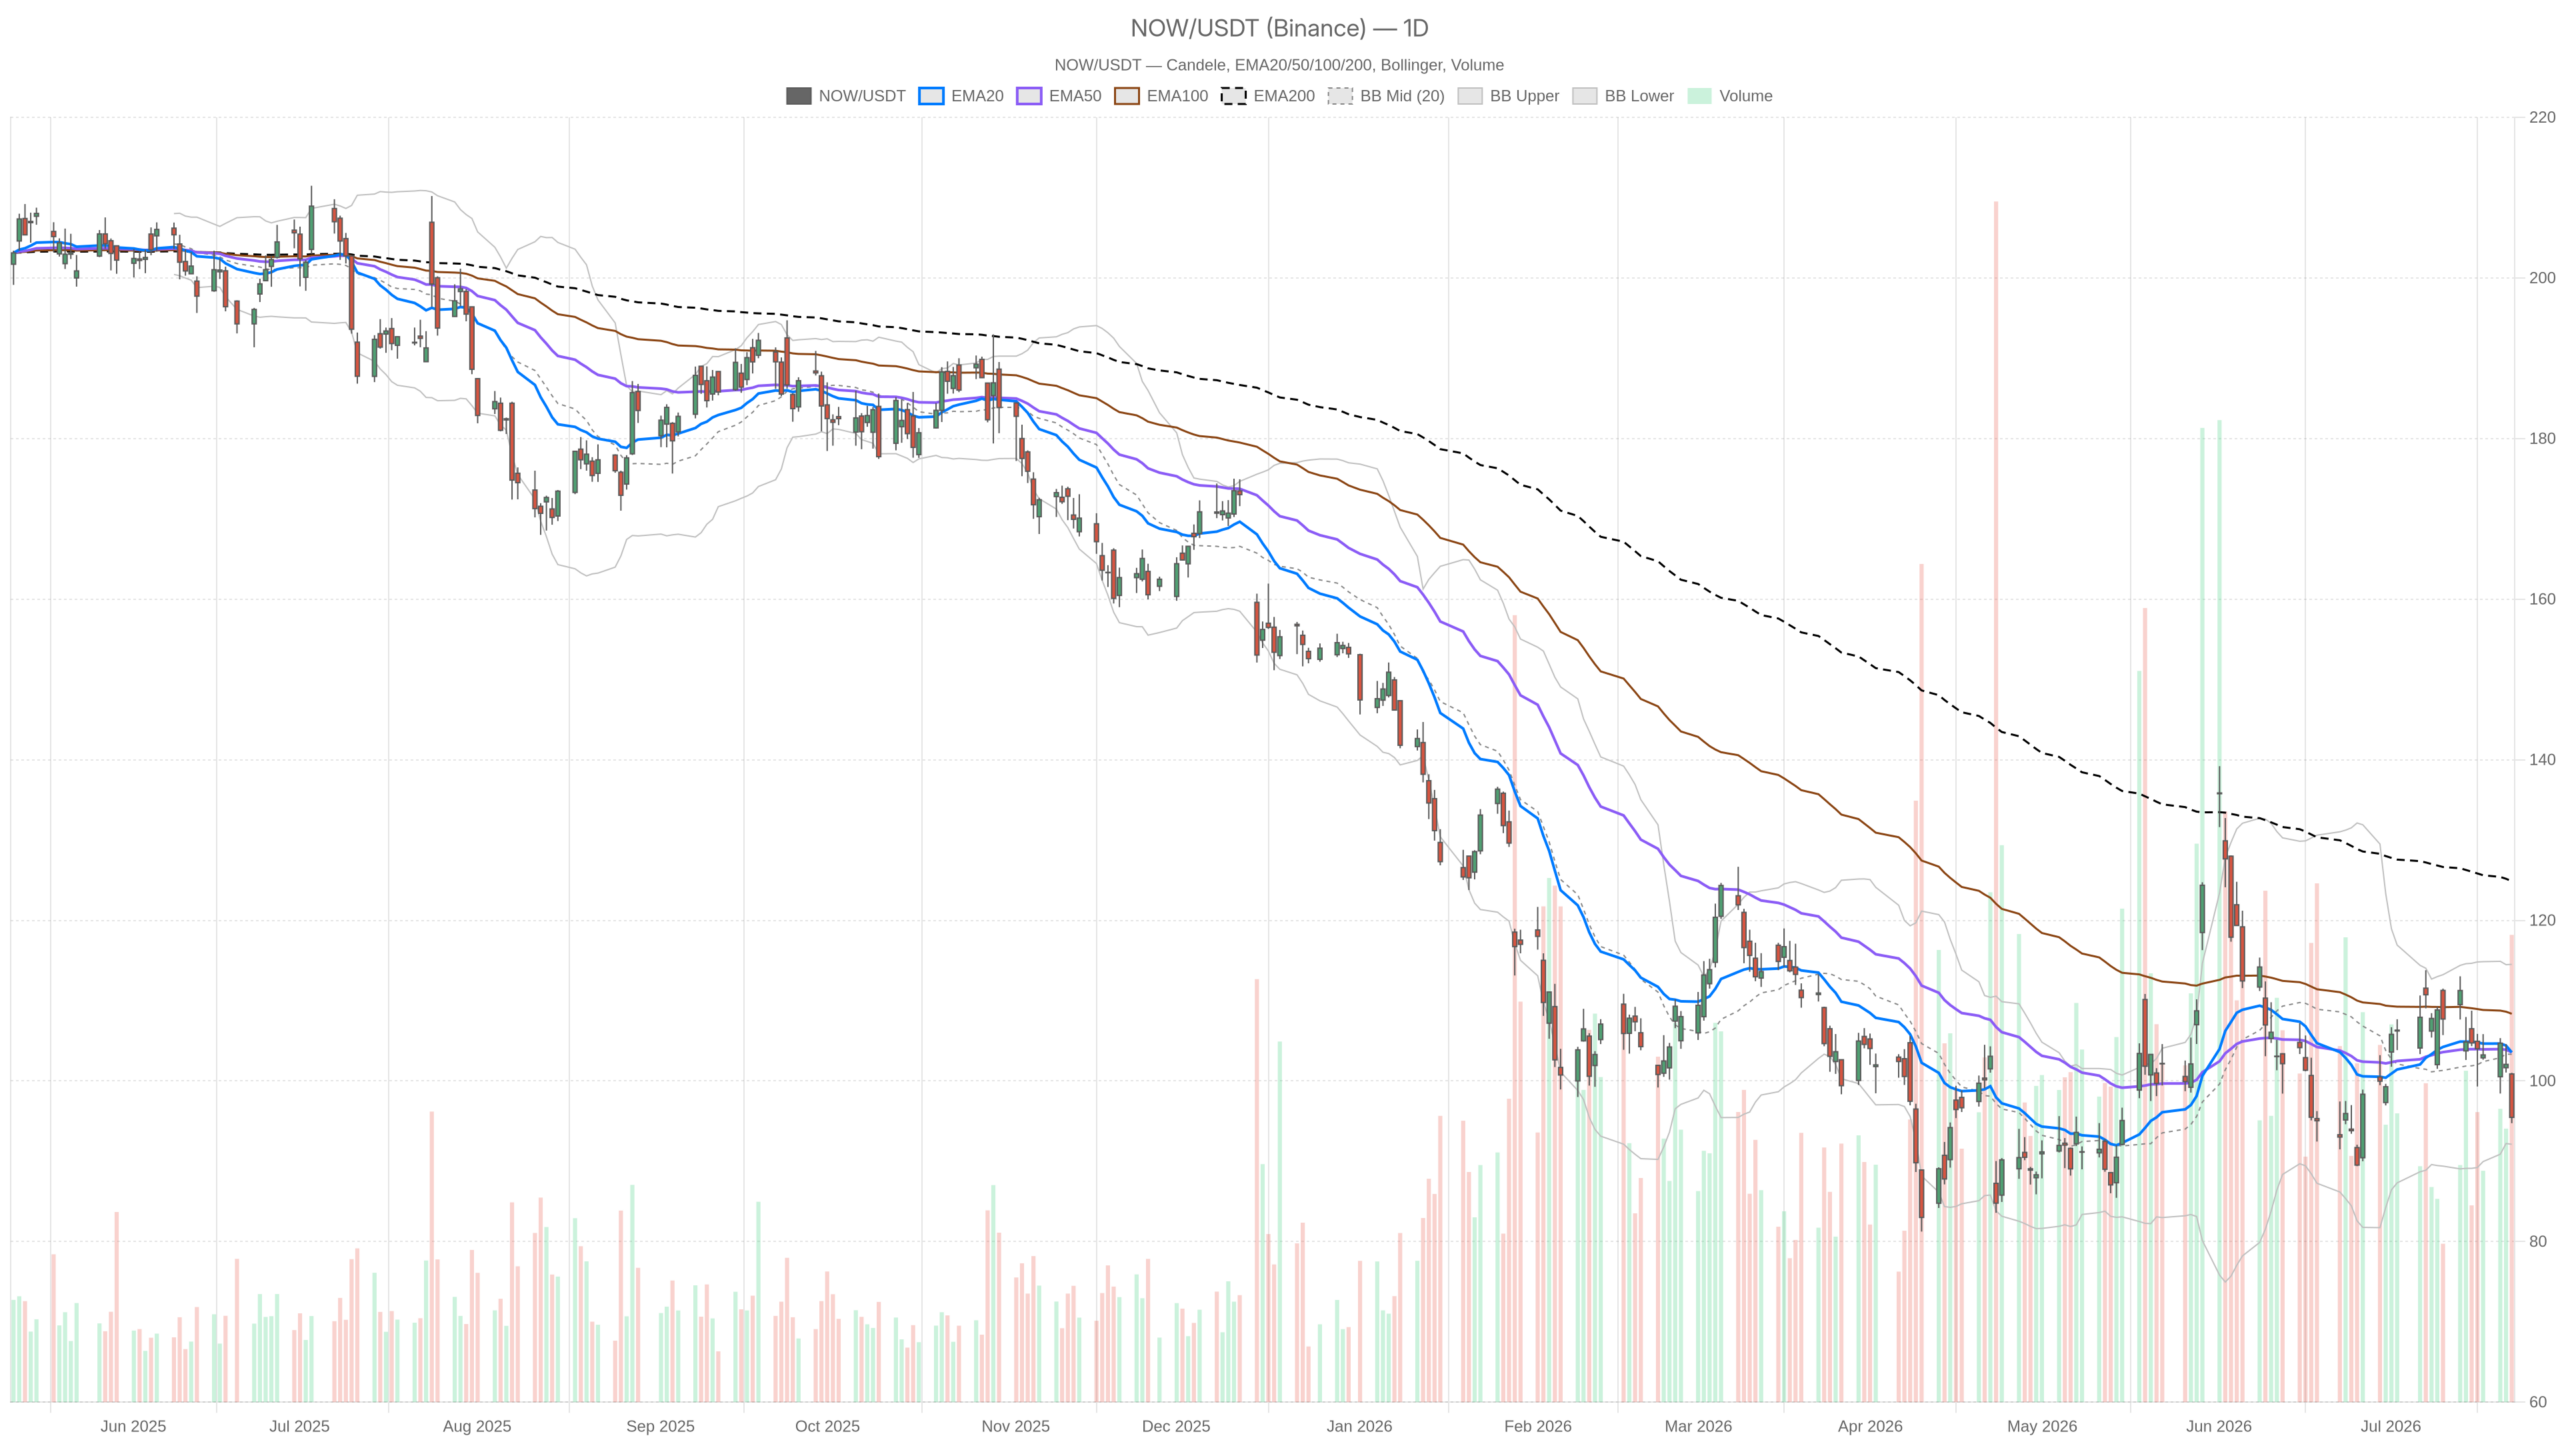 NOW — daily chart with candlesticks, EMA20/EMA50 and volume.
Key takeaways
- ServiceNow beat Q2 2026 earnings by +4.65% and revenue by +1.65%, with 24% revenue growth and an upgraded full-year outlook.
- NOW closed at $95.46 on July 22, roughly 30% below its EMA200 of $124.88.
- Daily RSI14 sits at 39.49, while hourly RSI14 has collapsed to 26.59 — firmly oversold.
- Bearish EMA structure persists across all timeframes, with EMA20 ($103.55) and EMA50 ($103.56) well above price.
- A close below daily S1 at $93.13 would extend the bearish structure meaningfully.
Daily Timeframe: Is NOW in a Bearish Regime?
Yes. The daily chart for ServiceNow, Inc. stock displays an unambiguous bearish regime, with price trading well below all major moving averages after a sharp post-earnings rejection. Price closed at $95.46 after trading as high as $101.01 intraday before pulling back sharply to a low of $94.74. That is a wide daily range of over six points — consistent with the ATR14 reading of 5.85. It signals elevated volatility and a market still digesting the earnings release.
EMA Structure Confirms a Structural Downtrend
The EMA structure on the daily is deeply unfavorable. EMA20 sits at $103.55 and EMA50 at $103.56 — nearly converged, yet both well above current price. More critically, EMA200 stands at $124.88. That places NOW roughly 30% below its own long-term moving average. This is not a minor pullback within an uptrend. It reflects a stock in a genuine structural downtrend.
Momentum Indicators Signal Deteriorating Conditions
Meanwhile, daily RSI14 has slipped to 39.49 — approaching oversold territory but not yet there. The MACD reinforces the weakness: the line is at -0.37, the signal at +0.49, and the histogram at -0.86. Momentum is deteriorating. No crossover, no divergence, and no recovery signal appears on the daily timeframe.
In terms of range, Bollinger Bands frame the span between $92.11 on the lower band and $114.52 on the upper, with a midpoint at $103.32. Price is trading well below the midpoint, hugging the lower portion of the channel. Notably, the pivot point sits at $97.07, with R1 at $99.40 and S1 at $93.13. A close below S1 would extend the bearish structure meaningfully.
Hourly Timeframe: Does the 1H Chart Confirm the Downside?
It does. The hourly chart amplifies the bearish thesis rather than weakening it. At 15:30 on July 22, NOW closed at $95.46. All three EMAs were stacked in bearish alignment: EMA20 at $99.62, EMA50 at $102.35, and EMA200 at $103.99. Price trades below all of them, with no sign of recapture.
Oversold RSI — A Warning, Not an Opportunity
Notably, the hourly RSI14 has collapsed to 26.59 — firmly in oversold territory. On its own, that reading might invite a contrarian bounce thesis. However, oversold conditions in a confirmed downtrend are a warning, not an opportunity. Oversold can remain oversold for extended periods when selling pressure is structural rather than reactive.
MACD and Bollinger Bands Deepen the Concern
In parallel, the hourly MACD deepens the bearish picture. The line is at -2.30, the signal at -1.70, and the histogram at -0.60 — still negative and widening on the downside. At the same time, Bollinger Bands show price hovering above the lower band of $93.78. The midpoint at $100.77 acts as significant overhead resistance. The hourly pivot cluster — PP at $95.55, R1 at $95.83, S1 at $95.18 — is extremely compressed, indicating the stock is coiling tightly around a narrow range.
15-Minute View: Is There Any Sign of Short-Term Relief?
A modest flicker of relief appears on the 15-minute chart, where the MACD histogram turned slightly positive at +0.20. However, this is compression of downside momentum — not a reversal signal. At 15:45, price closed at $95.46. The MACD line is at -1.03 and the signal at -1.24.
The 15m RSI at 32.46 is also close to oversold, consistent with the hourly picture. Bollinger Bands are narrow: upper at $97.42, lower at $94.67, with the midpoint at $96.05. Price is pinned in the lower half of this compressed band. The 15m ATR14 of just 0.51 signals that intraday volatility is winding down, at least momentarily. This could precede a short-term bounce or simply consolidation before the next directional move.
Bullish Case: Can Fundamentals Provide a Floor for ServiceNow, Inc. Stock?
For bulls, the argument rests on ServiceNow’s strong Q2 2026 performance. The company beat on both earnings and revenue, raised its outlook, and is clearly positioning itself as an infrastructure player in the enterprise AI space. The $40 million investment in Indian banking software specialist BusinessNext also underscores a deliberate push into financial services — a vertical with significant expansion potential globally.
Technically, a bullish recovery scenario would require NOW to reclaim the daily pivot at $97.07 and then push through R1 at $99.40. A sustained move back above the $100 level would begin to challenge the bearish EMA cluster around $103.50. The hourly RSI deep in oversold territory adds some statistical weight to a near-term mean reversion attempt. The 15m MACD histogram turning positive is a modest first signal in that direction.
Bearish Scenario: How Deep Is the Technical Damage for ServiceNow, Inc. Stock?
On the other hand, the bearish case remains dominant. Despite a strong earnings beat, price rejected intraday highs near $101 and closed near session lows. That price action — often called a sell-the-news reaction — suggests the market had already priced in optimism or that sellers are using the strength to distribute.
In summary, the daily regime classification is unambiguously bearish. All three EMAs on both the daily and hourly charts are positioned above price. A decisive break below daily S1 at $93.13 would intensify selling pressure. The lower Bollinger Band at $92.11 on the daily becomes the next technical magnet in that scenario. Below that, price would trade in uncharted territory relative to recent technical structure. Given EMA200 at $124.88, no meaningful long-term moving average support exists anywhere near current levels.
Positioning and Outlook: Where Does ServiceNow, Inc. Stock Go From Here?
Overall, NOW sits at a genuine inflection point. The fundamental story is intact — even improving. However, the technical picture reflects months of distributional selling that one strong earnings report has not yet reversed. The ATR14 on the daily at 5.85 means significant daily swings are the norm, not the exception. Traders approaching this name should expect volatility to remain elevated in both directions. The post-earnings move will likely define the next directional leg. Until price reclaims and holds above the pivot at $97.07 on a daily close basis, the bearish regime remains in force. Caution is warranted.
FAQ
Did ServiceNow beat earnings in Q2 2026?
Yes. ServiceNow delivered Q2 2026 earnings and revenue surprises of +4.65% and +1.65% respectively, alongside 24% revenue growth and an upgraded full-year outlook. CEO Bill McDermott also highlighted the company’s strategic positioning in autonomous AI during the earnings release.
What is the key support level for ServiceNow, Inc. stock?
The daily S1 pivot sits at $93.13. A decisive close below this level would extend the bearish structure. The lower daily Bollinger Band at $92.11 serves as the next technical magnet. Below that, no meaningful long-term moving average support exists near current levels.
Is NOW stock oversold right now?
The hourly RSI14 has collapsed to 26.59, firmly in oversold territory. However, in a confirmed downtrend, oversold conditions can persist for extended periods and are more of a warning than an opportunity. Daily RSI14 at 39.49 has not yet reached oversold levels.
What would signal a bullish reversal for ServiceNow, Inc. stock?
A bullish recovery would require NOW to reclaim the daily pivot at $97.07, push through R1 at $99.40, and eventually challenge the bearish EMA cluster around $103.50. A sustained move back above $100 would be the first meaningful step toward challenging the bearish regime.
Disclaimer: This article is for informational purposes only and does not constitute financial advice, an investment recommendation, or a solicitation to buy or sell any financial instrument or cryptocurrency. The analysis provided is not indicative of future results. Investing in crypto assets and financial markets carries a high risk of capital loss. Always do your own research (DYOR) and consult a qualified financial advisor before making any decision.
Article produced with the assistance of artificial intelligence and reviewed by the editorial team.






 English (US) ·