
 3 months ago
37
3 months ago
37
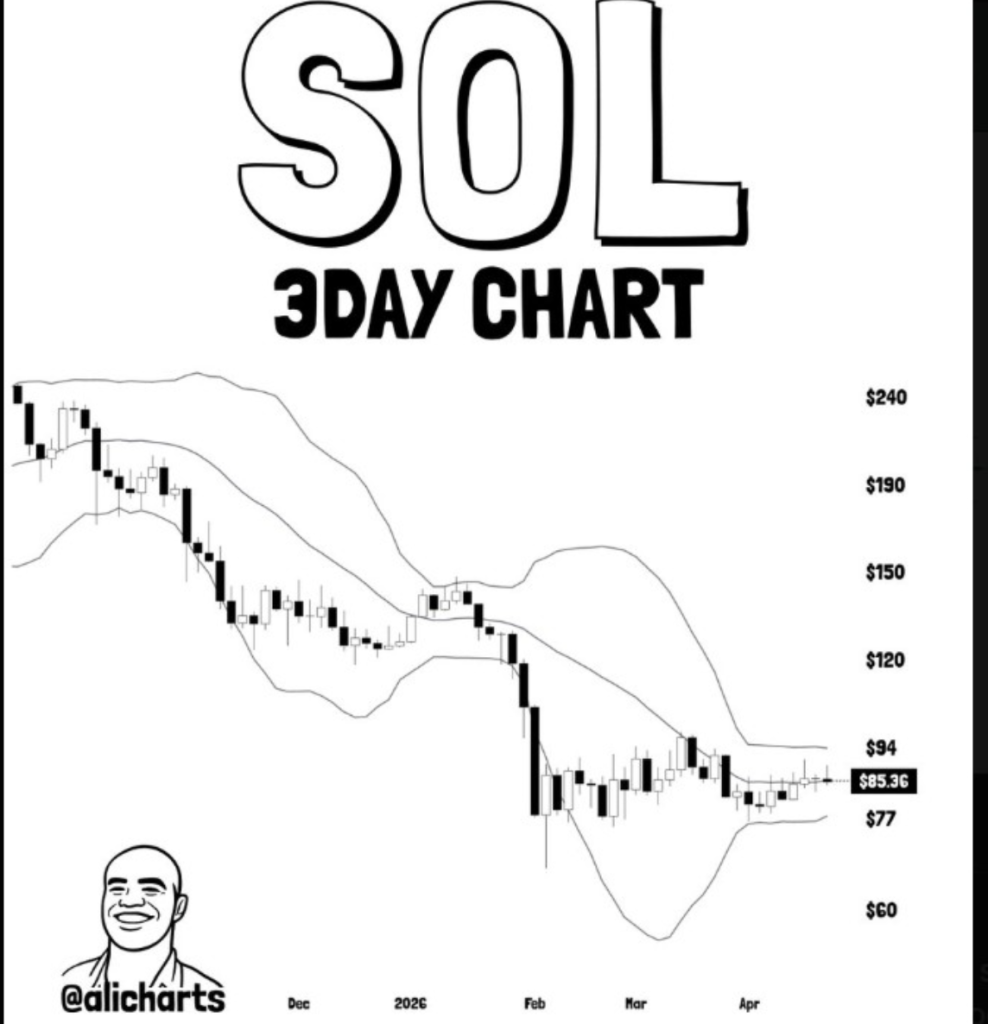
- Solana trades inside a tight $77–$94 range with low volatility
- Bollinger Band compression signals a potential breakout ahead
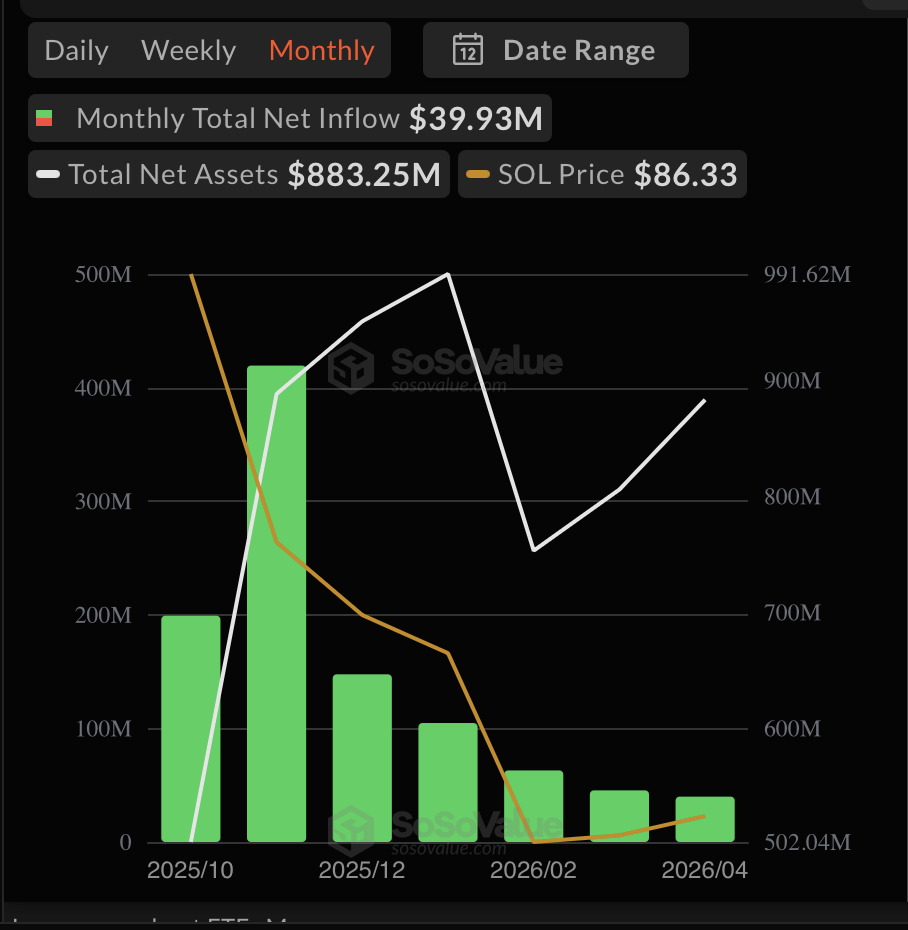
- Institutional inflows rise, but price still needs confirmation above $94
Solana is hovering around the $86 level right now, and honestly, it feels like the market is just… waiting. Price hasn’t done much lately, stuck inside a compressed range that traders are watching pretty closely. On the 3-day chart, analyst Ali Martinez pointed out that SOL is moving between $77 and $94 inside a tightening Bollinger Band, and setups like this don’t usually stay quiet forever.
When bands squeeze like that, volatility tends to follow, sooner or later. The key trigger, according to Martinez, is a clean 3-day close outside that range. Until then, it’s more noise than signal.
Price Drifts After Failed Push Toward $90
Earlier in the week, SOL tried to break higher, pushing toward $90, but couldn’t hold it. Since then, price has slipped back into sideways movement, trading near $86 with only small daily changes. On a weekly basis, it’s actually down close to 3%, which shows that momentum isn’t exactly strong right now.
Looking at the chart, SOL is sitting right in the middle of that $77 to $94 range. It’s not testing support, not really pushing resistance either, just hovering. The Bollinger Bands have tightened noticeably, and that kind of compression usually means energy is building, even if it doesn’t feel like it yet.
A “No-Trade Zone” for Now
Martinez described this range as a “no-trade zone,” which makes sense if you think about it. Chasing moves inside tight ranges can get messy, price tends to whip back and forth without much follow-through. That’s exactly the kind of environment where traders get caught off guard.
Support sits near $77, which has held so far, while $94 continues to act as the upper ceiling. Price has stabilized since March, but it hasn’t shown enough strength to break higher. The latest candles are narrow, almost hesitant, which usually means the market is waiting for something, maybe volume, maybe sentiment, it’s not clear yet.
Breakout Above $94 Could Shift Momentum
The main focus now is pretty simple, can SOL break above $94 with conviction? If it does, and volume actually shows up, then $100 becomes the next logical target. That level carries psychological weight too, so it would likely attract more attention, maybe even more momentum.
But volume has been fading, down more than 20% recently, which isn’t ideal for a breakout. Low activity is normal during consolidation, but for a move to stick, participation needs to increase. Until that happens, the range probably holds.
Institutional Flows Add Another Layer
There’s also a fundamental angle here that’s hard to ignore. Solana spot ETFs have seen five straight days of inflows, totaling around $1.45 billion, which is… significant. On top of that, Goldman Sachs disclosed a $108 million position in SOL, adding to the growing institutional interest.
Still, even with those inflows, price hasn’t broken out yet. That’s the tricky part. Liquidity is building, interest is there, but the chart still needs confirmation. For now, SOL remains trapped between $77 and $94, and until one of those levels gives way, the market stays in this waiting phase.
Disclaimer: BlockNews provides independent reporting on crypto, blockchain, and digital finance. All content is for informational purposes only and does not constitute financial advice. Readers should do their own research before making investment decisions. Some articles may use AI tools to assist in drafting, but every piece is reviewed and edited by our editorial team of experienced crypto writers and analysts before publication.


 English (US) ·