
 3 weeks ago
27
3 weeks ago
27
- Solana is trading near $86 while facing strong resistance between $88 and $91
- RSI and MACD indicators show neutral momentum as price consolidates
- Solana futures volume reached $13.2B with rising open interest suggesting traders are positioning
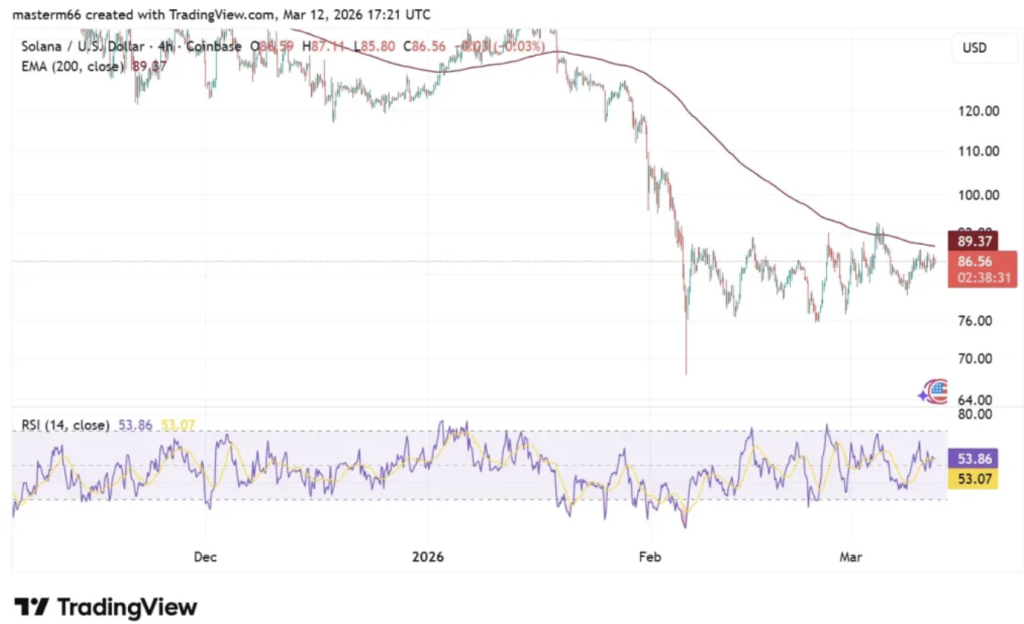
Solana is hovering just below an important resistance level, and traders are watching closely to see what happens next. According to TradingView data, SOL was trading near $86.71 on March 12, slipping about 0.55% over the past 24 hours. It’s not a dramatic move, but the positioning is interesting.
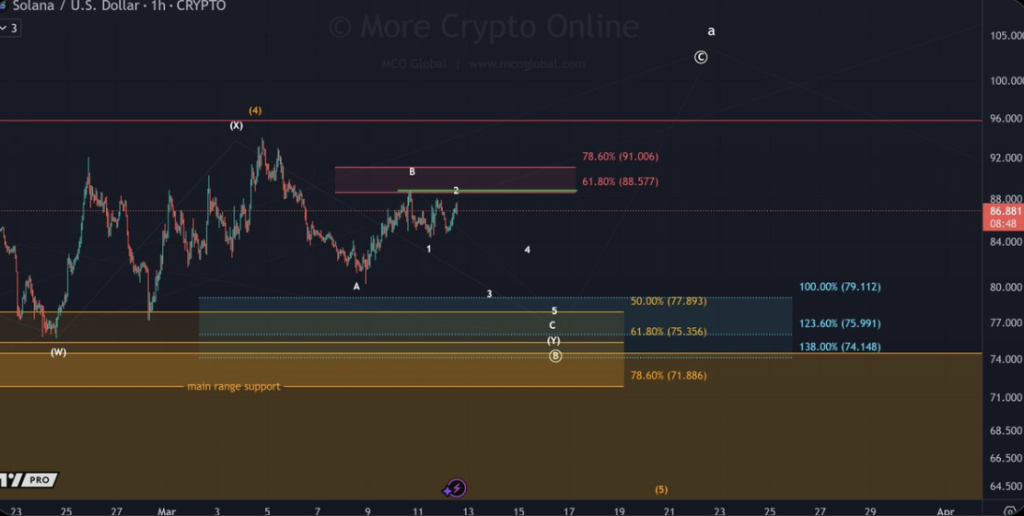
Crypto analyst More Crypto Online pointed out in a chart posted on X that Solana needs to break through the $88–$91 resistance zone to really trigger a convincing bullish breakout. Until that happens, the price may keep drifting sideways. Markets do this sometimes… they pause before deciding where to go next.
Resistance Continues to Cap Solana’s Price
Right now, Solana appears trapped inside a fairly tight range between support and resistance levels. That range formed after the token experienced a sharp decline earlier this year, leaving the market a bit cautious.
According to the analyst’s chart, a drop below the $84 support level could confirm the beginning of what’s known in Elliott Wave theory as a “Wave 3” move to the downside. Wave 3 phases are typically the most aggressive part of a decline — the point where bearish momentum really accelerates.
Interestingly, the analyst also suggested that Solana’s recent upward movement may simply be part of a temporary B-wave bounce. In simple terms, that would mean the rally is only a short-lived recovery within a broader downtrend.
Over the past week alone, TradingView data shows SOL has slipped roughly 5.7%, reinforcing the idea that the market is still struggling to regain strong momentum.
Technical Indicators Show a Neutral Market
For now, technical indicators suggest the market is stuck in a wait-and-see phase. Solana’s Relative Strength Index (RSI) currently sits around 53, which is almost right in the middle of the scale.
That kind of reading usually signals balance between buyers and sellers. Neither side has taken clear control yet.
SOL is also trading below its 200-day exponential moving average, a level many analysts view as a long-term trend indicator. Being below it often suggests the broader trend is still leaning bearish, even if short-term rallies appear along the way.
Meanwhile, the MACD indicator and its histogram remain fairly neutral. There are small signs of bullish convergence, but nothing strong enough yet to suggest a major momentum shift.
In other words, the market hasn’t made up its mind.
Derivatives Traders Are Still Getting Involved
Even while price action stays quiet, derivatives markets show that traders are still actively positioning themselves. According to CoinGlass data, Solana futures trading volume reached about $13.2 billion over the past 24 hours.
Open interest has also increased slightly — rising about 1.99%, or roughly $100 million, bringing total open interest to around $5.17 billion.
That detail matters. When open interest grows during sideways price action, it often means traders are building new positions ahead of a potential breakout… or breakdown.
For now, Solana sits at a critical point. A push above the $88–$91 resistance zone could invite fresh bullish momentum. But if support near $84 gives way instead, the market might be preparing for another leg lower.
Either way, the calm probably won’t last forever.
Disclaimer: BlockNews provides independent reporting on crypto, blockchain, and digital finance. All content is for informational purposes only and does not constitute financial advice. Readers should do their own research before making investment decisions. Some articles may use AI tools to assist in drafting, but every piece is reviewed and edited by our editorial team of experienced crypto writers and analysts before publication.


 English (US) ·