
 1 month ago
53
1 month ago
53
As of June 18, 2026, Solana’s price today stands at $71.68, stuck at a quotation that says little but suggests a lot. It’s neither a crash nor a rebound: it’s the gray area where the market waits. The point is to understand which side it will break.
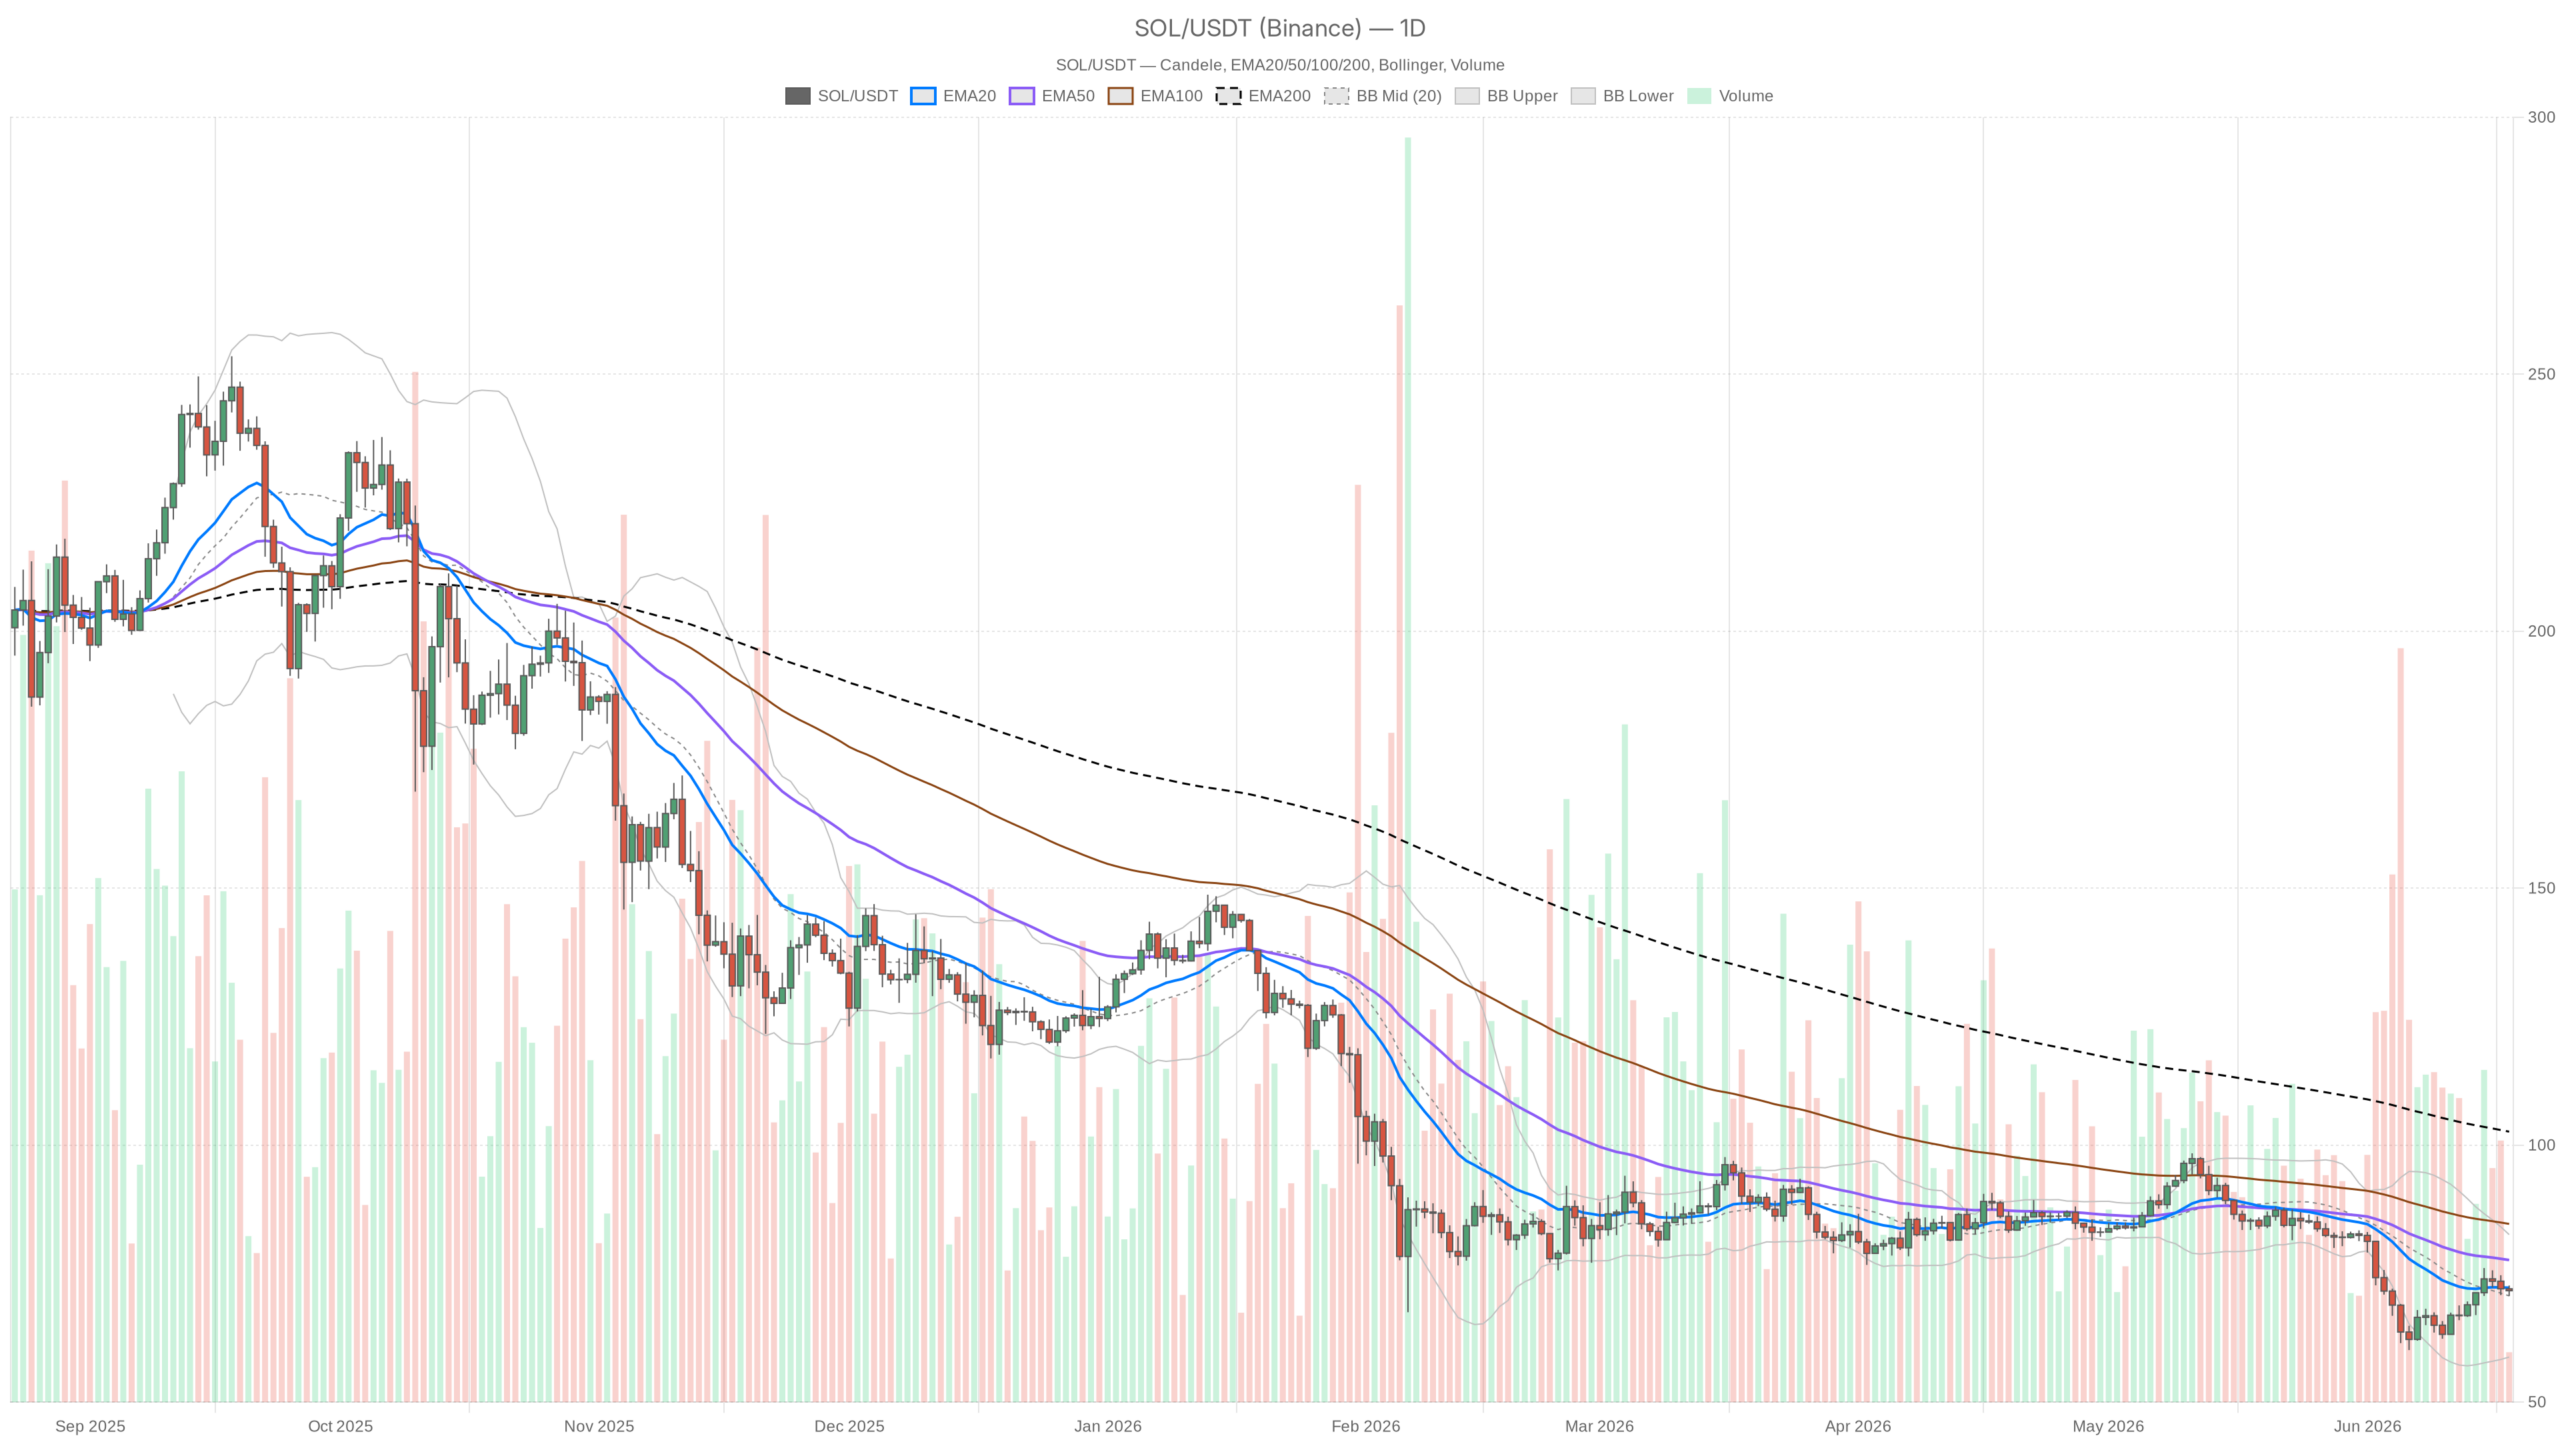 SOL/USDT — daily chart with candles, EMA20/EMA50 and volumes.
Key points
- SOL is trading at $71.68, below all 20, 50 and 200-period EMAs on the daily.
- The daily MACD histogram is positive at +1.19, a sign of easing bearish pressure.
- The Fear & Greed Index is at 15, deep in the “Extreme Fear” zone.
- Immediate resistance at $72.26 (EMA20); key support at $70.47 (Bollinger H1).
- DeFi activity on the ecosystem remains lively despite price compression.
The underlying structure is not neutral
On the daily, the picture is unequivocal: Solana is in a bearish regime. The price is steadily below the 20, 50 and 200-period moving averages — respectively at $72.26, $77.65 and $102.63. Three levels of dynamic resistance stacked overhead, each heavier than the last. The EMA200 at $102.63 is a distant memory; even the EMA50 looks like an unreachable ceiling in the short term.
The price has been moving below the daily EMA20 long enough that any short-term technical recovery becomes a signal to treat with caution. It’s not panic, but it’s not a structure from which you build relaxed longs either.
Momentum and volatility: conflicting signals
The daily RSI is at 45.52, below parity and in weak territory, but far from the oversold zones that sometimes trigger mechanical rebounds. There is no visible bullish divergence nor exhaustion of selling. It’s a tired market that can’t find convinced buyers at these levels.
The daily MACD tells a more interesting story: the line is negative at -2.63, the signal at -3.82, but the histogram is positive at +1.19. Bearish pressure is easing, not reversing. It’s the kind of signal that can precede stabilization, but on its own it’s not enough to justify a change in scenario.
The Bollinger Bands on the daily show an upper band at $82.60 and a lower one at $58.77, with the middle band at $70.68. The price is squeezed into the lower half of the band, near the middle but tilted downward. The ATR at $4.14 indicates daily volatility that is present but not extreme: there is movement, but a clear direction is missing.
Hourly timeframe: weakness without acceleration
On H1, the regime is classified as neutral, but the details are more nuanced. The price at $71.64 is below the EMA20 ($72.09) and EMA50 ($72.50), while holding above the hourly EMA200 at $70.12, the only visible short-term dynamic support. The RSI at 43.63 confirms weakness without screaming collapse. The hourly MACD is just in negative territory with a histogram at -0.03: a hair below zero, practically flat.
In this context, the Bollinger range on H1 between $70.47 and $74.02 defines the current operating cage. A decisive break above $74 would mean something. Dropping below $70.47 would open a different discussion.
On the 15-minute chart: the only positive glimmer
The 15-minute timeframe is the most optimistic of the three, and only slightly. The RSI is at 51.58, just above neutrality. The MACD shows a positive histogram at +0.10, with the line regaining ground against the signal. The price is above the short EMA20 ($71.53) but still below the EMA50 ($71.84) and EMA200 ($72.65) on the quarter-hour.
This is an attempt at micro-structural recovery, not a reversal. Intraday traders may find an entry point here, but they must be aware they are trading against the flow of the higher timeframes.
Key levels to monitor
The daily pivot point is practically in line with the current price ($71.67), with R1 at $72.69 and S1 at $70.65. These levels are close together, reflecting a compressed session without sharp moves. On the hourly side, R1 at $71.75 and S1 at $71.58 confirm the compression: SOL is moving in a very tight corridor. Any breakout, in either direction, deserves attention precisely because compressed energy tends to be released abruptly.
Macro context and on-chain data
According to CoinGecko data, total crypto market capitalization has fallen by 0.70% over the last 24 hours, with Bitcoin holding 56.17% dominance. This signals that capital continues to prefer the safest asset in the ecosystem. Solana represents about 1.81% of total market cap, in line with a phase in which appetite for altcoins is limited.
The Fear & Greed Index is at 15, classified as “Extreme Fear.” This is not a data point to ignore: markets with this level of widespread fear rarely produce sustained short-term rallies, but they are also the ones that sometimes generate violent technical rebounds when sentiment hits bottom. The problem is that 15 does not necessarily mean we are at the bottom.
On the DeFi front, DefiLlama data show mixed signals for the Solana ecosystem: Orca DEX and Meteora DLMM are recording significant growth in both weekly (+15.55% and +13.75%) and monthly fees (+64.75% and +63.66%), suggesting that on-chain activity is not dead. Raydium AMM is holding around its average annual volumes. This contrast between still-present DeFi activity and compressed price may indicate that capitulation is not yet complete, but it may also reflect a loyal user base that operates independently of SOL’s quotation.
Bullish scenario: conditions and invalidation
For Solana to build a credible recovery, the first obstacle to overcome is the daily EMA20 at $72.26, followed by the psychological and technical resistance around $74–$75. A sustained recovery above these areas, accompanied by an RSI moving back above 50 on the daily and a MACD that consolidates a positive histogram, would change the tone of the analysis. The next target would be the $77–$78 area, where the daily EMA50 passes.
This scenario is invalidated if the price falls back sharply below $70, breaking the daily S1 support and approaching the $68–$69 area.
Bearish scenario: conditions and invalidation
The current structure still favors continuation of the downtrend. If the price fails to break above $72.26–$72.50 in the coming sessions and the hourly RSI starts falling again, the concrete risk is a slide toward $70 and potentially $68. A decisive break of the lower hourly Bollinger band ($70.47) with rising volumes would accelerate the drop. In that case, the next significant reference lies around $65–$66, with the lower daily band at $58.77 as the extreme level.
This scenario is invalidated by a convincing daily close above $74, with the structure of the lower timeframes aligning in a bullish direction.
How to read this moment
SOL is in a technical limbo with a bearish slope on the daily that leaves little doubt about the underlying direction. The slight improvement in the MACD histogram and the attempted recovery on the 15-minute chart are signals to watch, not to buy blindly. The market right now rewards patience: anyone going long without clear confirmation on the higher timeframes risks catching a bounce in a downtrend — one of the most dangerous trades there is.
The real false signal to avoid is interpreting the current compression as accumulation. It may be, but without a confirmed structural breakout it is just a market that has not yet decided. In these sentiment conditions — with extreme fear dominating — when the decision comes it is often more abrupt than expected, in either direction.
FAQ
What is Solana’s price today?
As of June 18, 2026, Solana is trading at $71.68, in a full technical compression zone between nearby support and resistance.
Is Solana in an uptrend or downtrend?
The daily structure is unequivocally bearish, with the price below all major moving averages (EMA 20, 50 and 200).
What are the key levels to monitor?
Immediate resistance at $72.26 (daily EMA20) and then $74–$75. Support at $70.47 (Bollinger H1) and $68 as the next reference.
What does the Fear & Greed Index indicate in this context?
The index is at 15 (Extreme Fear), signaling a strongly negative market sentiment that historically can precede both capitulations and sudden rebounds.
{“@context”:”https://schema.org”,”@type”:”FAQPage”,”mainEntity”:[{“@type”:”Question”,”name”:”What is Solana’s price today?”,”acceptedAnswer”:{“@type”:”Answer”,”text”:”As of June 18, 2026, Solana is trading at $71.68, in a full technical compression zone between nearby support and resistance.”}},{“@type”:”Question”,”name”:”Is Solana in an uptrend or downtrend?”,”acceptedAnswer”:{“@type”:”Answer”,”text”:”The daily structure is unequivocally bearish, with the price below all major moving averages (EMA 20, 50 and 200).”}},{“@type”:”Question”,”name”:”What are the key levels to monitor?”,”acceptedAnswer”:{“@type”:”Answer”,”text”:”Immediate resistance at $72.26 (daily EMA20) and then $74–$75. Support at $70.47 (Bollinger H1) and $68 as the next reference.”}},{“@type”:”Question”,”name”:”What does the Fear & Greed Index indicate in this context?”,”acceptedAnswer”:{“@type”:”Answer”,”text”:”The index is at 15 (Extreme Fear), signaling a strongly negative market sentiment that historically can precede both capitulations and sudden rebounds.”}}]}
Disclaimer: This article is for informational purposes only and does not constitute financial advice, investment recommendation or a solicitation to buy or sell financial instruments or cryptocurrencies. The analyses do not guarantee future results. Investments in crypto-assets and financial markets involve a high risk of capital loss. Always do your own research (DYOR) and consult a qualified financial advisor before making any decision.
Content created with the assistance of artificial intelligence and human editorial review.


 English (US) ·