Solana’s social metrics reveal a troubling trend after the altcoin failed to sustain its 40% price increase. On November 5, SOL traded at $161.93, and 17 days later, it reached a new all-time high.
However, despite this rally sparking renewed enthusiasm among holders, the lack of continued momentum points to weakening bullish sentiment. With this decline, the question remains: what’s next for SOL’s price?
Solana Sentiment Turns Bearish
The impact of Solana’s falling bullish sentiment is evident in its market cap position. Two days ago, SOL was the fourth most valuable cryptocurrency in terms of market cap. However, it has since lost that spot to Ripple (XRP), a token that has been outperforming other assets in the top 100.
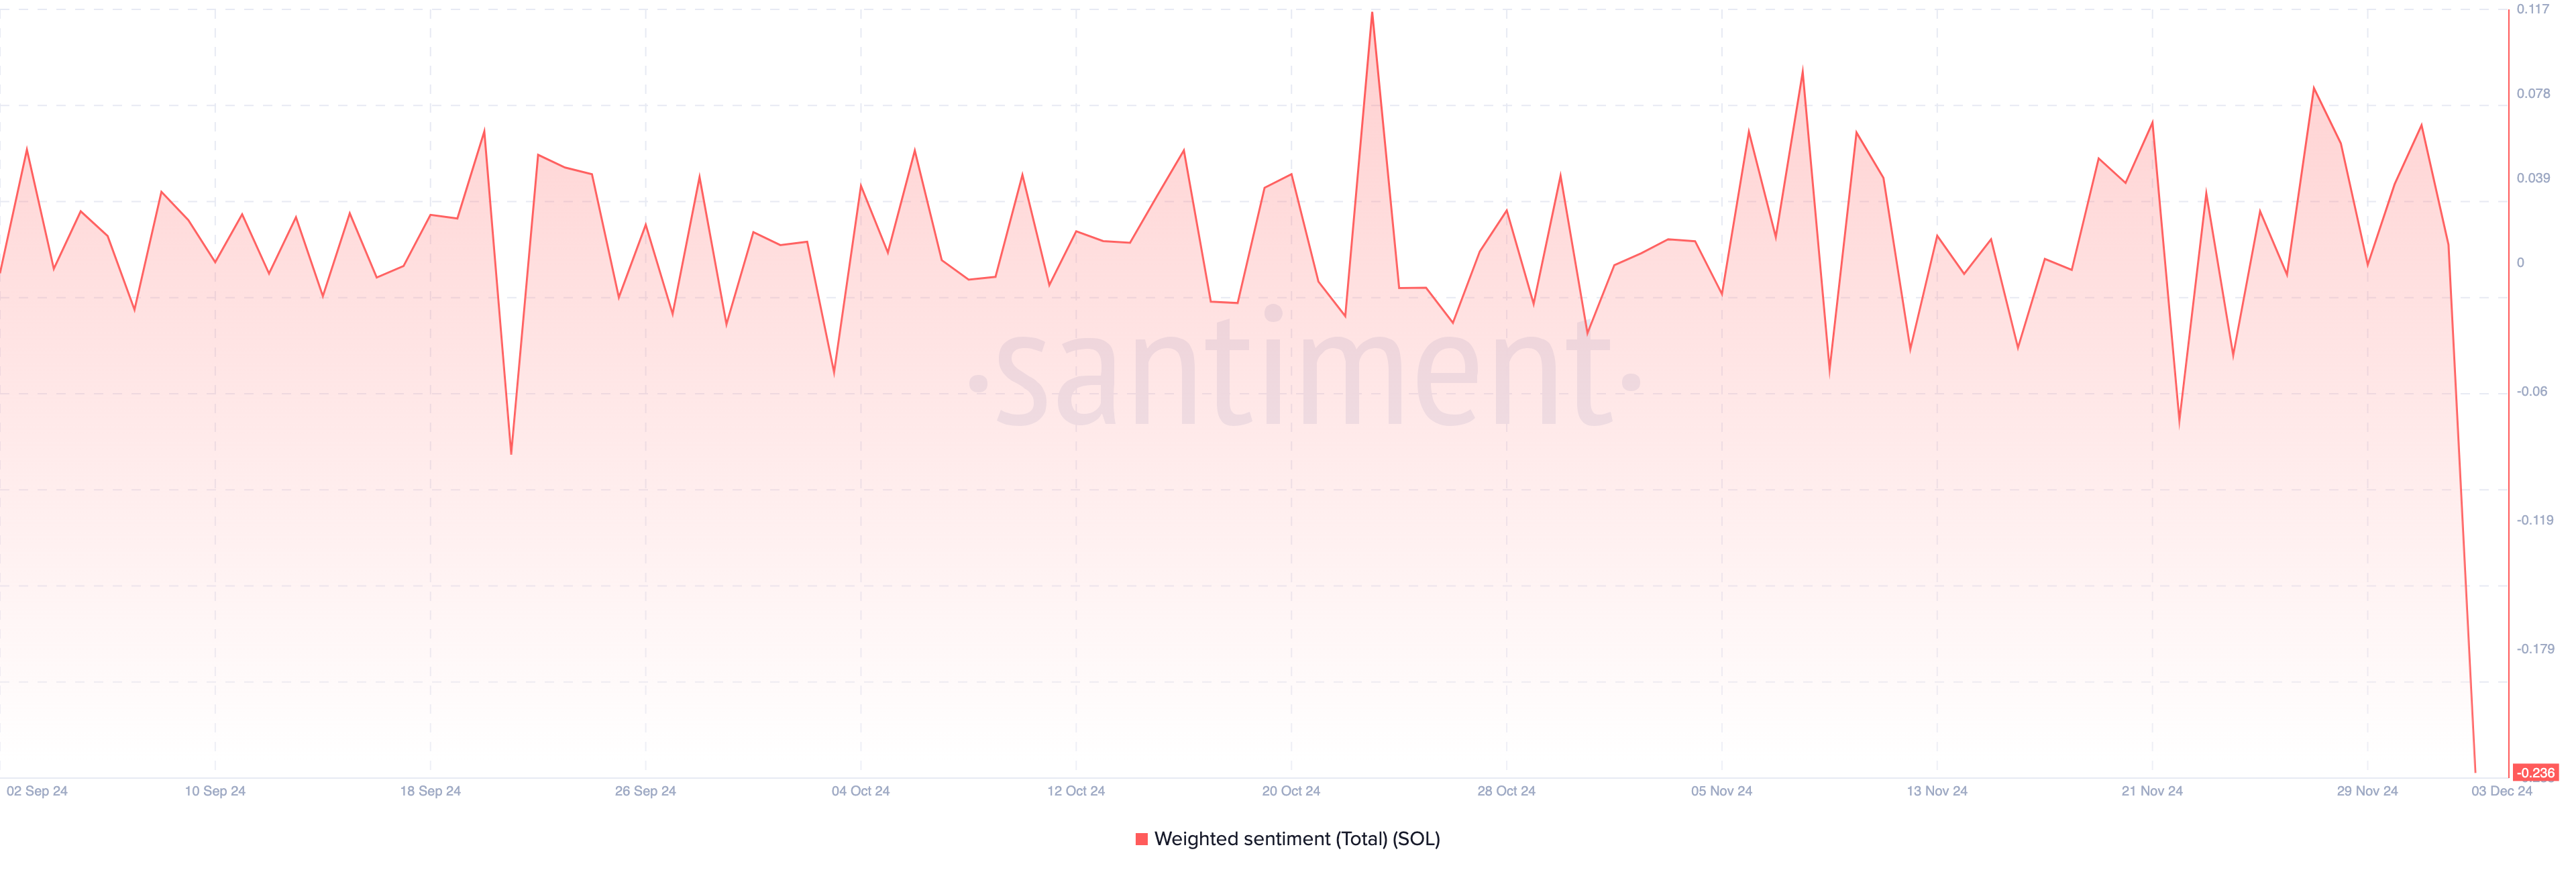
Following the development, Solana’s social metrics, including the weighted sentiment, declined. The Weighted Sentiment gauges the broader market’s perception of a cryptocurrency.
When it is positive, it implies that most remarks about the altcoin are bullish. On the other hand, if it is negative, it means that most comments regarding the cryptocurrency are bearish. According to Santiment, Solana’s weighted sentiment has plummeted to negative territory, suggesting that most market participants are not bullish on SOL’s short-term price action.
 Solana Weighted Sentiment. Source: Santiment
 If this trend continues within the next few days, demand for the cryptocurrency might continue to wane. Social dominance is another indicator that suggests that SOL’s price could face a further downturn.
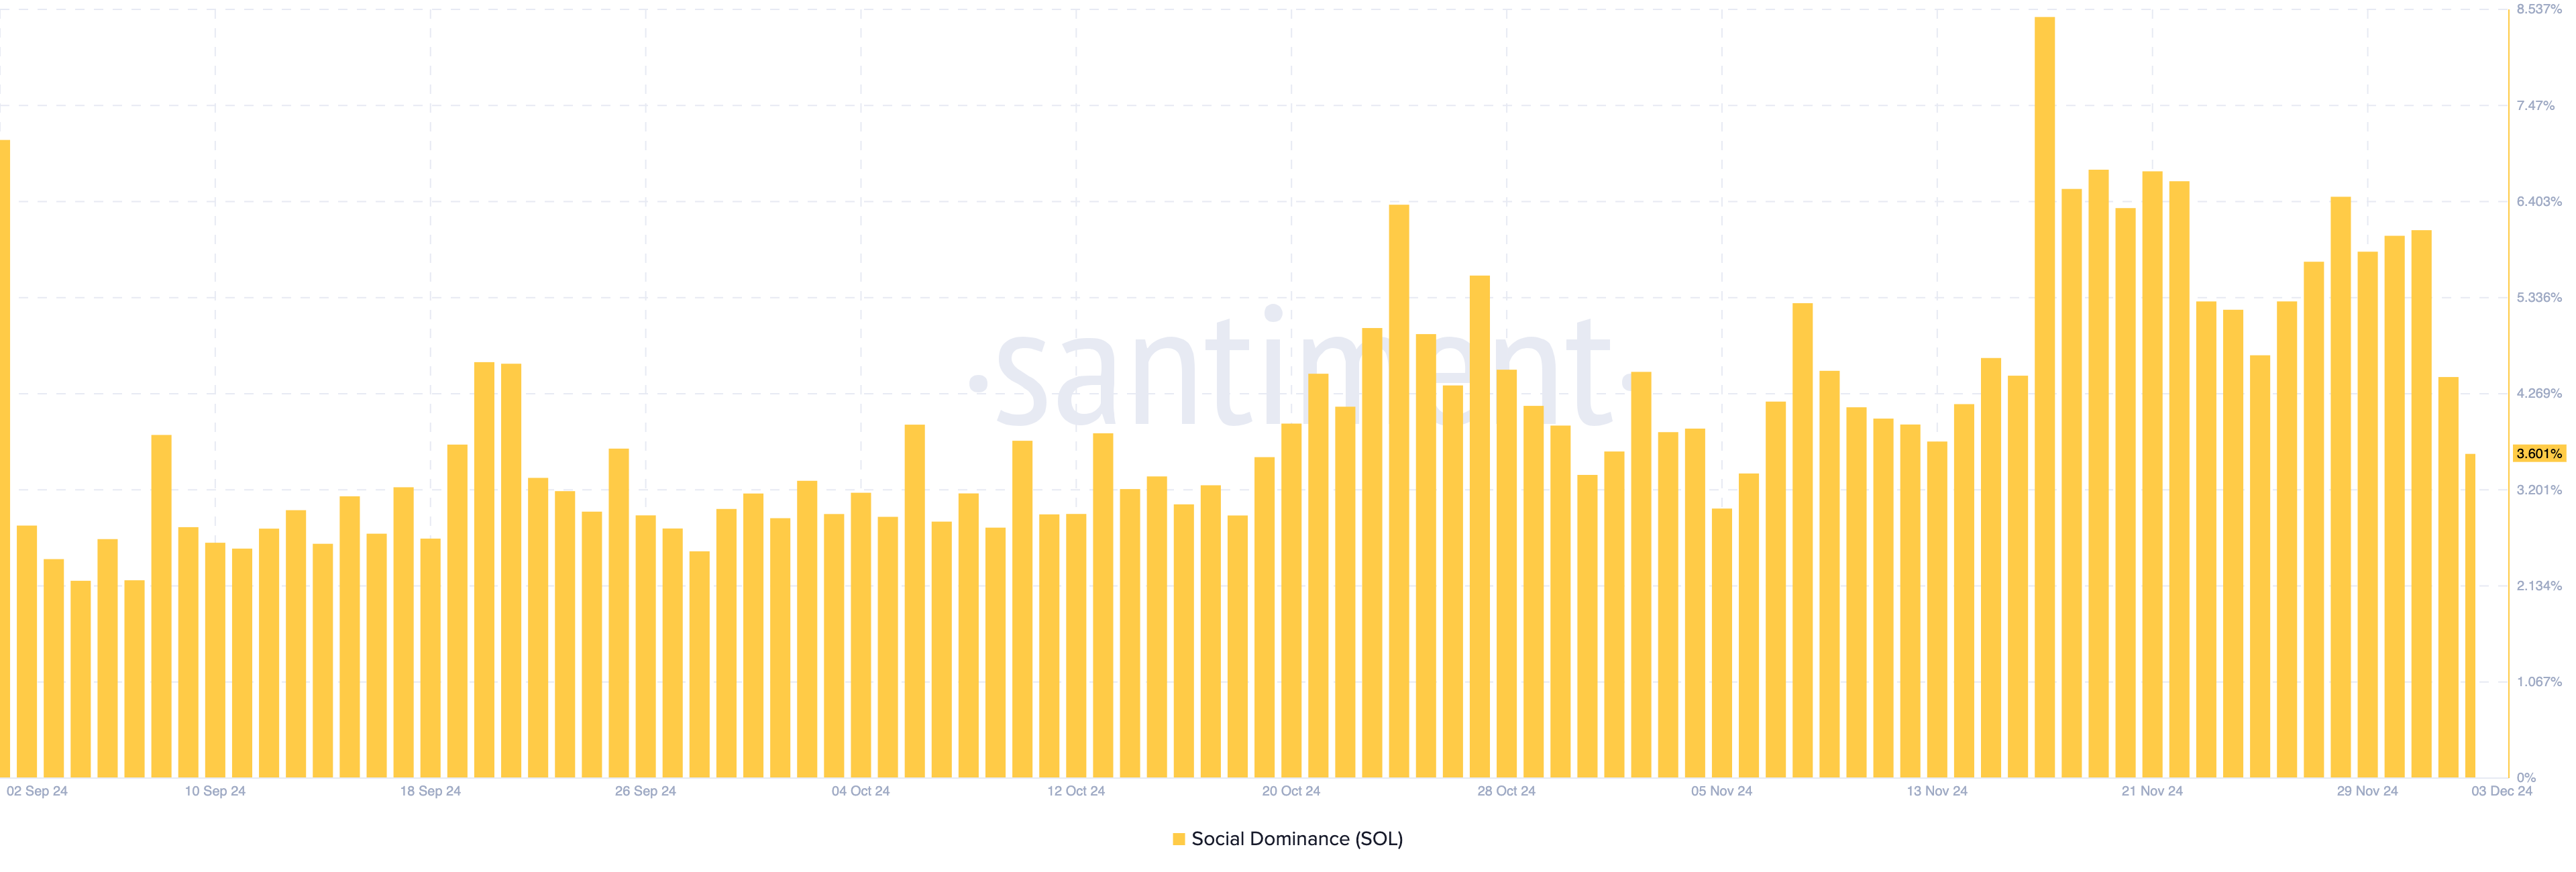
Social dominance measures the level of discussion around a cryptocurrency compared to other assets in the market. When the metric rises, it means the conversations about the asset in question have increased, which is usually bullish.
However, in SOL’s case, the metric has declined from 8.42% on November 17 to 3.60% today. Considering the decline in this reading, Solana’s price could find it challenging to rally back to its all-time high in the short term.
 Solana Social Dominance. Source: Santiment
 SOL Price Prediction: Not Yet Time to Bounce
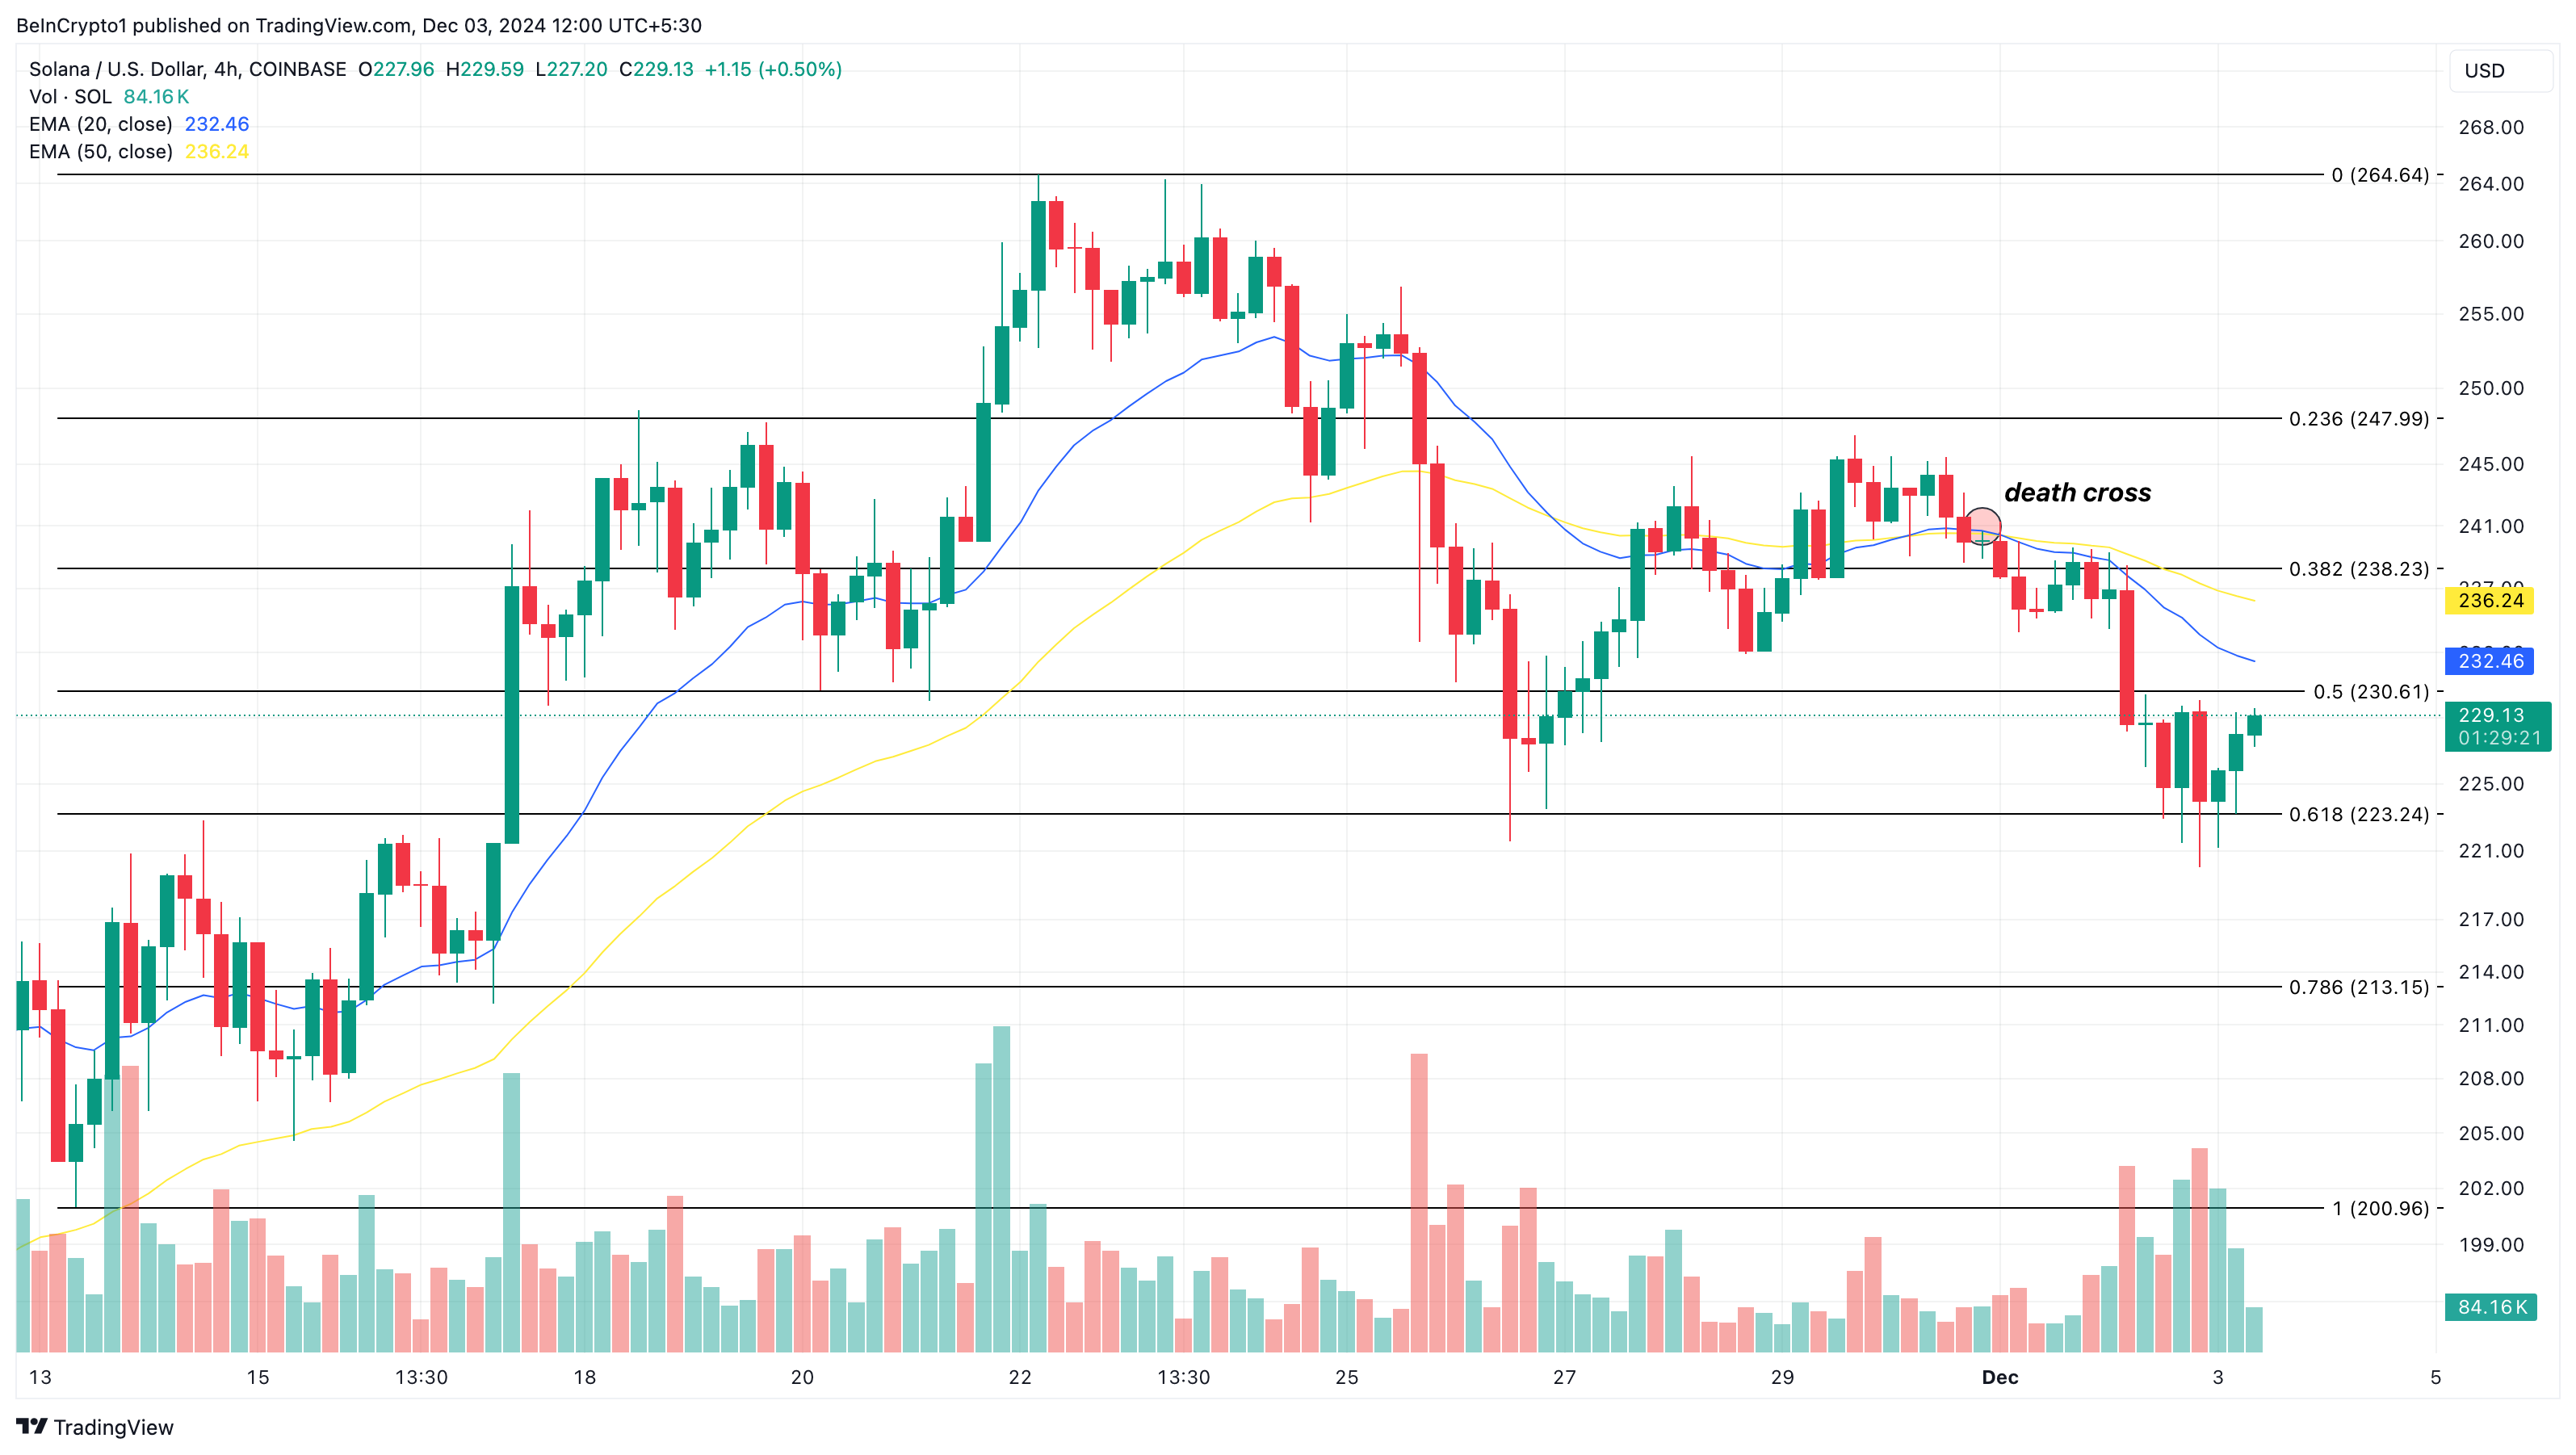
From a technical point of view, the 50-period Exponential Moving Average (EMA) on the 4-hour chart has crossed above the 20 EMA. For context, the EMA is a technical indicator that identifies bullish and bearish trends.
When the shorter EMA crosses above the longer one, the trend is bullish. But if it is the other way around, the trend is bearish. This crossover, termed a death cross, signifies a bearish trend.
Furthermore, SOL’s price trading below both key indicators supports this bearish outlook. This positioning suggests that the recent bounce may be a fakeout. If confirmed, Solana’s value could potentially decline further to $213.15.
 Solana 4-Hour Analysis. Source: TradingView
 On the other hand, if the Solana social metrics turn bullish, this trend might change. In that scenario, SOL might bounce with a likely target of $264.64.
The post Solana Social Metrics Highlight Waning Interest as SOL Fails to Sustain 40% Surge appeared first on BeInCrypto.

 3 weeks ago
20


 English (US) ·