
 1 month ago
68
1 month ago
68
Key Takeaways
- SOL maintains position around $76, defending critical support zone of $73–$77
- Breakthrough above $87 resistance could pave the way toward $100 price target
- Trader Michaël van de Poppe warns that failure to hold $73 may lead to retesting recent lows
- Technical analysis suggests potential accumulation area exists between $30–$52 if deeper pullback materializes
- Circle’s 250M USDC minting on Solana demonstrates ongoing network momentum
Solana currently trades around $76.33, maintaining its position above a crucial short-term support level ranging from $73 to $76. While the token posted a modest 24-hour increase of 0.41%, the overall directional trend remains ambiguous.
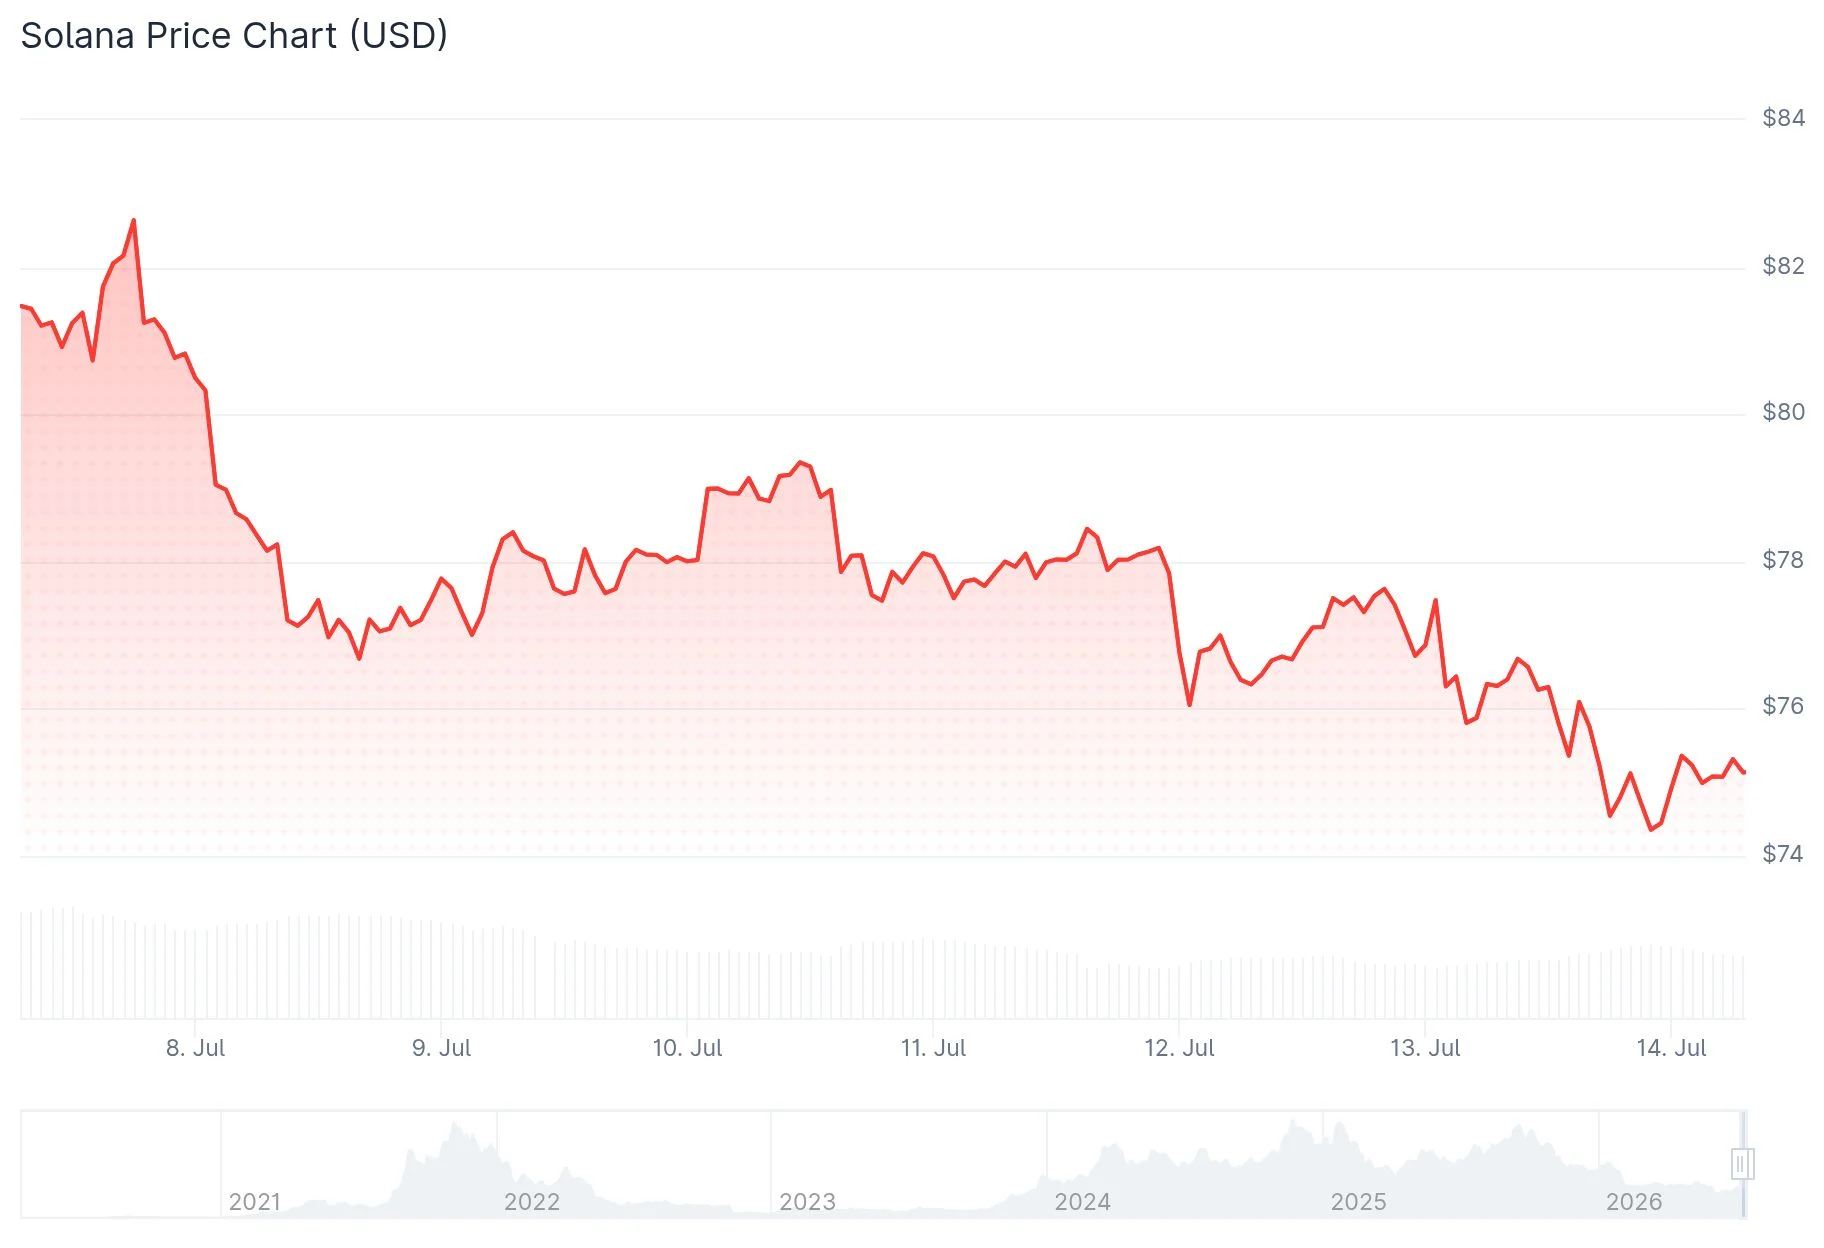 Solana (SOL) Price
The $73–$76 price band has emerged as the most critical zone for SOL traders. Bulls must successfully defend this region to preserve any prospect of upward momentum. A break beneath $73 would likely unleash additional downward pressure.
Regarding upside potential, bulls are initially targeting $80. Successfully breaching this threshold would bring $87.20 into view, representing a significant resistance level on the daily timeframe.
Potential Breakout Formation for SOL
Market participants are closely monitoring a long-term descending trendline that SOL is currently testing from below. Technical analyst Jesse Peralta’s charting indicates the price is challenging this resistance boundary, which has remained intact for several months.
A validated breakout above this trendline could catalyze a momentum shift favoring buyers. Should this scenario unfold, $90 followed by $100 emerge as subsequent key objectives.
Nevertheless, the breakout requires solid confirmation. A rejection at this juncture combined with a decline below $73 would probably reinitiate the bearish trajectory.
Trader Michaël van de Poppe offered his perspective on X, characterizing the present level as a “make or break” moment for SOL. He indicated that if this support holds firm, a rapid rebound becomes feasible and could trigger an upward expansion. Conversely, should SOL breach below $73, he anticipates a retest of recent bottom levels within the upcoming weeks.
Certain technical analyses indicate a Wyckoff accumulation pattern may be developing in SOL. Analyst Seth’s charting suggests SOL might have already navigated through an extended distribution phase and is presently establishing a foundation.
Extended Correction Remains on the Table
Analyst Crypto Patel published a three-week timeframe chart illustrating SOL’s decline from the $240 resistance region and its continued position below significant barriers at $95–$100 and $140.
Patel highlights a long-term accumulation territory spanning $30 to $52. Should Solana experience additional correction, this zone may present a favorable risk-reward entry point for position traders.
For any substantial recovery to materialize, SOL must first recapture the $95–$100 range. Sustaining levels above this area could generate momentum toward the $140 mark.
From a network development perspective, Circle executed a 250 million USDC mint on Solana, which Cointelegraph highlighted as evidence of sustained liquidity and transaction activity on the blockchain.
Certain traders are considering $150 as an extended-term objective, though reaching this level becomes realistic only after SOL successfully clears the $80, $90, and $100 resistance levels sequentially.
SOL presently maintains its position above an ascending support trendline on the daily chart, with additional cloud support reinforcing the $74 to $77 zone.
The post Solana (SOL) at Critical Juncture: Will $73 Support Hold or Break? appeared first on Blockonomi.


 English (US) ·