Solana (SOL) has erased its recent losses in a strong comeback rally that began three days ago. It initiated the uptrend on July 12, and its value has since risen by 13%.
Exchanging hands at $152, the fifth largest cryptocurrency by market capitalization currently trades at a price last observed on June 27 when asset manager VanEck made filings to sell shares in a Solana exchange-traded fund (ETF).
Solana Sees Spike in Buying Activity
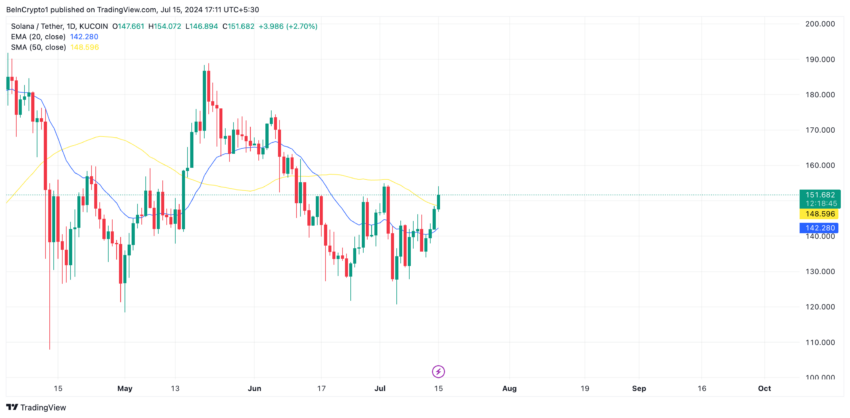
Solana’s three-day rally has pushed its value above a key moving average. The altcoin closed above its 50-day small moving average (SMA) yesterday. It had initially broken above the 20-day exponential moving average (EMA) on July 6.
 Solana Price Analysis. Source: TradingView
An asset’s 50-day SMA tracks its average closing price over the past 50 trading days. When an asset’s price rises above this key moving average, it often signals a shift in market sentiment from bearish to bullish. It indicates that price momentum is strengthening and confirms the possibility of a further price rally.
On the other hand, an asset’s 20-day EMA measures its average price over the past 20 days.
When an asset trades above its 50-day SMA and its 20-day EMA, its price has not only overcome the average price over the past 50 days but also surpassed the short-term average. This confirms that the buyers are in control and are pushing the asset’s price higher.
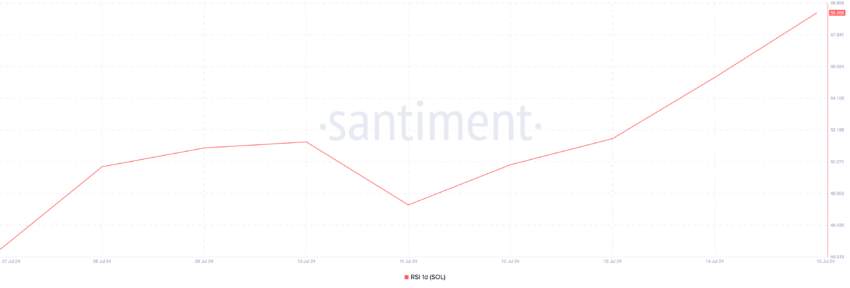
Further, as of this writing, the coin’s Relative Strength Index (RSI) is in an uptrend at 59.26. This confirms that buying activity is higher than selling pressure in the SOL market.
Read More: 6 Best Platforms To Buy Solana (SOL) in 2024
 Solana Relative Strength Index. Source: Santiment
An asset’s RSI measures its overbought and oversold market conditions. At 59.26, SOL’s RSI suggests that market participants favor buying more SOL coins over selling their current holdings.
SOL Price Prediction: The Bulls Have Control
In the last week, SOL’s price has climbed by 8%. This price hike may be attributable to the market optimism about a potential ETF launch for the altcoin.
Just seven days ago, the Chicago Board Options Exchange (CBOE) filed a request with the U.S. Securities and Exchange Commission (SEC) to allow it to list VanEck’s and 21Shares’ potential spot Solana ETFs.
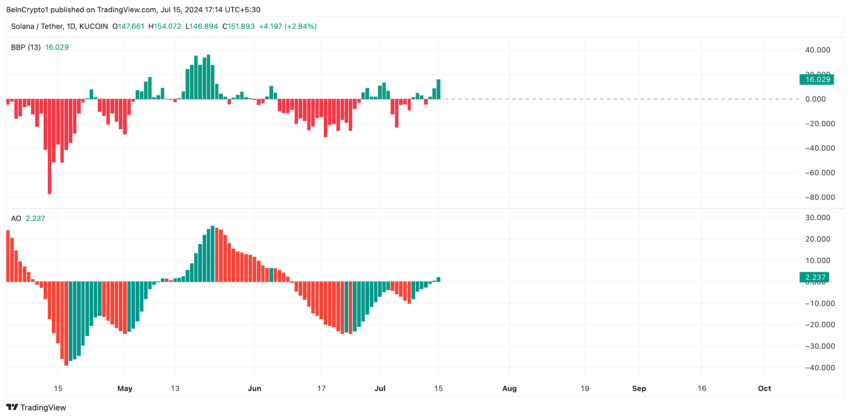
SOL’s Elder-Ray Index, assessed on a one-day chart, shows that the bulls have control of its market. As of this writing, the indicator’s value is above zero at 16.05.
This indicator measures the relationship between the strength of buyers and sellers in the market. When its value is positive, it means that bull power dominates the market.
Likewise, SOL’s Awesome Oscillator returns an upward-facing green bar as of this writing. This indicator measures an asset’s price momentum.
 Solana Price Analysis. Source: TradingView
When it displays green bars, it signals increasing bullish momentum. This means the short-term SMA is rising faster than the long-term SMA, suggesting that buying pressure is increasing.
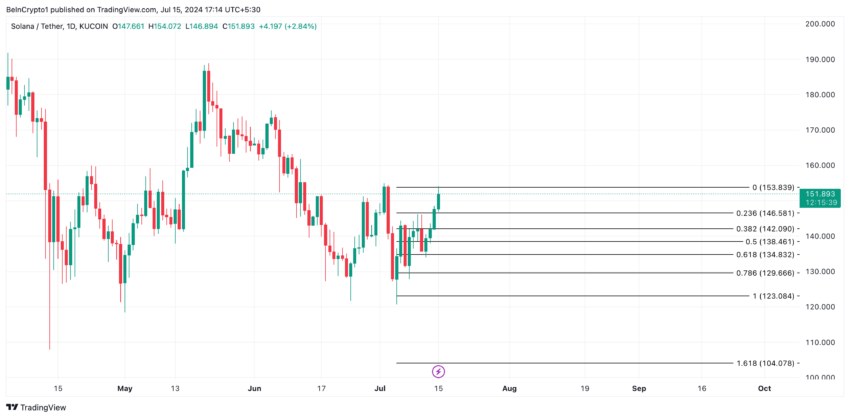
If SOL’s buying pressure persists, it may rally past $153.
Read More: Solana vs. Ethereum: An Ultimate Comparison
 Solana Price Analysis. Source: TradingView
However, if SOL reverses the current trend and begins to fall, it will trade at $146.
The post Solana (SOL) Eyes Rally After Crossing Key Moving Average appeared first on BeInCrypto.

 3 months ago
33





 English (US) ·