
 6 months ago
31
6 months ago
31
Solana (SOL) price is hovering near the $200 level, with its market cap attempting to reclaim the $100 billion mark and daily trading volume at $4 billion. Meanwhile, the number of Solana whales has been declining after reaching an all-time high of 5,167 on January 25, now sitting at 5,067.
This shift in whale activity, combined with weakening trend strength in the DMI and narrowing EMA lines, suggests that SOL is at a critical point, with both bullish and bearish scenarios still in play.
Solana Whales Are Going Down After Reaching An All-Time High
The number of Solana whales – addresses holding at least 10,000 SOL – peaked at an all-time high of 5,167 on January 25 before beginning a decline. While there was a brief recovery to 5,131 on February 4, the number has continued to decrease, now standing at 5,067.
Monitoring the activity of these large holders is crucial, as whales often play a key role in market trends. Their accumulation can signal confidence and a potential price surge, while a decline in whale addresses may indicate distribution, increasing the risk of selling pressure.
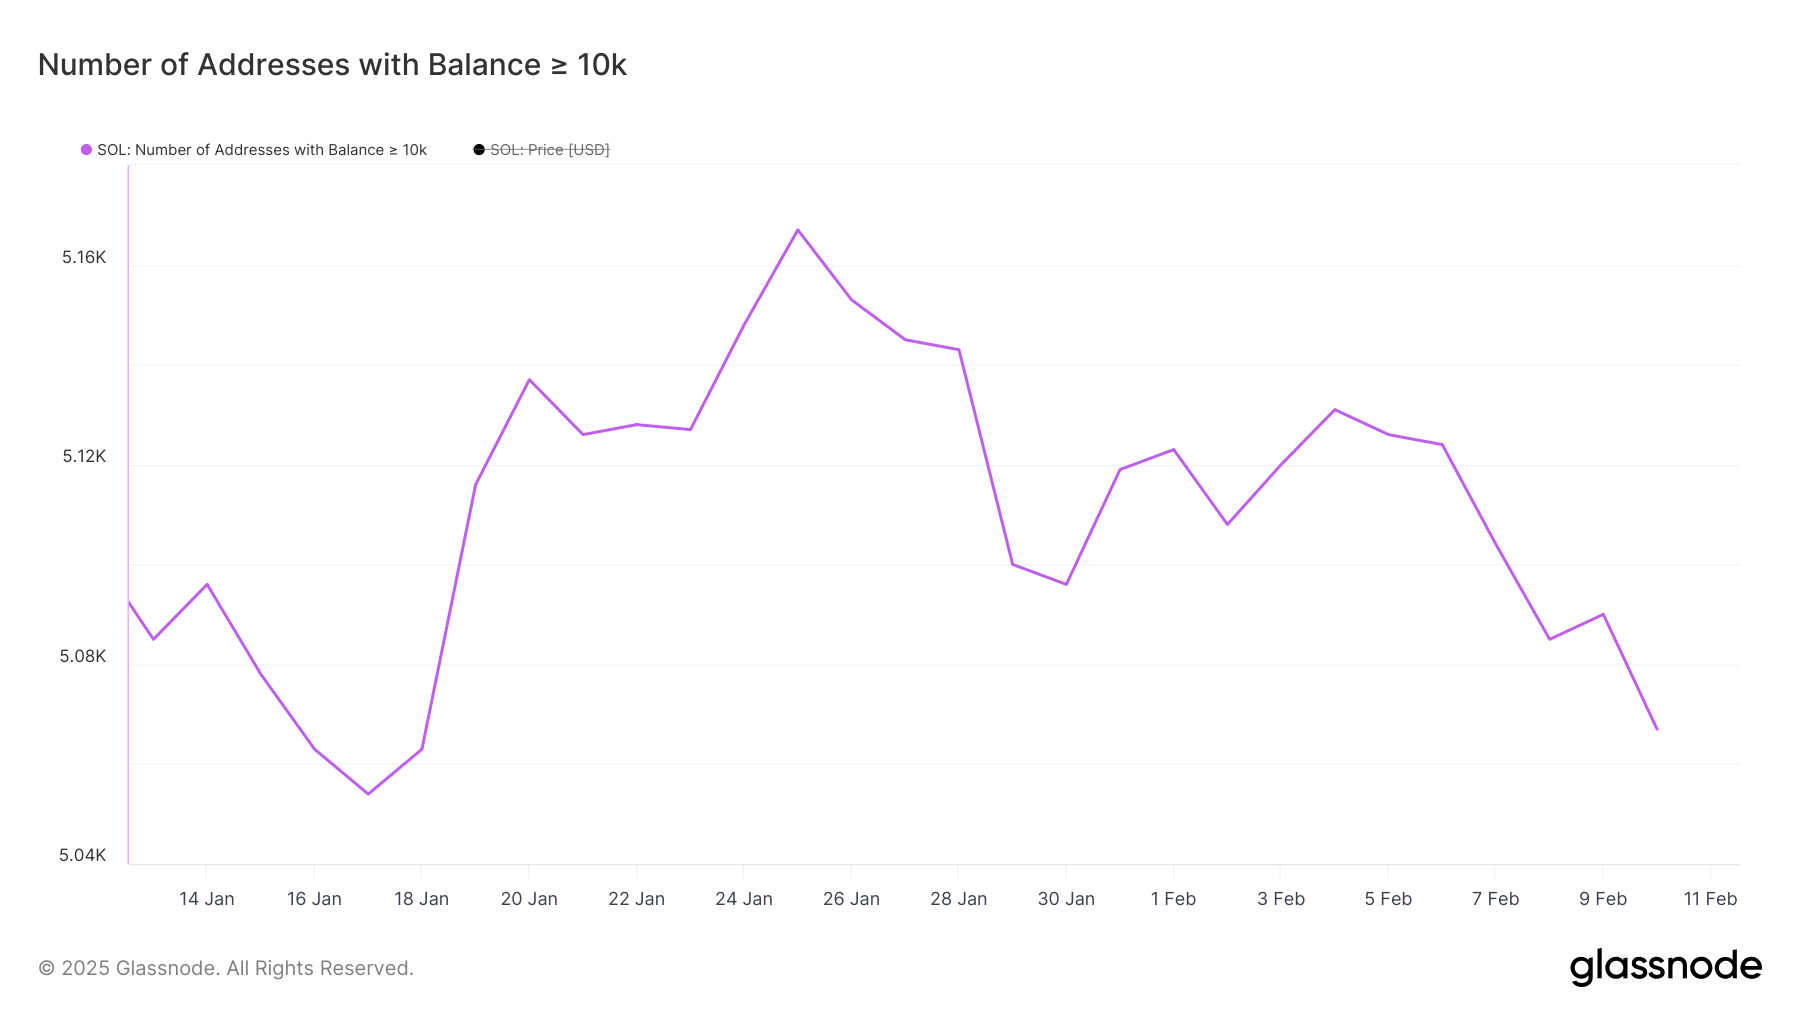 SOL Whale Addresses. Source: Glassnode.
Although the current whale count remains relatively high compared to historical levels, it is nearing its lowest point in the past month. This suggests that some large holders may be reducing their exposure, which could introduce volatility if the trend accelerates.
However, the overall number is still elevated, meaning there is a significant whale presence in the market. Whether this trend continues downward or stabilizes will be a key factor in determining Solana’s next major price move.
Solana DMI Shows Selling Pressure Is Easing, But Buying Pressure Remains Weak
Solana DMI chart shows a sharp decline in trend strength, with the ADX falling to 13.5 from 31.5 over the past three days. The ADX, or Average Directional Index, measures the strength of a trend, with readings above 25 typically indicating a strong trend and values below 20 suggesting weak or nonexistent trend momentum.
With the ADX now well below 20, it signals that Solana’s recent trend has significantly lost strength, leaving the market without a clear directional bias.
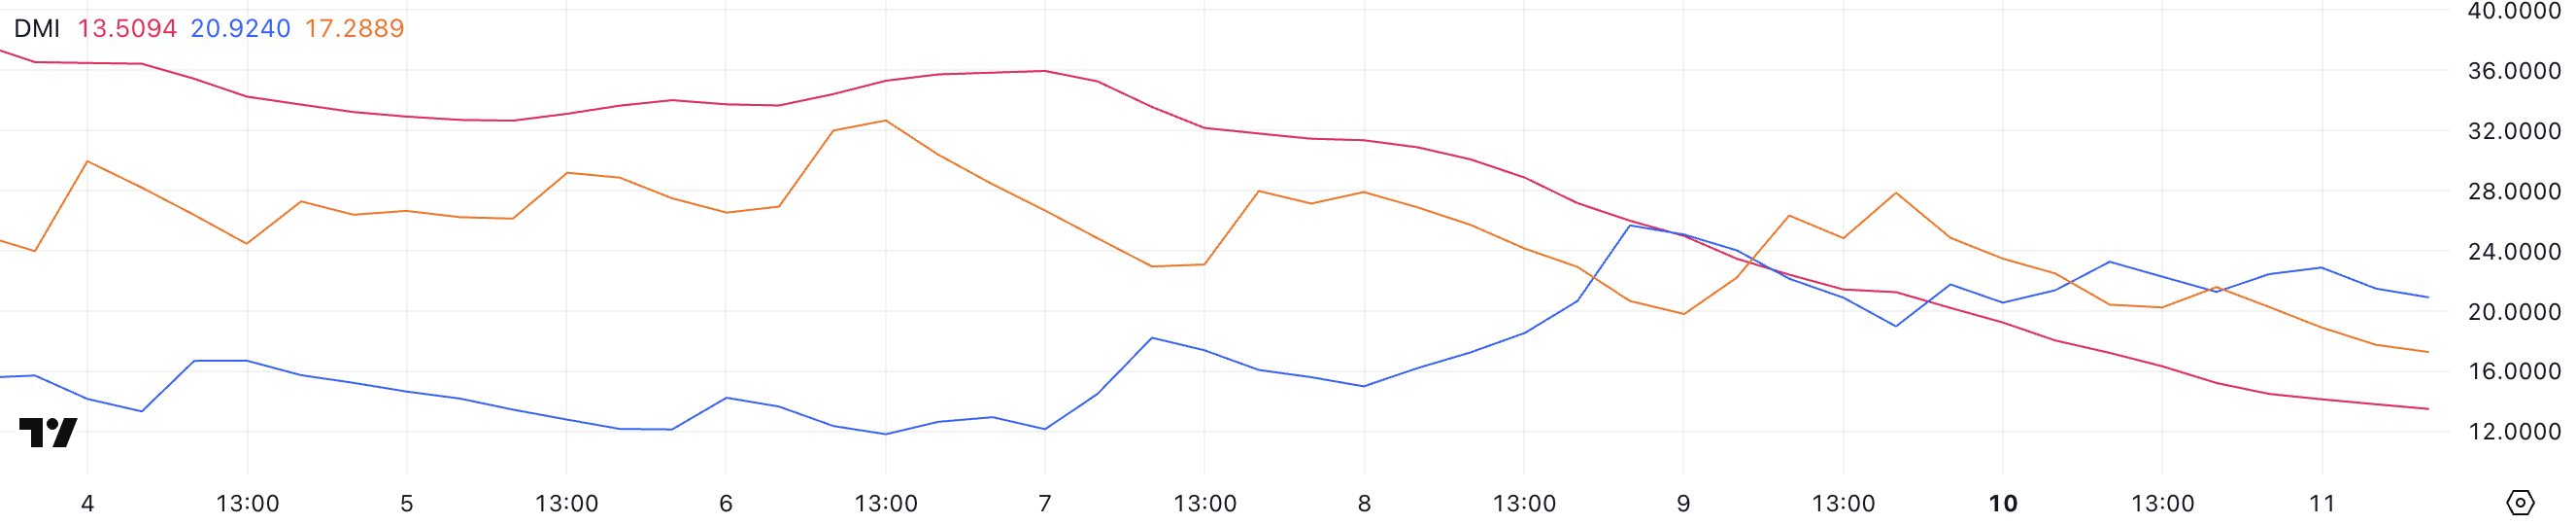 SOL DMI. Source: TradingView.
Looking at the directional indicators, +DI is at 20.9 and has fluctuated between 19 and 23 in the last two days, while -DI has dropped from 27.8 to 17.2. This suggests that bearish pressure has eased considerably, but bullish momentum has not strengthened enough to establish a clear uptrend.
With both indicators converging and ADX at very low levels, Solana is currently in a phase of consolidation rather than a decisive trend. Until a stronger directional move emerges, SOL price may continue to trade sideways, waiting for a catalyst to define its next move.
SOL Price Prediction: Will Solana Test The $220 Resistance Soon?
Solana price chart indicates that its EMA lines are narrowing, suggesting decreasing momentum and the absence of a clear trend direction. If bullish momentum returns and an uptrend develops, SOL price could first test the $220 resistance level.
A breakout above this could trigger further gains, potentially pushing the price to $244, its highest level since the end of January.
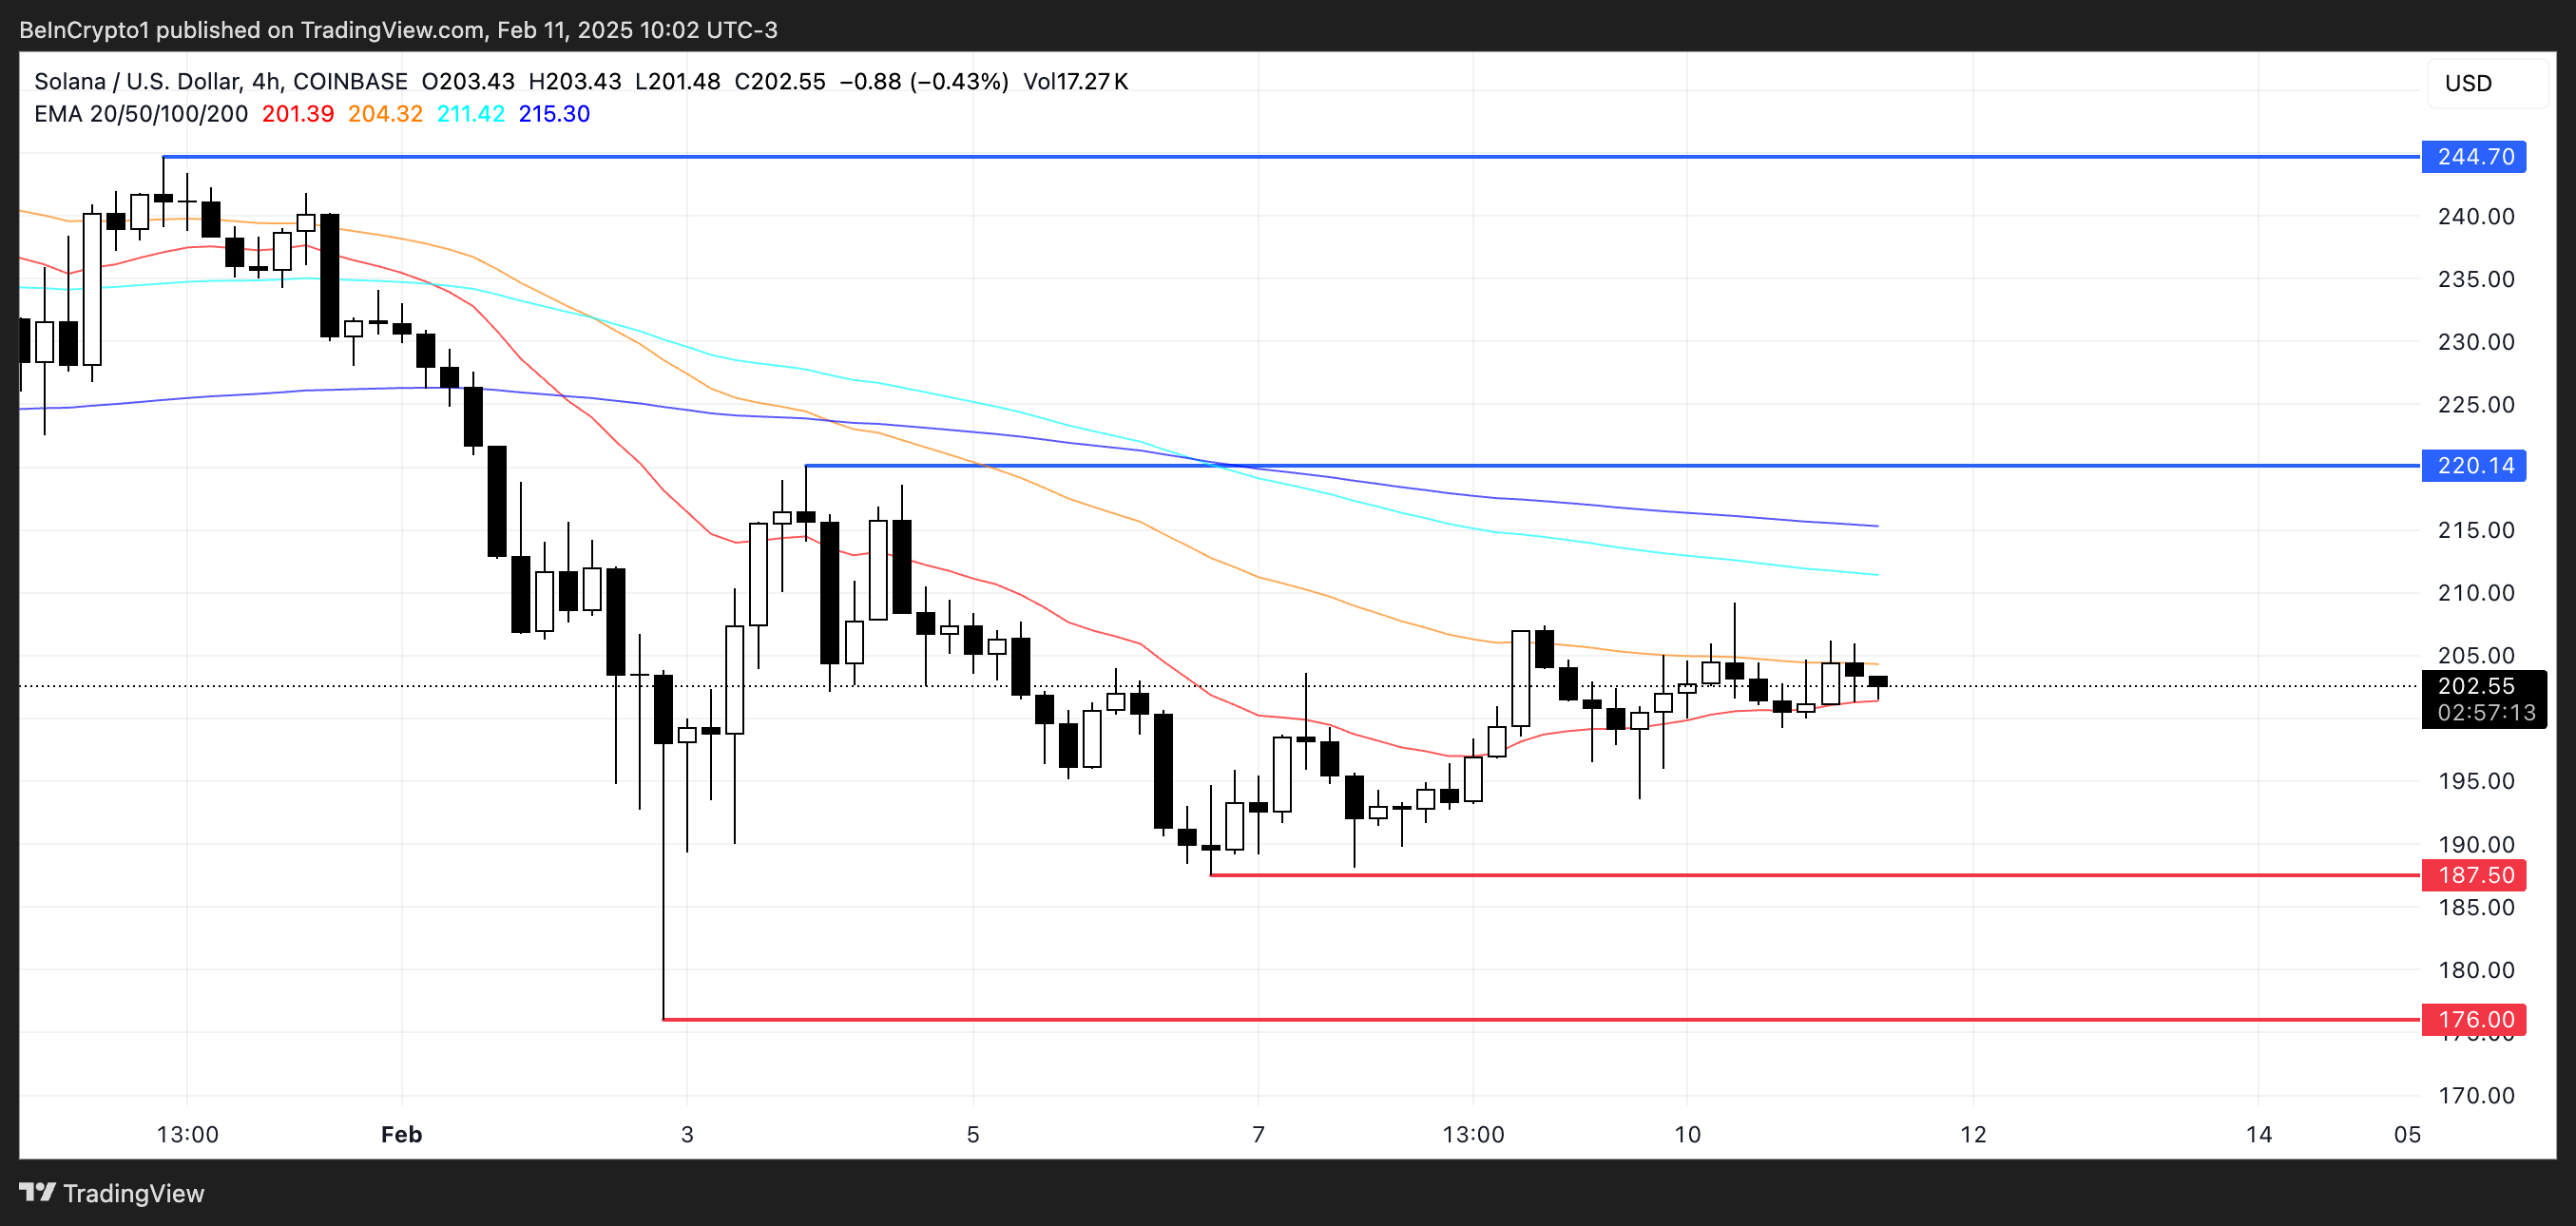 SOL Price Analysis. Source: TradingView.
On the other hand, if a downtrend emerges and strengthens, SOL price could retest its key support at $187. A break below this level would expose the price to further downside, with the potential to drop as low as $176, marking a 12.5% correction.
This scenario would indicate that sellers have gained control, increasing the likelihood of continued bearish movement. With EMA lines still converging, the market remains undecided, and the next move will depend on whether buyers or sellers take the lead.
The post Solana (SOL) Price Holds Around $200 While Whale Activity Weakens appeared first on BeInCrypto.


 English (US) ·