
 6 months ago
48
6 months ago
48
Sonic (S) is currently experiencing strong bullish momentum, with its price up nearly 15% in the last 24 hours and 53% over the past seven days. Its market cap now stands at $2.6 billion, reflecting growing investor interest and heightened trading activity.
Technical indicators show that Sonic’s ADX is at 51.6, confirming the strength of the ongoing uptrend. Its RSI of 78.4 suggests that buying pressure remains intense, although overbought conditions could lead to short-term pullbacks. Sonic could test resistance levels at $0.849 and potentially $1.06.
Sonic ADX Shows the Current Uptrend Is Strong
Sonic, formerly Fantom (FMT), ADX is currently at 51.6, showing a significant increase from 34 just three days ago and an even more dramatic rise from 19.8 eight days ago.
The rising ADX indicates a strengthening trend, reflecting growing market momentum. This rapid upward movement suggests that Sonic is experiencing increased volatility and directional strength, which could be indicative of heightened buying interest or intensified market activity.
Given the current uptrend, this surge in ADX could be interpreted as a confirmation of the ongoing bullish momentum, signaling that the price movement is gaining strength and may continue in the same direction.
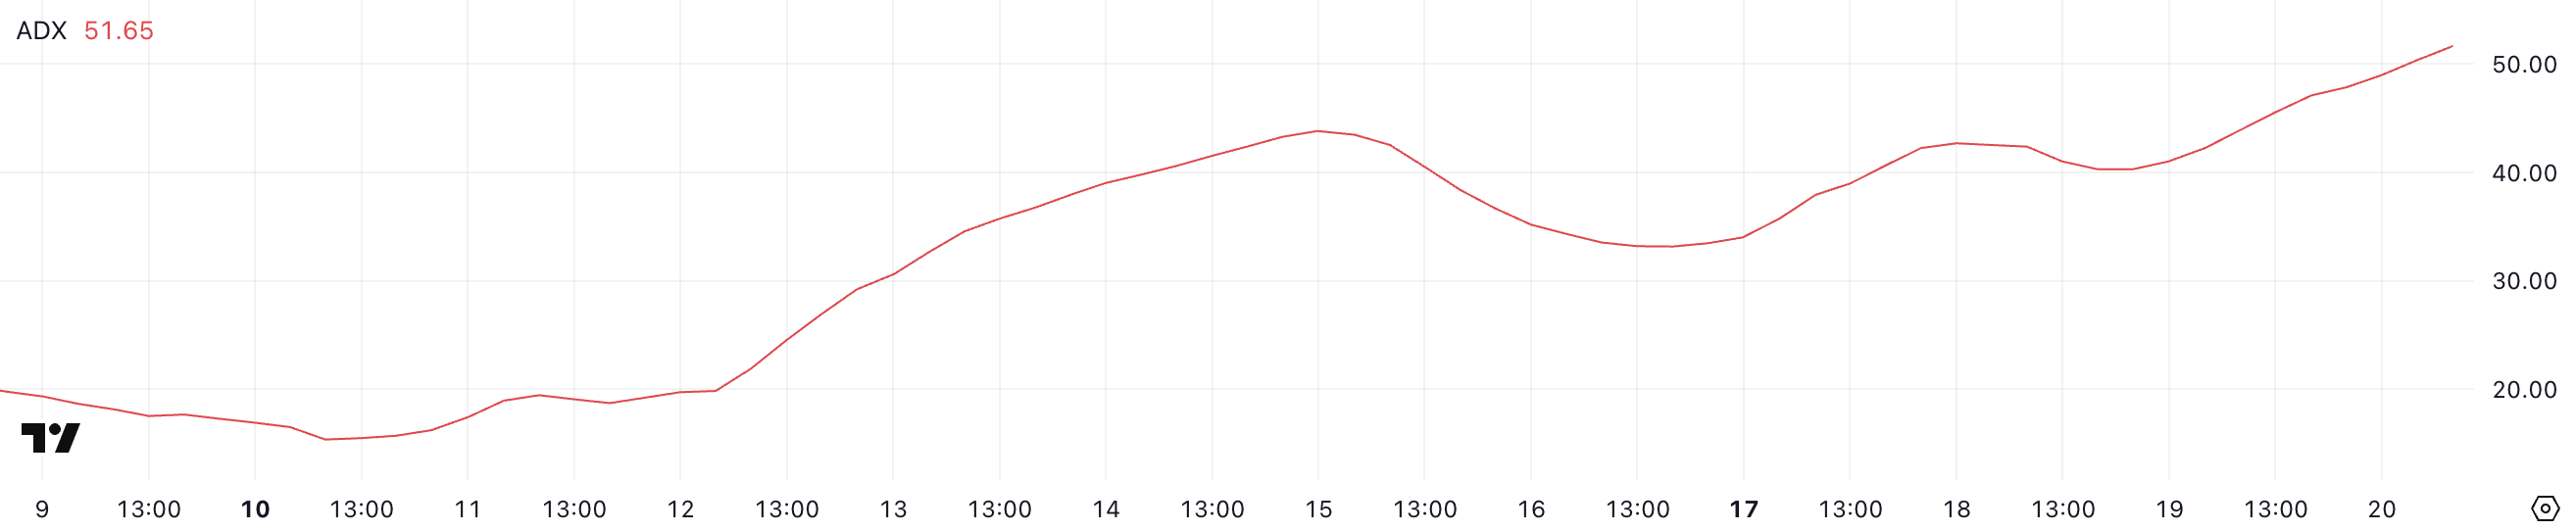 Sonic ADX. Source: TradingView.
The Average Directional Index (ADX) is a momentum indicator used to measure the strength of a trend, regardless of its direction. It does not indicate whether the trend is bullish or bearish, only its intensity.
Typically, an ADX below 20 suggests a weak or non-existent trend. Between 20 and 40 indicates a growing trend, while values above 40 signify a strong trend. With Sonic ADX at 51.6, the market is showing a powerful trend, supporting the current uptrend.
This Sonic strong momentum could lead to further price appreciation as it suggests sustained buying pressure. However, traders should watch for potential overextension or reversal signals as the trend matures.
S RSI Has Been Overbought For More Than a Day
Sonic’s RSI is currently at 78.4, a significant increase from 56 just two days ago. It has remained above 70 for more than a day, indicating strong upward momentum.
The rapid rise in RSI reflects heightened buying activity, suggesting that the bullish sentiment is intensifying. An RSI above 70 typically signals overbought conditions, implying that the asset may be overvalued in the short term.
Given the current uptrend, this elevated RSI could indicate continued buying interest; however, it also raises the possibility of a price pullback or consolidation as traders may begin to take profits.
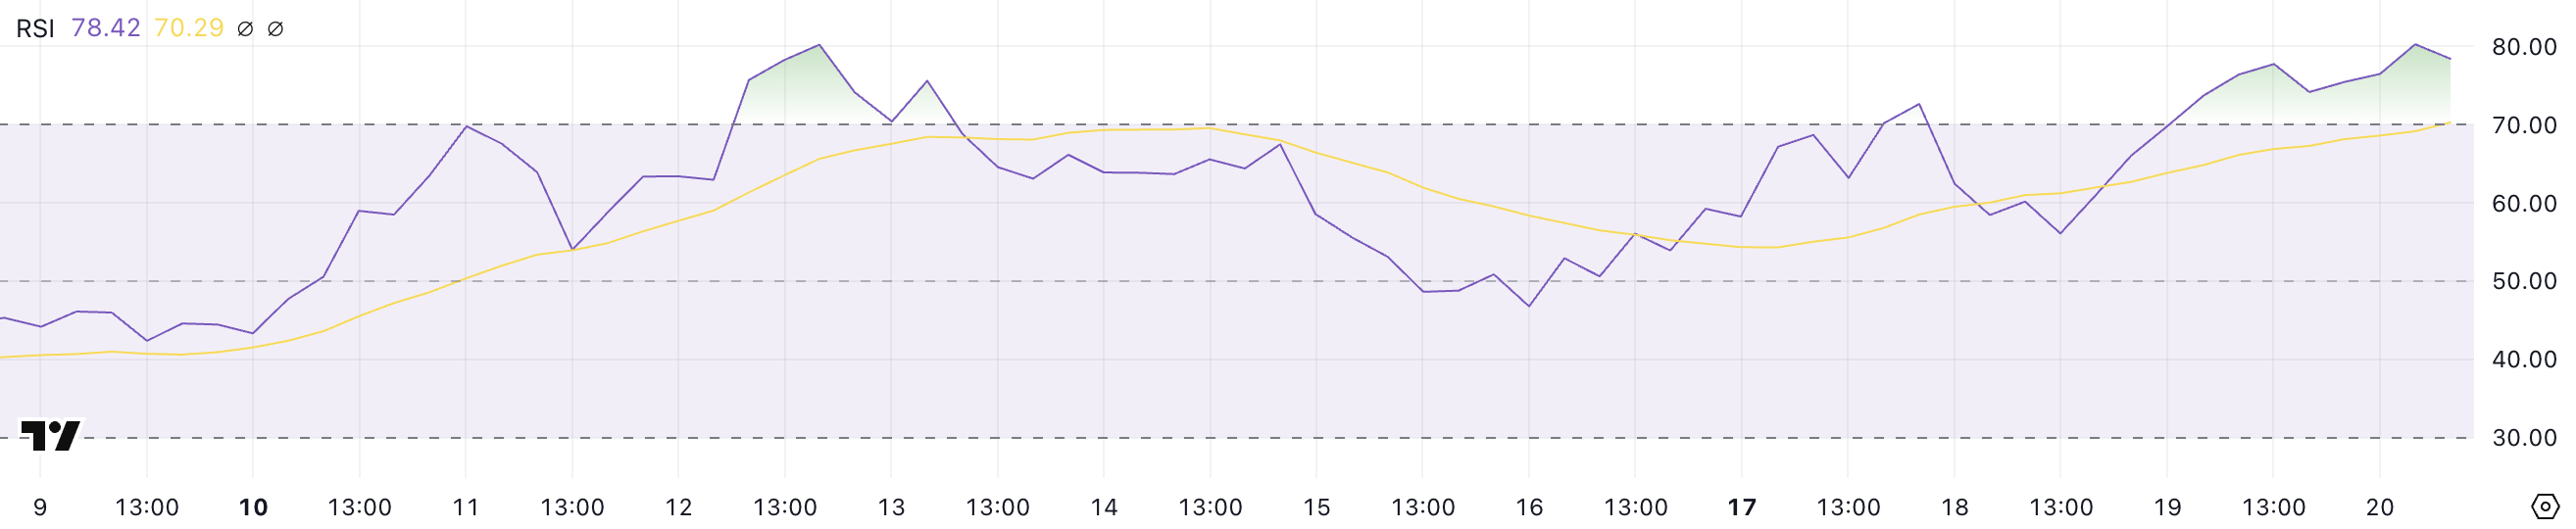 Sonic RSI. Source: TradingView.
The Relative Strength Index (RSI) is a momentum oscillator that measures the speed and change of price movements. It ranges from 0 to 100 and helps identify overbought or oversold conditions.
Generally, an RSI above 70 suggests the asset is overbought and could be due for a correction, while an RSI below 30 indicates oversold conditions, potentially signaling a buying opportunity. With Sonic’s RSI at 78.4, the asset is clearly in the overbought territory, which could lead to a short-term pullback or consolidation as traders capitalize on recent gains.
However, in strong uptrends, RSI can remain overbought for an extended period. This suggests that Sonic bullish momentum may continue before any significant correction occurs.
Will Sonic Break Above $1 In February?
Sonic’s EMA lines have recently formed two golden crosses, signaling strong bullish momentum. A golden cross occurs when a shorter-term EMA crosses above a longer-term EMA, typically indicating the start of an uptrend. If this bullish momentum continues, Sonic could test the resistance at $0.849.
Should it break through this level, the next price target for Sonic would be $1.06. That would mark its highest price since the end of December 2024. This would confirm the ongoing uptrend and could attract more buying interest, pushing Sonic prices higher as bullish sentiment strengthens.
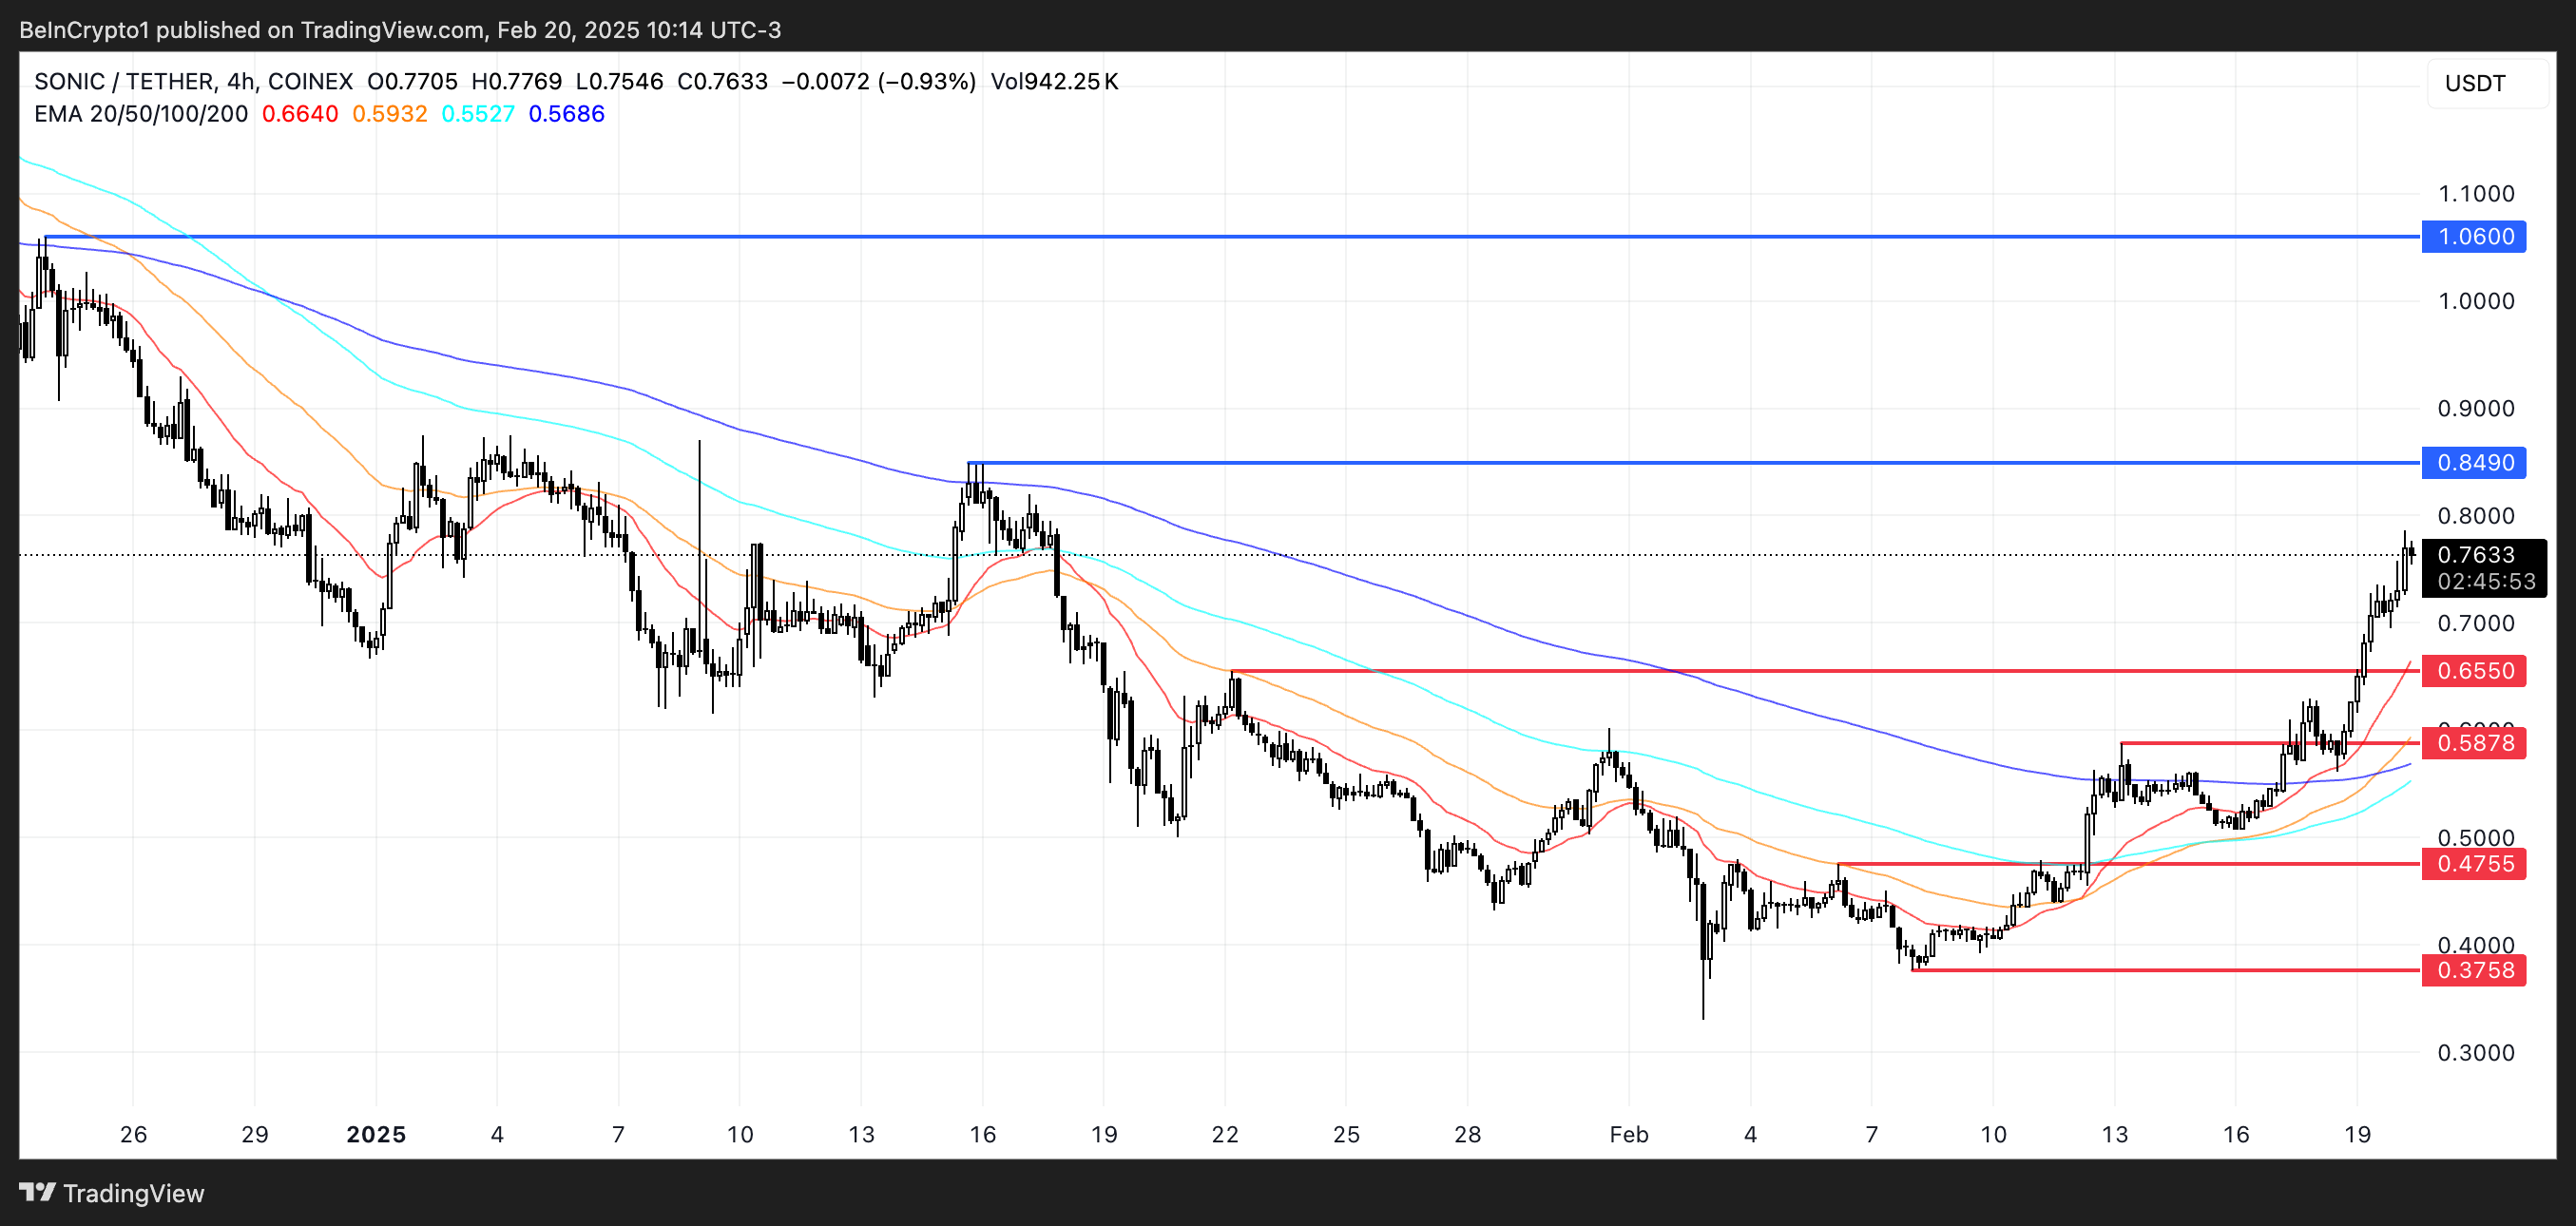 Sonic Price Analysis. Source: TradingView.
However, if the trend reverses, Sonic could face significant downside risks. The first support levels lie at $0.65 and $0.58, which, if breached, could open the door to further declines.
In this bearish scenario, Sonic might drop as low as $0.47. In the worst case, it could reach $0.37, representing a correction of over 50%.
The post Sonic (S) Surges Over 50% In a Week, Market Cap Surpasses $2.5 Billion appeared first on BeInCrypto.


 English (US) ·