
 1 month ago
55
1 month ago
55
SpaceX shares made history with the largest IPO ever, followed by a jump of nearly 20% in the first session. After the initial euphoria, SPCX is now in a consolidation phase. The daily chart remains structurally bullish, but the lower timeframes show short-term pressure that deserves attention.
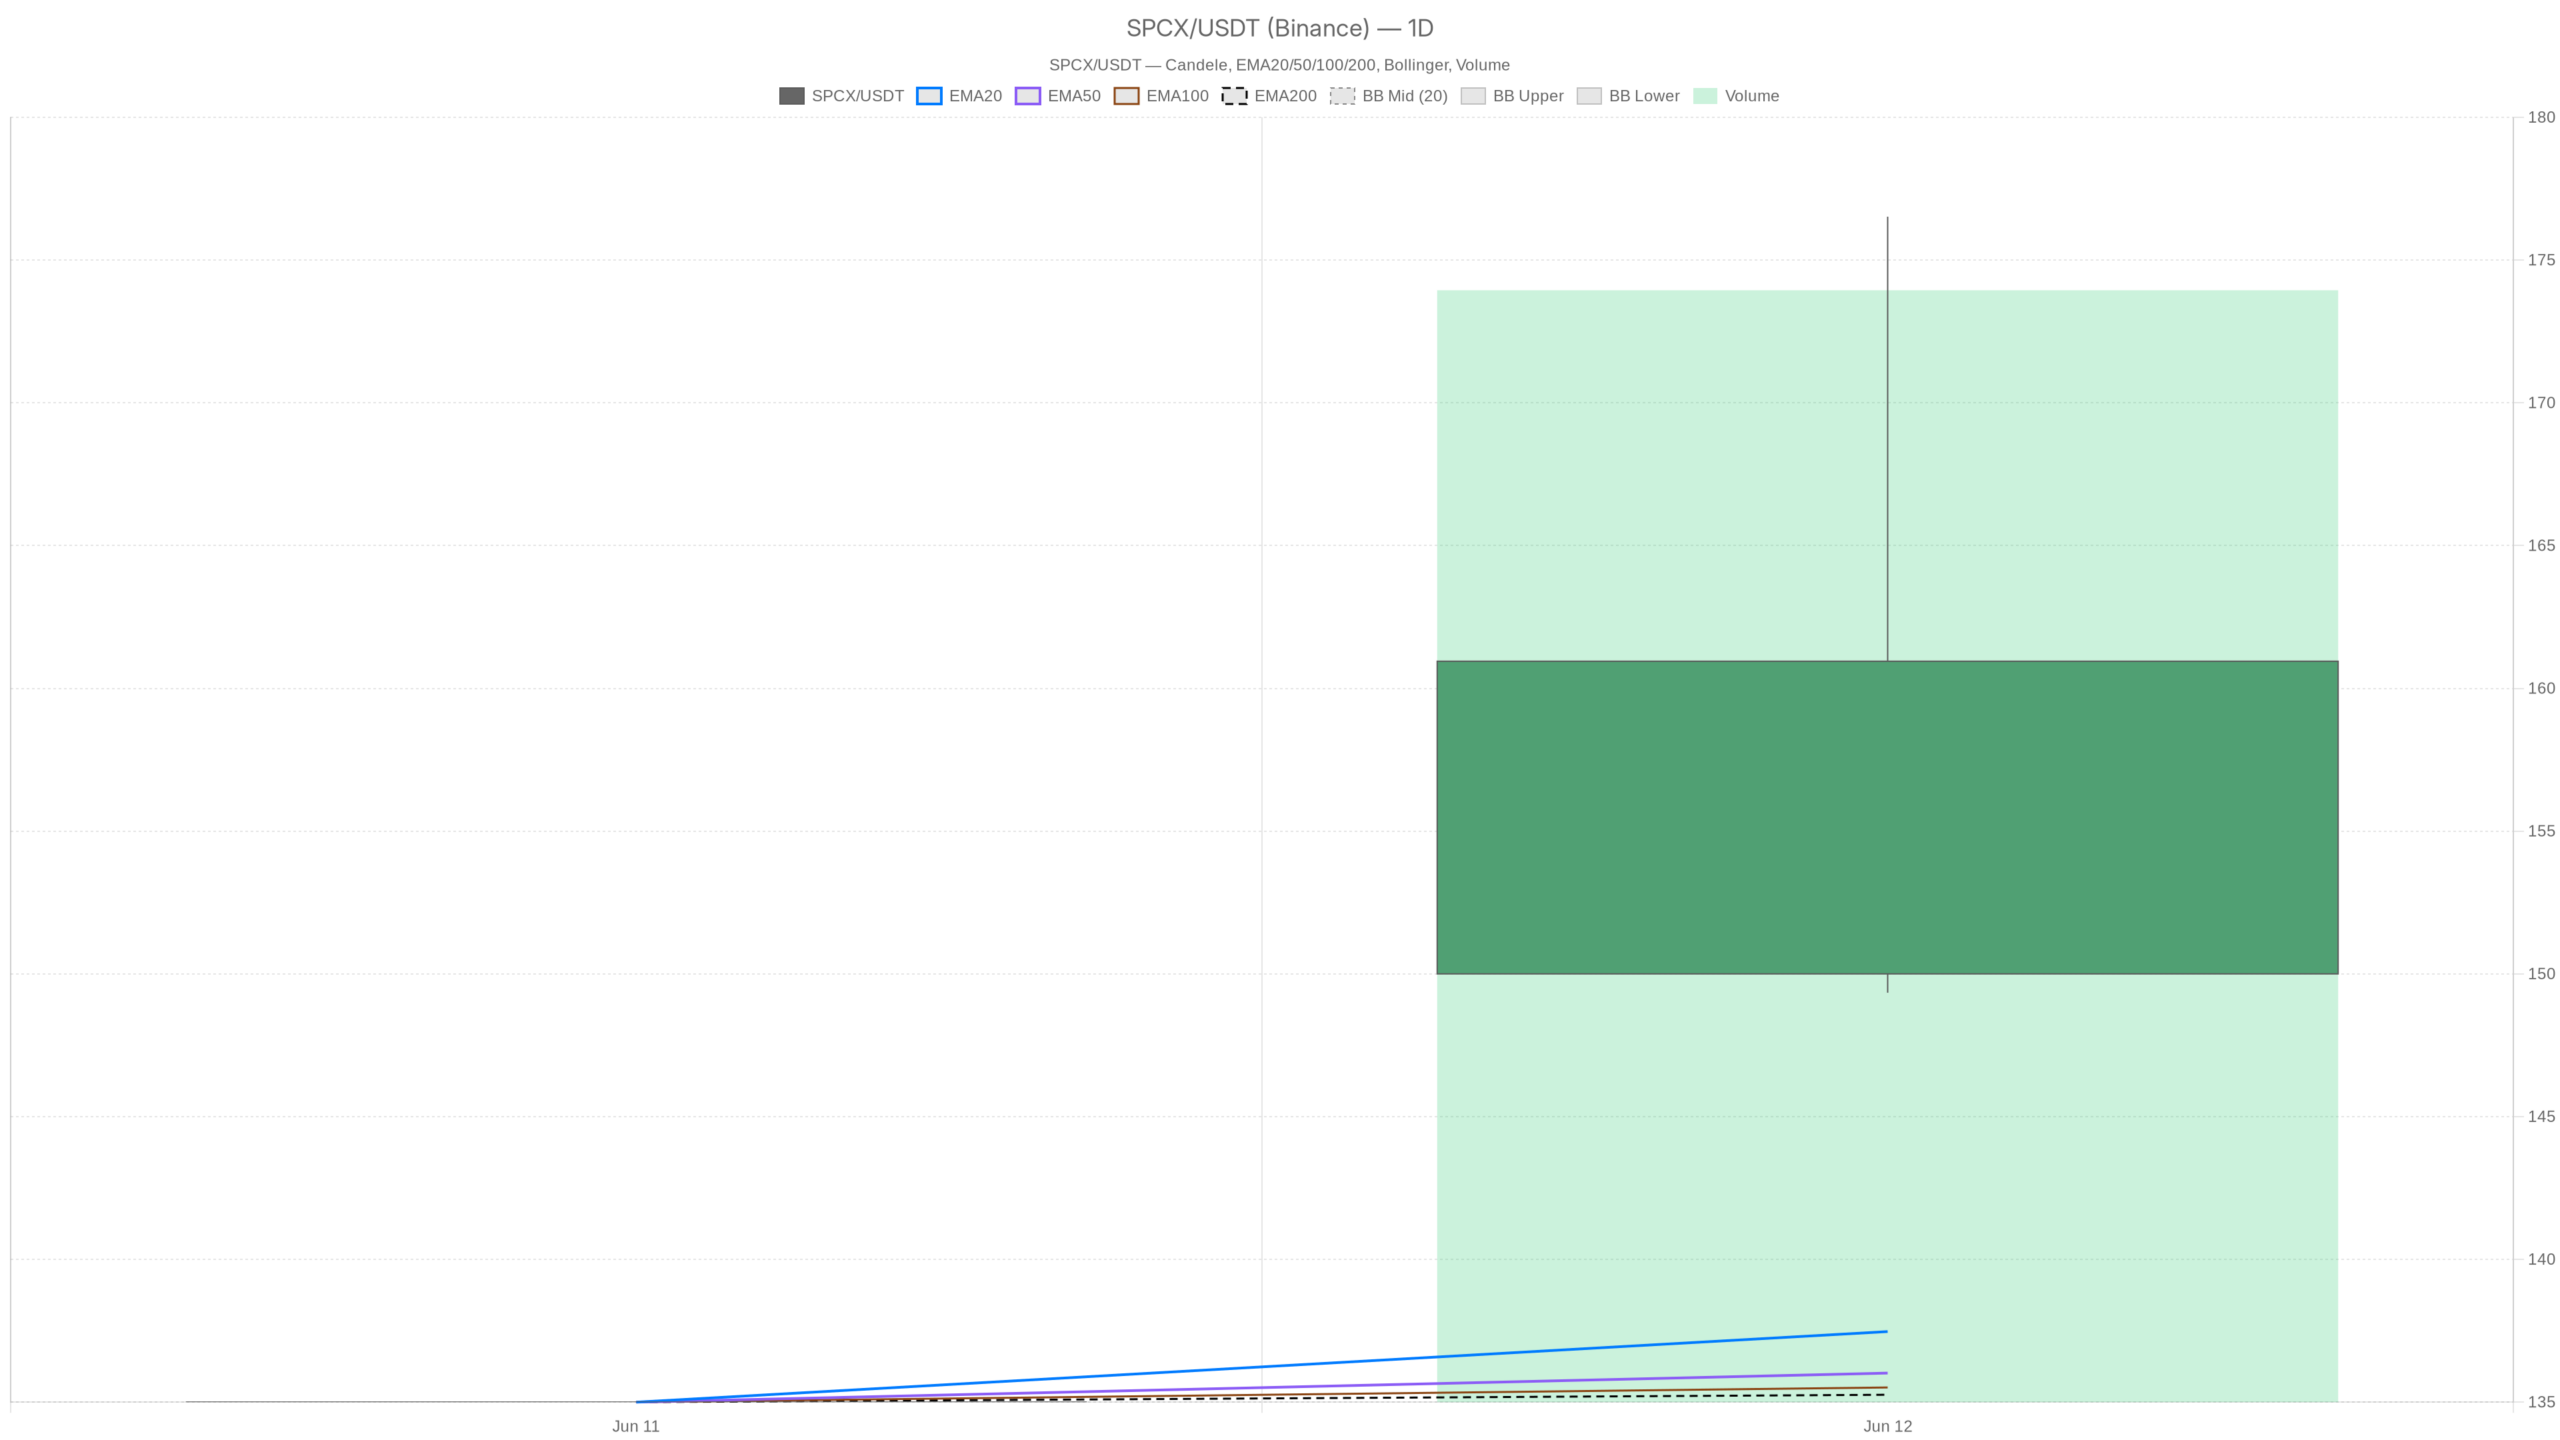 SPCX — daily chart with candles, EMA20/EMA50 and volumes.
Key points
- SPCX closed at $160.95, above all three daily EMAs (20, 50, 200)
- Daily MACD expanding: line at +2.07, histogram at +1.66
- On the hourly timeframe the price is below all three EMAs, with negative MACD
- Key resistance at $162.27 (daily pivot); critical S1 support at $148.02
- ATR at $5.14 confirms high volatility, typical of a newly listed stock
Daily structure: bullish strength still intact
The daily picture for SPCX is unequivocally bullish. The price closed the last session at $160.95, dominating all three main exponential moving averages. EMA20 at 137.47, EMA50 at 136.02, EMA200 at 135.26: aligned in ascending order and exceeded with a wide margin.
The daily range reached a high of 176.52 and a low of 149.34. A wide candle, a sign of physiological volatility for a newly listed stock. However, the distance between price and moving averages also opens the door to a normal short-term consolidation phase.
Daily momentum: MACD in full expansion
The MACD on the daily chart confirms the bullish push with clearly expanding momentum. The line stands at +2.07, the signal at +0.41 and the histogram at +1.66. The positive divergence between line and signal indicates that buying pressure still has room in the short to medium term.
The pivot levels complete the picture. The pivot point is at $162.27 — just above the current close — with resistance R1 at 175.20 and support S1 at 148.02. The price closes below its pivot: in the final phase of the session, selling prevailed. A decisive break above 162.27 would be the first signal of bullish continuation for SpaceX shares.
Hourly timeframe: short term slows down
On the one-hour timeframe the tone changes sharply. SPCX trades at 161.27, with all hourly EMAs positioned above the price. EMA20 at 165.16, EMA50 at 165.10, EMA200 at 165.01: three almost overlapping moving averages above the current price.
The price has moved lower, a warning sign for those looking for immediate long entries. It is not a reversal, but a phase of bearish pressure that contrasts with the strength of the daily chart. The hourly MACD confirms this as well: line at -0.06, signal at +0.20, histogram at -0.26. Momentum in negative territory, neutral regime. Oscillation dominates this timeframe.
15-minute timeframe: the friction zone
The 15-minute chart precisely identifies the area where friction between buyers and sellers is concentrated. SPCX closes at 161.27, with candle range between 157.86 and 162.77. The EMAs remain above: EMA20 at 165.29, EMA50 at 164.07, EMA200 at 162.23.
The 14-period RSI stops at 47, just below neutrality. No excess in either direction: neither overbought to unwind, nor oversold to justify an immediate rebound. The 15-minute MACD is the weakest among the three timeframes: line at -0.07, signal at +1.26, histogram at -1.33. The negative divergence is pronounced and the 162–163 area acts as short-term resistance.
The ATR at $5.14 confirms the stock’s high volatility. For a newly listed asset this is normal, but intraday swings remain wide and levels must be managed carefully.
Bullish scenario: levels to reclaim
To resume the trend, SPCX must first reclaim the daily pivot at $162.27. An hourly close above that threshold would change the market tone, signaling that buyers are regaining control.
The next step is the area of the hourly EMAs, all clustered around $165. A move back above those averages would turn the current pullback into healthy consolidation, leaving the bullish daily structure intact. At that point the natural target becomes R1 at 175.20, in line with the previous session’s high.
The positive and expanding daily MACD supports this scenario. If the price stabilizes above 160–162, the odds of a new bullish impulse remain high. Musk’s forecasts of one trillion in revenues by 2030 further fuel the positive long-term sentiment.
Bearish scenario: supports to defend
The picture deteriorates if SPCX decisively breaks the daily S1 support at $148.02. That area represents the lower edge of the debut session’s range. Losing it would invalidate part of the technical structure built in the first sessions.
In the short term, the first critical level to monitor is $158.22, S1 support of the hourly pivot. A close below that threshold would increase bearish pressure and open the way towards the 155–154 dollar area. In this scenario, the negative hourly MACD and EMAs above the price would paint a picture of weakness that is hard to ignore. SpaceX’s first earnings report, expected between late July and early August, adds fundamental uncertainty that could amplify moves in both directions.
Context: structural strength, short-term tension
The tension between timeframes is the real message from the market at this stage. The daily chart shows a bullish regime with aligned EMAs and positive MACD. The hourly and 15-minute charts instead show price below the averages, with negative momentum.
This divergence is physiological in the first weeks after listing. The market is seeking balance after the debut euphoria. It is not distribution — volumes and daily structure do not suggest that — but short-term directionality remains opaque. Traders are monitoring the 162–163 dollar area as resistance and the 158–148 dollar band as structural support. The SpaceX share price is in the middle. From here the next directional move will be born.
FAQ
What is the first level to break for a bullish signal on SPCX?
The daily pivot at $162.27. An hourly close above this threshold would be the first concrete signal of a resumption of the bullish trend.
Where is the critical support for SpaceX shares?
The daily S1 support at $148.02. Losing it would invalidate part of the bullish structure built at the debut. In the short term, the first level to monitor is $158.22.
What does the divergence between daily and hourly timeframe indicate?
It is a common condition after an IPO. The daily chart remains bullish, but the short term shows a consolidation phase in which momentum has lost steam. It is not a reversal, but a moment of compression before the next directional move.
Why is SPCX’s ATR so high?
The 14-period ATR stands at $5.14, a significant level typical of newly listed stocks. Volatility is physiological at this stage and requires careful management of support and resistance levels.
{“@context”:”https://schema.org”,”@type”:”FAQPage”,”mainEntity”:[{“@type”:”Question”,”name”:”What is the first level to break for a bullish signal on SPCX?”,”acceptedAnswer”:{“@type”:”Answer”,”text”:”The daily pivot at $162.27. An hourly close above this threshold would be the first concrete signal of a resumption of the bullish trend.”}},{“@type”:”Question”,”name”:”Where is the critical support for SpaceX shares?”,”acceptedAnswer”:{“@type”:”Answer”,”text”:”The daily S1 support at $148.02. Losing it would invalidate part of the bullish structure built at the debut. In the short term, the first level to monitor is $158.22.”}},{“@type”:”Question”,”name”:”What does the divergence between daily and hourly timeframe indicate?”,”acceptedAnswer”:{“@type”:”Answer”,”text”:”It is a common condition after an IPO. The daily chart remains bullish, but the short term shows a consolidation phase in which momentum has lost steam. It is not a reversal, but a moment of compression before the next directional move.”}},{“@type”:”Question”,”name”:”Why is SPCX’s ATR so high?”,”acceptedAnswer”:{“@type”:”Answer”,”text”:”The 14-period ATR stands at $5.14, a significant level typical of newly listed stocks. Volatility is physiological at this stage and requires careful management of support and resistance levels.”}}]}
Disclaimer: This article is for informational purposes only and does not constitute financial advice, investment recommendation or a solicitation to buy or sell financial instruments or cryptocurrencies. The analyses do not guarantee future results. Investments in crypto-assets and financial markets involve a high risk of capital loss. Always do your own research (DYOR) and consult a qualified financial advisor before making any decision.
Content created with the assistance of artificial intelligence and human editorial review.


 English (US) ·