
 3 weeks ago
53
3 weeks ago
53

Spotify stock closed at $478.14 on July 17, compressed between its EMA20 and EMA50. That tight range signals indecision, not conviction. However, a positive daily MACD histogram and growing analyst preference for SPOT over peers suggest the balance of risks may be tilting.
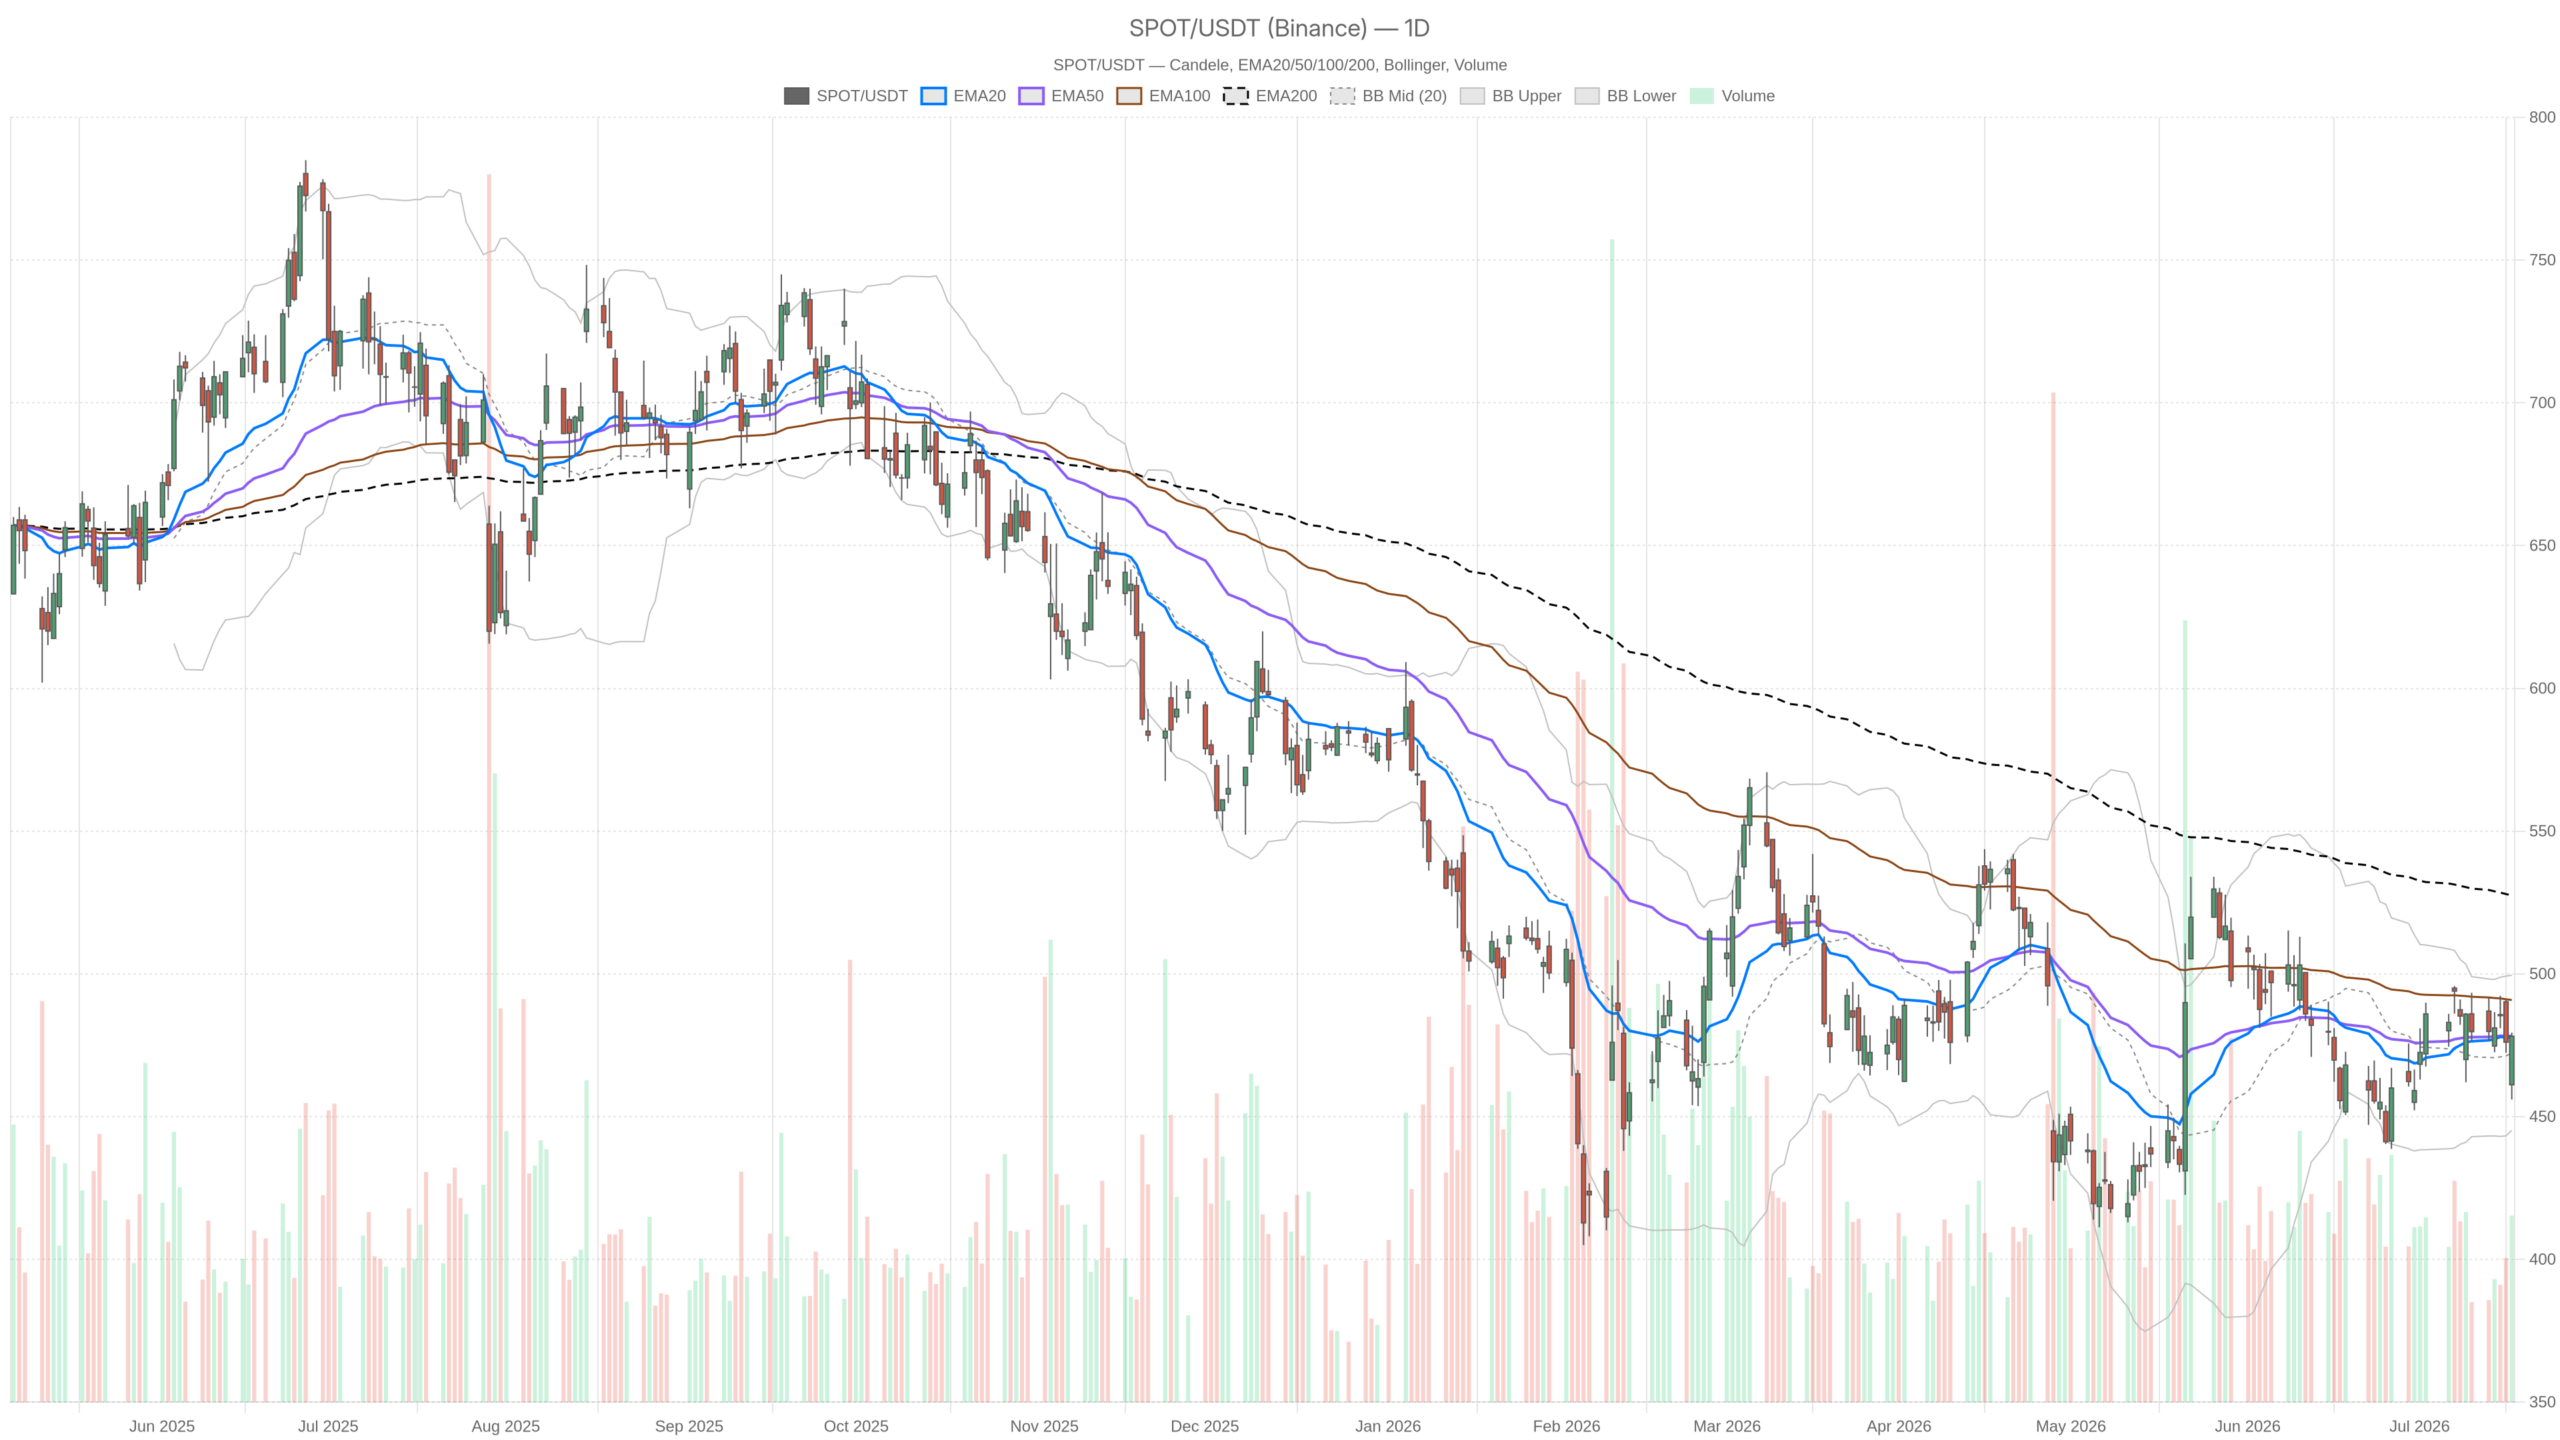 SPOT — daily chart with candlesticks, EMA20/EMA50 and volume.
Key takeaways
- SPOT closed at $478.14 on July 17, pinned between its EMA20 ($477.79) and EMA50 ($478.23), signaling indecision.
- The daily MACD histogram turned positive at 0.64, with the MACD line at 1.55 above the signal line at 0.91.
- The EMA200 at $527.45 remains nearly 50 points above current price, a significant overhead obstacle.
- Jefferies maintained a Buy rating with a $600 price target, citing a steady Q2 setup.
- ATR14 at $16.70 signals that meaningful daily swings remain possible in either direction.
Spotify Stock Daily Structure: Modest Bullish Edge
The daily chart for Spotify stock is technically neutral, but subtle momentum signals are tilting the bias slightly upward.
Notably, SPOT trades well below the EMA200 at $527.45. That gap — nearly 50 points — makes any near-term bullish thesis conditional. A sustained recovery would require a significant re-rating catalyst, not merely steady earnings.
The daily MACD, however, tells a more constructive micro-story. The MACD line sits at 1.55 above the signal line at 0.91. The positive histogram of 0.64 confirms momentum is quietly building. Meanwhile, RSI14 at 50.44 rests at the neutral midpoint, leaving room for movement in either direction.
Meanwhile, Bollinger Bands frame the current range. Price sits between the midline at $472.37 and the upper band at $499.53. This places SPOT in the upper half of its recent volatility envelope. The lower band at $445.21 defines the downside boundary.
Daily pivot analysis adds precision. The pivot point is $471.19, with R1 at $486.38 and S1 at $462.95. SPOT’s close at $478.14 keeps it above the daily pivot — a mild structural positive.
Hourly View Reveals Intraday Tension
The 1H chart for SPOT shows a neutral regime with conflicting signals that complicate the near-term outlook.
Currently, price trades between the EMA20 at $477.29 and the EMA200 at $476.22. The EMA50 sits slightly overhead at $479.22. This tight cluster reflects compressed intraday indecision among traders.
Unlike the improving daily MACD, the hourly MACD line stands at -2.13, still below the signal at -2.24. The histogram is barely positive at 0.11 — a tentative turn, not confirmation. Hourly RSI at 49.86 echoes the neutral daily read.
At the same time, the hourly Bollinger midline at $478.81 sits just above price, creating a minor resistance layer. A clean break above $479.22 (EMA50) and $479.80 (hourly R1) would signal constructive intraday momentum. Failure to hold S1 at $475.99 would invite a pullback toward $473–$465.
Spotify Stock: 15-Minute Momentum Favors the Bulls
The 15-minute chart is the only timeframe where Spotify stock shows a clearly positive technical setup.
The MACD histogram stands at 0.82. The MACD line at 0.98 sits well above the signal at 0.17. RSI14 has pushed to 61.8 — elevated but not yet overbought. Price holds above both EMA20 ($474.65) and EMA50 ($475.61), though remains below the EMA200 ($479.76).
However, the 15m setup is execution context, not a strategic signal. It hints that the path of least resistance at the open may point toward the $479.43–$479.80 resistance cluster.
Fundamental Narrative: Growth Meets Valuation Pressure
The fundamental outlook for Spotify stock is constructively divided, with institutional analysts highlighting both opportunity and risk.
Notably, BofA Securities analyst Jessica Reif Ehrlich has argued that SPOT may be the streaming stock to favor over Netflix. This comes as NFLX faces pressure from disappointing forward guidance. That kind of direct institutional comparison carries weight.
Janus Henderson Investors, meanwhile, flagged that the market may have overlooked Spotify despite robust results. This observation implies potential undervaluation relative to fundamentals. Jefferies maintained its Buy rating with a $600 price target, citing a steady Q2 setup and a positive long-term view.
The counterargument, however, is not dismissible. One analysis frames SPOT’s growth story as intact but under threat from its valuation level, ongoing royalty costs, and rising competitive pressure. That risk-reward tension maps directly onto the technical picture — a stock that has recovered but remains far below its EMA200.
Additionally, Spotify’s recent product moves — expanding parent-managed accounts to the free tier and rolling out AI-labeling tools — speak to platform quality and regulatory positioning. These are longer-duration value drivers, not near-term catalysts.
Bullish and Bearish Scenarios for Spotify Stock
Spotify stock faces a clear technical roadmap in both directions, with well-defined levels to watch.
Bullish Case
The bullish scenario requires SPOT to clear $479.80 (hourly R1) and then target the daily R1 at $486.38. Above that, the upper Bollinger Band at $499.53 becomes a realistic objective. A Q2 earnings beat or positive user growth commentary would support this path. A move toward Jefferies’ $600 target would ultimately require reclaiming the EMA200 at $527.45.
Bearish Case
The bearish case is simpler technically. A failure below daily S1 at $462.95 and the Bollinger lower band at $445.21 would signal the recovery is fading. A miss on Q2 subscriber metrics, rising royalty cost guidance, or a broad risk-off move could flip the neutral bias to bearish. The EMA200’s distance remains a constant reminder of repair work ahead.
Positioning: Volatility Demands Patience
Spotify stock sits in a technically ambiguous position that argues against aggressive directional positioning ahead of earnings.
Overall, the daily bias is neutral, the hourly setup is tentative, and only the 15-minute frame shows clean bullish momentum. That hierarchy argues against aggressive bets in either direction. The ATR14 of $16.70 means a single session can cover substantial ground — both to the upside and downside.
Patience here is not passivity. It reflects the reality that the next meaningful catalyst will resolve current ambiguity. The Q2 earnings release is the likely trigger.
FAQ
What is the outlook for Spotify stock based on the daily chart?
The daily chart for Spotify stock is neutral, but subtle momentum signals are tilting the bias slightly upward. The MACD histogram has turned positive at 0.64, with the MACD line at 1.55 above the signal line at 0.91. However, the EMA200 at $527.45 remains nearly 50 points above the current price of $478.14.
What are the key resistance levels for SPOT?
Key resistance levels include $479.80 (hourly R1), $486.38 (daily R1), and the upper Bollinger Band at $499.53. A sustained move toward Jefferies’ $600 price target would require reclaiming the EMA200 at $527.45.
What do analysts say about Spotify stock?
BofA’s Jessica Reif Ehrlich has highlighted SPOT as a preferred streaming pick over Netflix. Jefferies maintains a Buy rating with a $600 price target. At the same time, some analysts flag concerns about valuation levels and ongoing royalty costs.
Disclaimer: This article is for informational purposes only and does not constitute financial advice, an investment recommendation, or a solicitation to buy or sell any financial instrument or cryptocurrency. The analysis provided is not indicative of future results. Investing in crypto assets and financial markets carries a high risk of capital loss. Always do your own research (DYOR) and consult a qualified financial advisor before making any decision.
Article produced with the assistance of artificial intelligence and reviewed by the editorial team.






 English (US) ·