
 1 month ago
60
1 month ago
60
- Stellar is trading near $0.151 as it holds support inside a descending channel
- Analysts say a confirmed channel bounce could shift short-term sentiment
- Futures data shows rising open interest but mild bearish pressure remains
Stellar has been drifting through a difficult stretch lately. The token is holding near an important support area while trading inside a descending channel, and the overall mood around the asset feels… cautious. Nothing dramatic yet, but the pressure from sellers hasn’t really disappeared either.
At the moment, XLM is trading around $0.1517, marking a roughly 2.1% drop over the past 24 hours. Trading activity has cooled as well, with daily volume falling about 18% to roughly $110.9 million. Zoom out a bit further and the weekly picture looks similar — Stellar has slipped around 4.1% over the last seven days.
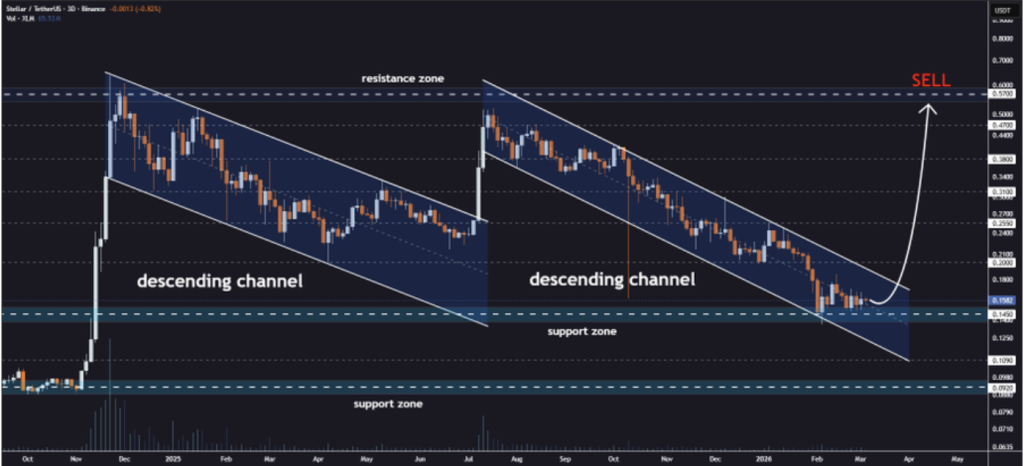
Descending Channel Structure Still Holds
Despite the weakness, some analysts believe the chart structure itself is still intact. Market analyst Jonathan Carter recently pointed out that Stellar appears to be forming what he described as a “channel bounce” setup.
On the three-day timeframe, the price has remained inside the descending channel rather consistently. In other words, the structure hasn’t broken down yet. That matters, because sometimes assets bounce off the lower boundary of these channels before attempting a recovery.
Carter suggested that if a confirmed bounce occurs — and if volume begins increasing — short-term sentiment could shift. It wouldn’t guarantee a rally, of course, but it might open the door for buyers to regain some confidence.
Potential Upside Targets if Momentum Builds
Should the market see stronger buying activity, Carter outlined several potential price targets. These levels would likely appear gradually if the bounce gains traction.
The first level sits around $0.200, followed by higher resistance zones near $0.255 and $0.310. Beyond that, additional targets could appear around $0.380, $0.470, and eventually $0.570.
That said, traders remain cautious for now. Without stronger trading volume, those targets remain more like possibilities rather than immediate expectations.
XLM Remains Below Major Moving Averages
Technically speaking, Stellar is still facing several hurdles. The price is currently trading below all major exponential moving averages, which tends to signal that sellers still dominate the broader trend.
The 20-day EMA is sitting near $0.1595 and represents the nearest short-term resistance line. If XLM tries to push upward, that level will likely be the first challenge.
Above that sits the 50-day EMA at around $0.1757, forming another barrier for the asset. Further up the chart, the 100-day EMA stands near $0.2040, while the longer-term 200-day EMA rests at roughly $0.2421.
The gap between the current price and those longer averages shows how far Stellar still sits below its broader trend.
Bollinger Bands Show Tight Volatility Range
Looking at the Bollinger Bands adds another layer to the picture. The upper band currently sits near $0.1701, while the middle band appears around $0.1589.
The lower band — the nearest support indicator — rests near $0.1476.
All three bands are relatively close together right now, which signals a period of compressed volatility. Markets often behave this way before a larger move begins, though the direction of that move isn’t always obvious.
Sometimes it breaks upward. Sometimes downward.
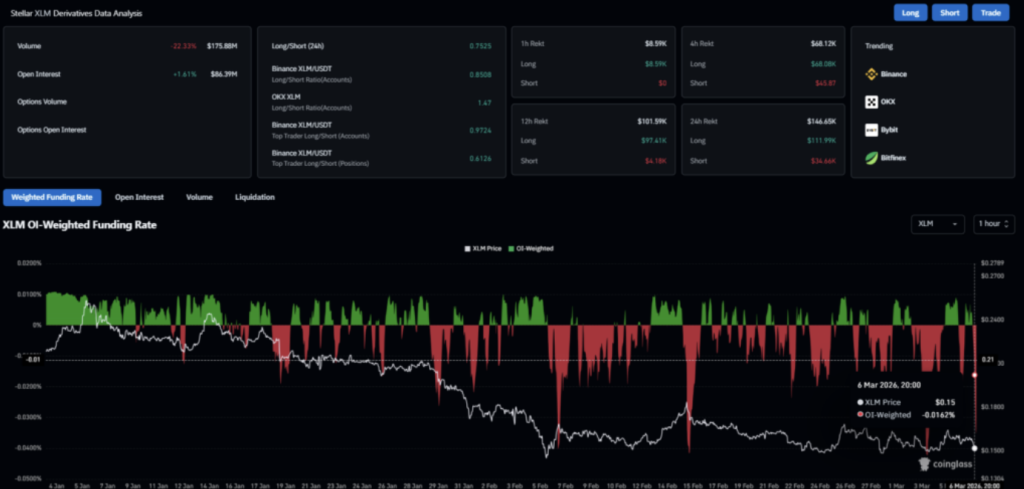
Futures Data Shows Mixed Sentiment
Derivatives data also paints a somewhat mixed picture. According to CoinGlass, futures trading volume for XLM dropped around 22.3% and now sits near $175.9 million.
Interestingly, open interest actually increased slightly — rising about 1.6% to roughly $86.39 million. That combination suggests traders are still maintaining positions even as trading activity cools.
The funding rate currently sits around -0.0162%, which reflects mild short-side pressure. In simple terms, more traders appear to be betting on price declines rather than immediate rallies.
Liquidations Reflect Ongoing Market Adjustments
Liquidation data highlights how the market has been reacting to the recent price movement. Over the past 24 hours, total liquidations across XLM derivatives reached about $146,650.
Long positions accounted for the majority of that activity, with roughly $111,990 in liquidations. Short liquidations came in much lower, totaling about $34,660.
That imbalance shows bullish traders were hit harder during the latest move — another sign that the market remains fragile in the short term.
For now, Stellar continues hovering near the lower edge of its descending channel. If buyers step in and defend the support zone, a bounce could develop. But if selling pressure increases again… the structure may face a tougher test.
Disclaimer: BlockNews provides independent reporting on crypto, blockchain, and digital finance. All content is for informational purposes only and does not constitute financial advice. Readers should do their own research before making investment decisions. Some articles may use AI tools to assist in drafting, but every piece is reviewed and edited by our editorial team of experienced crypto writers and analysts before publication.


 English (US) ·