
 2 months ago
25
2 months ago
25
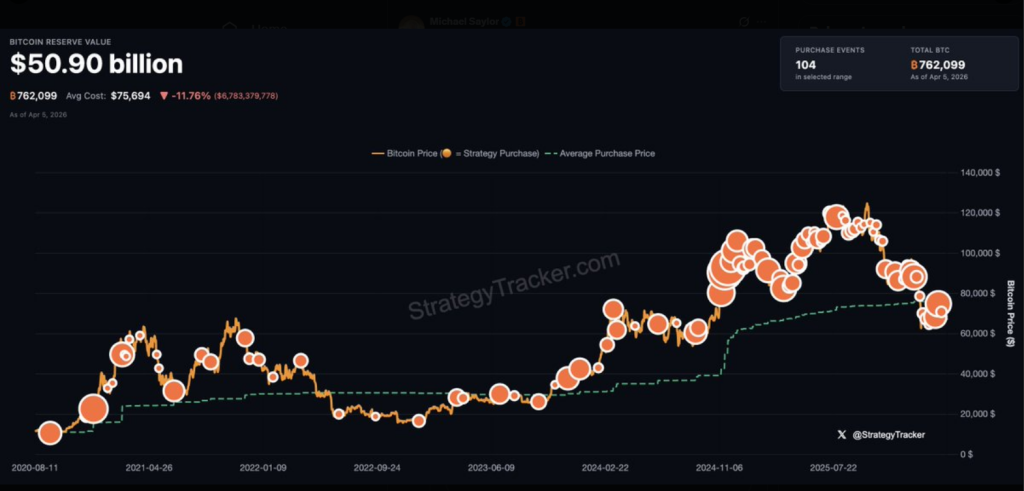
With Bitcoin trading near $69,000, Strategy is sitting on an unrealized loss on its large cryptocurrency holdings, yet the company’s founder shows no sign of pulling back.
Saylor’s Orange Dot Returns
Michael Saylor posted what followers recognized immediately: the orange dot chart his company uses to signal a fresh round of Bitcoin buying.
The post, shared on X over the weekend, came with a simple caption — “back to work” — after Strategy sat out the previous week without making a single purchase.
The company is expected to confirm the exact amount acquired when it releases its weekly disclosure on Monday.
Strategy, which rebranded from MicroStrategy, now holds 762,099 Bitcoin. At current prices, those coins are worth just close to $51 billion. The company paid an average of $75,699 per coin, meaning the current market price leaves it underwater by about 11%.
₿ack to Work. pic.twitter.com/mbZTWiNUct
— Michael Saylor (@saylor) April 5, 2026
Dilution Risk Shadows The Bitcoin Bet
To keep buying, Strategy relies on selling shares — both common stock and preferred shares — to raise cash. Reports indicate the company still has billions of dollars in at-the-money share offerings available.
One preferred share program, known as STRC, recently pulled in enough funds to purchase more than 1,800 Bitcoin on its own.
But the math is getting harder to ignore. Strategy’s net asset value premium has slipped below 1, which means the market is no longer valuing the stock above the worth of the Bitcoin it actually holds.
When that premium disappears, the case for buying the stock instead of Bitcoin directly becomes harder to make. Continued share sales chip away at existing shareholders by increasing the total number of shares in circulation.
If Bitcoin were to climb back to its record high of $126,300, the company’s current stash would be worth more than $96 billion — a number that makes the dilution argument easier to stomach for believers in the trade.
Stock Chart Flashes Warning SignsThe technical picture for MSTR is grim by most standard measures. The stock traded at $120 at the end of last week, down from an all-time high of $542. It has broken below a key support level at $2320 — a floor it held as recently as March of last year.
A death cross has formed on the chart, with the 50-day moving average crossing beneath the 200-day moving average. The stock has also stayed below its Supertrend indicator since August, a pattern that signals a sustained downward trend under conventional technical analysis.
Featured image from Pexels, chart from TradingView


 English (US) ·