
 3 weeks ago
31
3 weeks ago
31
- SUI is trading near $1.04 after gaining about 5.6% in the past 24 hours
- Strong support around $1.00 is helping sustain the current uptrend
- Analysts see potential resistance between $1.08 and $1.12 if buying continues
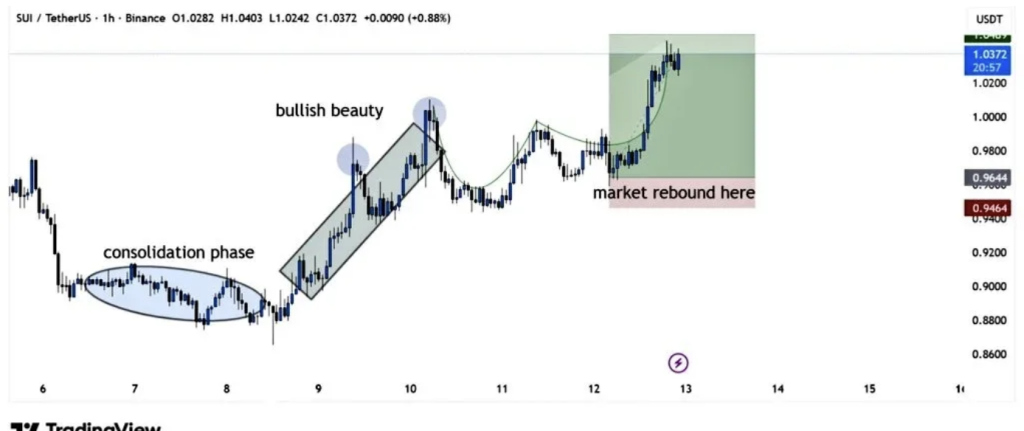
SUI is starting to show signs of renewed momentum after spending some time moving sideways. The token recently broke out of its consolidation range and appears to be slowly rebuilding an upward trend. What’s interesting is that the price is holding above an important support level — a sign that buyers may be stepping in more aggressively than before.
At the time of writing, SUI was trading near $1.04, gaining about 5.6% over the past 24 hours. Trading activity has also picked up. Daily volume climbed to roughly $911 million, while the project’s market capitalization sits around $4.06 billion according to CoinMarketCap data.
Those numbers don’t guarantee a rally, of course. But they do suggest the market is paying attention again.
Strong Support Around the $1.00 Level
According to crypto analyst BitGuru, SUI’s recent price structure indicates that the market may be transitioning from sideways movement back into a more defined uptrend.
One detail he pointed out is particularly important — the token’s ability to stay above the $1.00 level. In technical terms, round-number levels like this often act as psychological support zones where buyers tend to step in.
So far, that level has held.
BitGuru noted that as long as SUI remains above this threshold, demand appears strong enough to support the current structure. If buying pressure continues building, the token could attempt a move toward the next resistance area.
That zone sits roughly between $1.08 and $1.12.
Momentum Indicators Begin Turning Positive
Technical indicators are also starting to tilt slightly in favor of the bulls.
The Relative Strength Index has climbed to around 58.19 after previously sitting near lower levels. Importantly, it moved above its signal line around 45, which usually indicates that buying pressure is gradually returning to the market.
It’s not overbought yet — not even close — which leaves room for further upside if momentum continues.
SUI is also trading above its 20-day moving average, currently near $0.93. The price has even begun testing its 50-day moving average around $1.03, a level that traders often watch when evaluating short-term trend shifts.
Longer-Term Resistance Still Looms
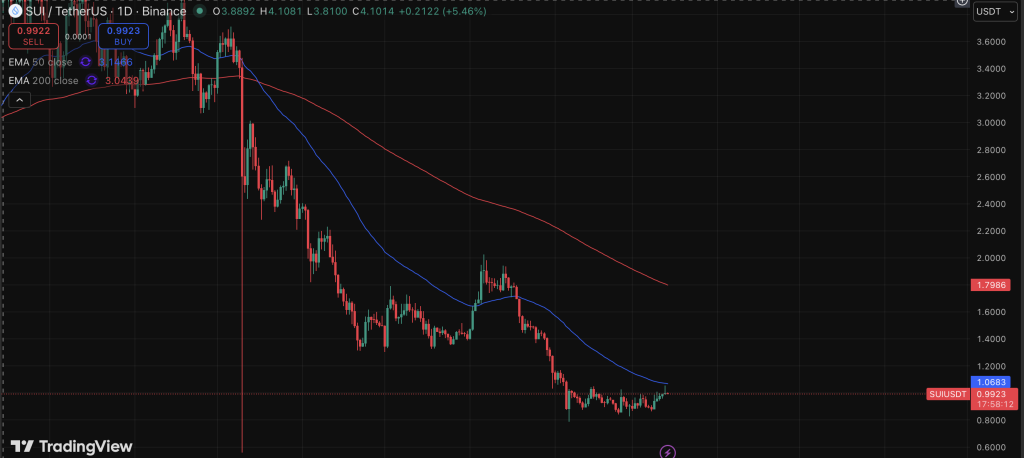
Even with the improving signals, the longer-term chart still shows resistance overhead.
The 100-day moving average sits much higher near $1.31, while the 200-day moving average is positioned even further up around $2.01. Those levels represent larger structural barriers that the market would need to overcome before confirming a stronger long-term trend reversal.
For now, SUI appears to be in the early stages of recovery rather than a full breakout cycle.
MACD Shows Early Momentum Shift
The MACD indicator is also beginning to show signs of life. The MACD line currently sits near 0.024 while the signal line remains lower around -0.013.
Meanwhile, the histogram has turned positive at roughly 0.037, suggesting that bullish momentum is slowly building after the previous downtrend.
It’s a gradual shift rather than an explosive one. Still, momentum often begins quietly before accelerating.
Buyers Eye the Next Resistance Zone
As long as SUI continues to hold above the $1.00 support level, analysts believe the next area to watch sits between $1.08 and $1.12.
Whether the token reaches that range will depend largely on buying activity in the coming sessions. If volume remains strong and buyers keep defending support, the move could happen fairly quickly.
But if demand fades, SUI may simply return to consolidation.
Crypto markets tend to move in bursts like that — quiet stretches followed by sudden volatility.
Disclaimer: BlockNews provides independent reporting on crypto, blockchain, and digital finance. All content is for informational purposes only and does not constitute financial advice. Readers should do their own research before making investment decisions. Some articles may use AI tools to assist in drafting, but every piece is reviewed and edited by our editorial team of experienced crypto writers and analysts before publication.


 English (US) ·