
 8 months ago
72
8 months ago
72
- SUI Shows Early Signs of Recovery: Market cap climbs to $10.5B, but the token is still recovering from a 26% monthly decline.
- Key Indicators Give Mixed Signals: CMF (-0.06) is rising, suggesting weakening selling pressure, while Ichimoku Cloud and EMA setups remain cautious.
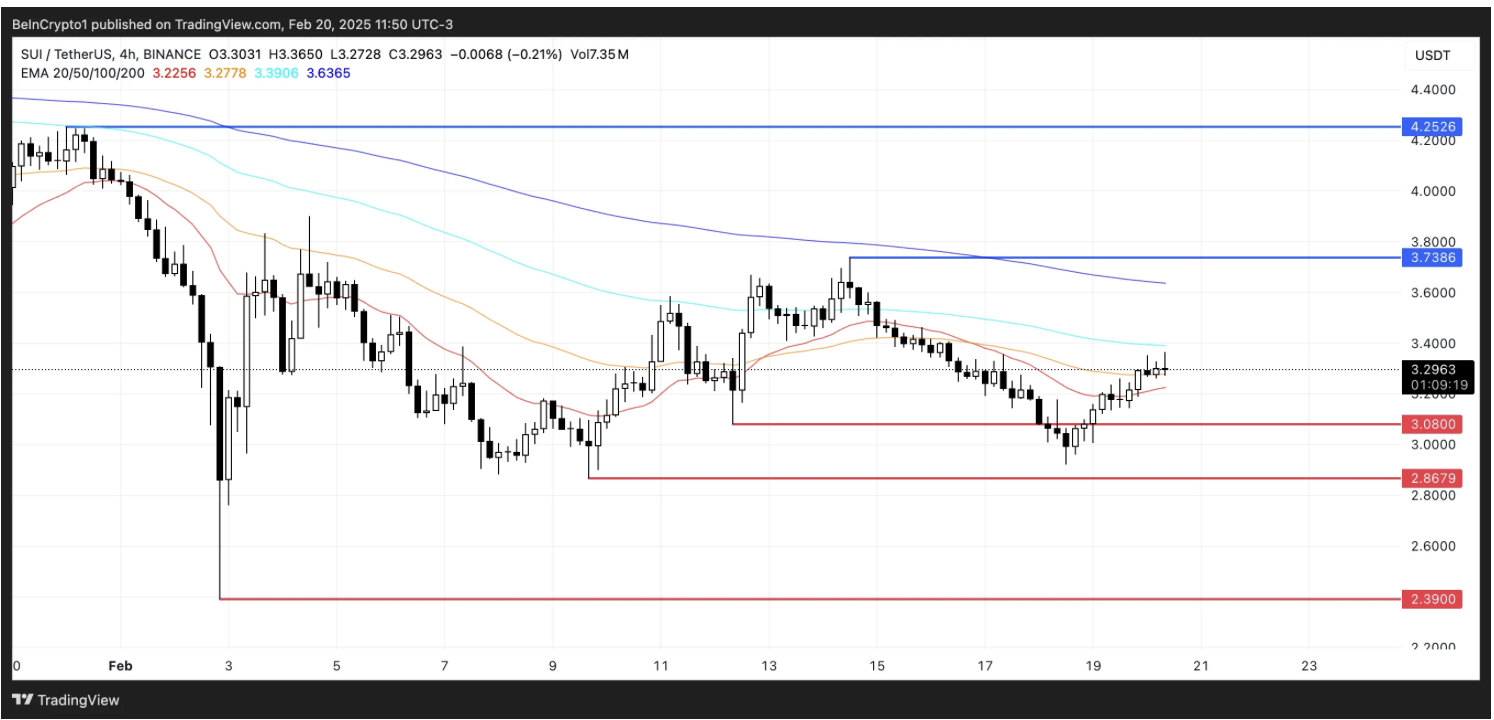
- Critical Levels to Watch: A break above $3.73 could trigger a rally toward $4.25, but failure to sustain momentum may lead to a drop toward $2.39.
SUI has seen a slight rebound, pushing its market cap to $10.5 billion. But despite this short-term uptick, it’s still recovering from a 26% decline over the past month. Technical indicators remain mixed, with CMF showing signs of recovery, while EMA and Ichimoku Cloud suggest caution.
CMF Still Negative, But Showing Strength
SUI’s Chaikin Money Flow (CMF) currently sits at -0.06, bouncing back from -0.35 just two days ago. While still in negative territory, this signals that selling pressure is easing and buyers are slowly stepping in.
- A rising CMF suggests buyers are gaining confidence, though outflows still outweigh inflows.
- If CMF crosses into positive territory, it could confirm a shift toward bullish momentum.
- However, if CMF turns back downward, bearish sentiment could take over again.
At this stage, SUI still leans bearish, but the weakening selling pressure hints at a potential trend shift.
Ichimoku Cloud Signals Uncertainty
The Ichimoku Cloud offers a mixed outlook, pointing toward consolidation with slight bullish momentum.
- Leading Span A (green) is above Leading Span B (orange) → A slight bullish signal.
- However, SUI is still trading inside the cloud, meaning no clear trend direction yet.
- Tenkan-sen (purple) remains below Kijun-sen (orange), indicating bearish momentum—but the gap is narrowing.
A bullish crossover could form if SUI continues to climb, reinforcing buying pressure. However, if it drops below the cloud, bearish pressure could take over again.
SUI Price Outlook—Can It Reclaim $4?
SUI’s EMA setup remains bearish, with short-term EMAs still trailing long-term EMAs. However, early signs suggest momentum may be shifting.
- If short-term EMAs cross above long-term EMAs, a golden cross could form, setting the stage for a push toward $3.73 resistance.
- A break past $3.73 could open the door for $4.25, marking a major breakout—its highest level since late January.
- Failing to break resistance? SUI could retest support at $3.08 and $2.86.
- A drop below these levels could send it as low as $2.39, extending the downtrend.
Final Thoughts
- SUI is showing early signs of recovery, but buying pressure needs to increase.
- Breaking above $3.73 could trigger a strong rally toward $4.25.
- If momentum fades, SUI risks slipping back to key support levels.
The next few days will be critical—will SUI break out, or is another drop coming? Traders, stay alert.


 English (US) ·