
 3 weeks ago
47
3 weeks ago
47
TLDR
- SUI price fell 3.11% to $0.6552 after losing the $0.67 support level.
- The $0.642-$0.65 zone is now the key area traders are watching.
- Analyst BitGuru flagged the breakdown from $0.67 to $0.65 on August 18.
- Bollinger Bands and MACD both point to ongoing bearish momentum.
- A reclaim of $0.67 could open the door to $0.68-$0.69 and $0.70.
SUI is under pressure after failing to hold above $0.67, a level that had acted as support for the token in recent sessions.
At the time of writing, SUI trades at around $0.6556. That marks a drop of 3.11% over the past 24 hours.
Daily trading volume sits near $375.06 million. Market capitalization is close to $2.67 billion.
Crypto analyst BitGuru shared this development on August 18. The post noted that SUI failed to hold its accumulation zone at $0.67 and slipped down to $0.65.
BitGuru’s post pointed to the $0.642-$0.65 range as the next area to watch. This zone could decide whether SUI stabilizes or falls further.
$SUI just lost its accumulation support around $0.67 and dropped toward $0.65. I’m watching the $0.642–$0.65 area now; if buyers defend it, a rebound toward $0.68–$0.69 could follow, while losing $0.642 could open the way toward $0.62. pic.twitter.com/CrsdFQrCEm
— BitGuru  (@bitgu_ru) August 18, 2026
Support Zone Now in Focus
If buyers step in around $0.642-$0.65, SUI could attempt a bounce back toward $0.68-$0.69.
A move back above $0.67 would suggest the recent breakdown was short-lived. That would put the $0.68-$0.69 area back in play.
The downside case is also on the table. A drop below $0.642 without a quick recovery could send SUI toward $0.62 next.
Technical Indicators Show Weakness
SUI currently trades below its lower Bollinger Band, which sits at $0.66254.
The middle band is at $0.68181. The upper band is at $0.70107.
Trading below the lower band points to continued selling pressure and weak price strength.
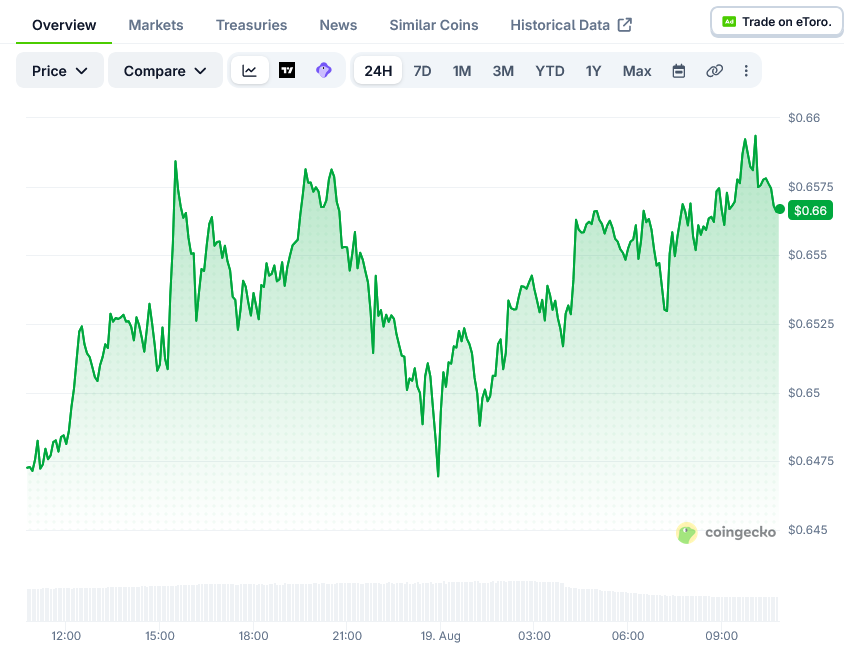 Sui Price on CoinGecko
The MACD line is at -0.01232, sitting below the signal line at -0.01188. The histogram reads -0.00043.
This keeps the MACD in negative territory. It suggests bearish momentum remains in place for now.
The coming sessions will matter for SUI’s next move. The $0.642-$0.65 zone is the first area to watch for a reaction.
If buyers show up there, SUI could push back above $0.67 and test $0.68-$0.69, followed by the upper Bollinger Band near $0.70.
If selling continues below $0.642, the next level in view is $0.62.
As of August 18 at 11:59 PM, SUI remains below $0.67, with the $0.642-$0.65 zone acting as the line for the next directional move.
The post SUI (SUI) Price: Drops Below $0.67 Support as Analysts Eye $0.642 Level appeared first on Blockonomi.



 English (US) ·