
 3 hours ago
18
3 hours ago
18

Tempus AI, Inc. stock surged to 72.69 on August 21 after a reported 75% rally. The market views its acquisition of Personalis‘ cancer monitoring tests as a strategic win. The stock now trades well above every major trend reference, with indicators reflecting significant extension.
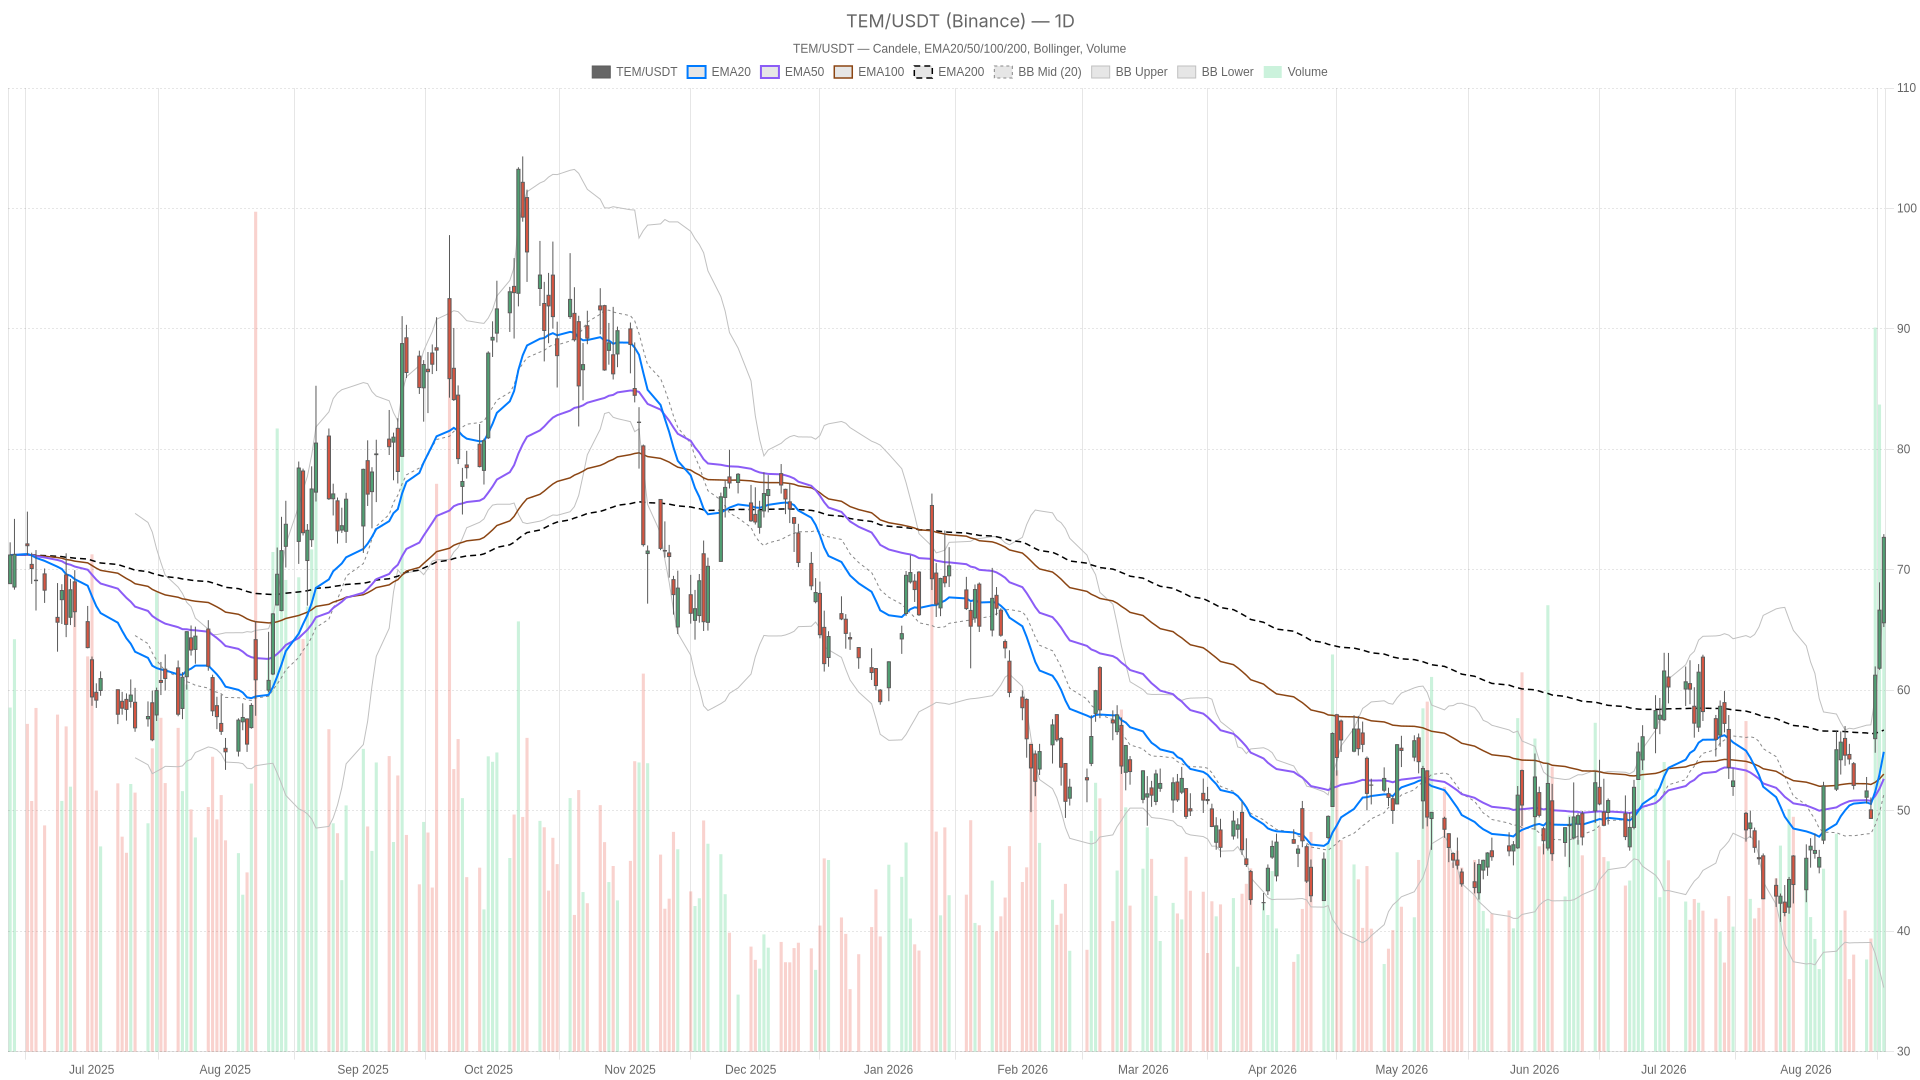 TEM — daily chart with candlesticks, EMA20/EMA50 and volume.
Key takeaways
- TEM closed at 72.69 on August 21, above its daily upper Bollinger Band at 67.37 — a statistical outlier.
- The daily RSI14 reached 75.09 and the hourly RSI14 hit 82.38, both deep in overbought territory.
- The acquisition of Personalis‘ cancer monitoring tests is driving the rally, framed as a strategic AI precision medicine play.
- Insider sales were procedural — tied to Rule 10b5-1 plans or RSU tax withholding — not conviction-based selling.
- The 15-minute chart already shows momentum cooling, with a negative MACD histogram, signaling a possible near-term pause.
Daily Trend: Tempus AI, Inc. Stock Breaks Above Its Own Bollinger Band
On the daily chart, the bias is unambiguously bullish — but bullish in a way that eventually invites caution. Price closed at 72.69, far above the EMA20 (54.89), EMA50 (52.65) and EMA200 (56.70). That kind of separation between price and its moving averages is rare. It signals a trend that has moved very fast, very recently. The daily RSI14 at 75.09 confirms the strength of the move. However, it also sits deep in overbought territory — a zone where sharp reversals or pauses tend to originate.
Further supporting the bullish case, the MACD line stands at 3.48 against a signal of 1.11, with a histogram of 2.37. This unusually wide spread reflects powerful upside momentum. However, Bollinger Bands tell the more striking part of the story. With the mid-band at 51.34 and the upper band at 67.37, Tuesday’s close landed above the upper band entirely. That is not a routine breakout — it is a statistical outlier. Such moves rarely extend in a straight line without consolidation. The ATR14 at 4.38 confirms that daily volatility has expanded sharply alongside the rally.
Meanwhile, pivot levels reinforce the idea that the market is now probing new territory. The daily pivot sits at 70.30, with resistance (R1) at 75.35 and support (S1) at 67.64. Price is currently trading above the pivot and approaching R1, which puts the next test of the uptrend squarely at that resistance band.
1H Timeframe: Momentum Confirms, But Deceleration Is Visible
Notably, the hourly chart confirms the daily bullish structure. EMA20 (66.39), EMA50 (60.35) and EMA200 (53.53) are all stacked in bullish order. Price at 72.71 is trading above all three. That alignment is a textbook uptrend signature. The regime reading is labeled bullish, matching the daily bias and removing any contradiction between timeframes.
At the same time, the 1H RSI14 of 82.38 is even more extreme than the daily reading. That level of overbought pressure rarely persists for long without at least a shallow pullback. Notably, the MACD histogram on the hourly chart has narrowed to just 0.36, down from a wider spread. The MACD line (4.50) remains above the signal (4.14). This shrinking histogram suggests momentum, while still positive, is decelerating. The trend is intact, but the pace of the advance is starting to cool.
Meanwhile, Bollinger Bands on the 1H frame show price at 72.71 versus an upper band of 75.59. TEM has not yet breached its hourly extremes the way it did on the daily chart. Pivot levels are tight here too, with the pivot at 72.61, R1 at 73.02 and S1 at 72.30. This narrow structure implies the stock is consolidating right at a decision point after the initial thrust.
15-Minute View: Execution Context Shows Early Signs of Stalling
On the 15-minute chart, used strictly for short-term timing, the picture becomes more nuanced. EMA20 (71.40), EMA50 (68.48) and EMA200 (59.77) remain bullish in structure, and the regime is still tagged bullish. However, the MACD histogram has turned negative at -0.14, with the MACD line (1.17) now sitting just below the signal (1.31). RSI14 has also eased to 68.01, still elevated but no longer at extreme levels.
This is a meaningful nuance. While the higher timeframes remain firmly bullish, the 15-minute momentum is cooling first. This is typical ahead of a pause or shallow retracement within a larger uptrend. Price is hovering at the 15m pivot of 72.73, between S1 (72.53) and R1 (72.91). This tight range reflects hesitation after the initial breakout surge.
News Flow: Acquisition Driving the Narrative, Insider Sales Are Procedural
On the fundamental side, the backdrop aligns with the technical strength. Coverage from Seeking Alpha frames the Personalis cancer monitoring acquisition as a timely, strategic move. It reinforces Tempus AI’s positioning in AI-driven precision medicine. Motley Fool coverage echoes that this deal is a key driver behind the week’s rally.
Separately, several insider transactions have surfaced, including sales by a director, the legal chief and the accounting chief. Importantly, these were described as pre-established Rule 10b5-1 plans or non-discretionary sales linked to RSU vesting and tax withholding. They were not open-market conviction bets against the stock. Therefore, these filings should not be read as a bearish signal. Still, they warrant monitoring given the size and timing of the rally.
Bullish Scenario
The bullish case rests on trend continuation. If TEM stock holds above the 1H pivot near 72.61 and defends support around 72.30, the path of least resistance stays upward. A daily close above R1 at 75.35 would confirm the breakout was not a one-off extension. It would mark the start of a new higher range. Continued volume and sustained interest tied to the acquisition narrative would support this outcome. Stabilization of RSI readings without a sharp downside reversal would also help.
Bearish Scenario
On the other hand, the bearish risk is a mean-reversion move triggered by how stretched the daily chart has become. A stock trading above its own upper Bollinger band is vulnerable to a sharp pullback — even within an intact uptrend. This is especially true with RSI above 75 on the daily and above 82 on the hourly. A break below the daily pivot at 70.30 would signal fading momentum. A move under S1 at 67.64 would confirm it. In that scenario, price could retest the daily EMA20 near 54.89 or the Bollinger mid-band at 51.34. That would materially change the near-term structure and invalidate the immediate bullish thesis.
Closing Thoughts
Overall, Tempus AI, Inc. stock is in a rare position. It is strongly bullish on trend structure across the daily and hourly charts. Yet it is stretched to a degree that increases the odds of near-term volatility.
In contrast, the 15-minute chart already shows early signs of stalling — a detail worth watching for anyone timing entries or exits.
Therefore, elevated ATR readings and the scale of the recent rally make position sizing and volatility awareness critical.
Still, the broader trend remains intact for now. However, extreme RSI levels and a daily close beyond the upper Bollinger band mean uncertainty around the next move is elevated, not reduced.
FAQ
Is Tempus AI, Inc. stock overbought after the August 21 surge?
Yes. The daily RSI14 reached 75.09 and the hourly RSI14 hit 82.38, both deep in overbought territory. The stock also closed above its daily upper Bollinger Band at 67.37, a statistical outlier that signals significant extension.
What is driving the rally in TEM stock?
The primary catalyst is the market’s positive reaction to Tempus AI’s acquisition of Personalis’ cancer monitoring tests. Coverage from Seeking Alpha and Motley Fool frames this as a strategic win reinforcing Tempus AI’s AI-driven precision medicine platform.
Are insider sales a concern for TEM stock?
Not in this case. Recent insider sales were tied to pre-established Rule 10b5-1 plans or non-discretionary RSU vesting and tax withholding. They do not represent conviction-based bets against the stock, though they warrant monitoring given the rally’s size.
What are the key levels to watch for Tempus AI, Inc. stock?
On the upside, R1 at 75.35 is the immediate resistance. On the downside, the daily pivot at 70.30 serves as initial support, with S1 at 67.64 as the next key level. A break below S1 could open a path toward the daily EMA20 near 54.89.
Disclaimer: This article is for informational purposes only and does not constitute financial advice, an investment recommendation, or a solicitation to buy or sell any financial instrument or cryptocurrency. The analysis provided is not indicative of future results. Investing in crypto assets and financial markets carries a high risk of capital loss. Always do your own research (DYOR) and consult a qualified financial advisor before making any decision.
Article produced with the assistance of artificial intelligence and reviewed by the editorial team.






 English (US) ·