
 4 weeks ago
57
4 weeks ago
57

Tesla stock closed at $394.46 on July 15, slipping below its EMA20 and EMA50 — a quiet but meaningful shift toward sellers. The daily regime is neutral yet leans bearish. Heading into Q2 earnings, analysts are divided on whether record deliveries justify the valuation.
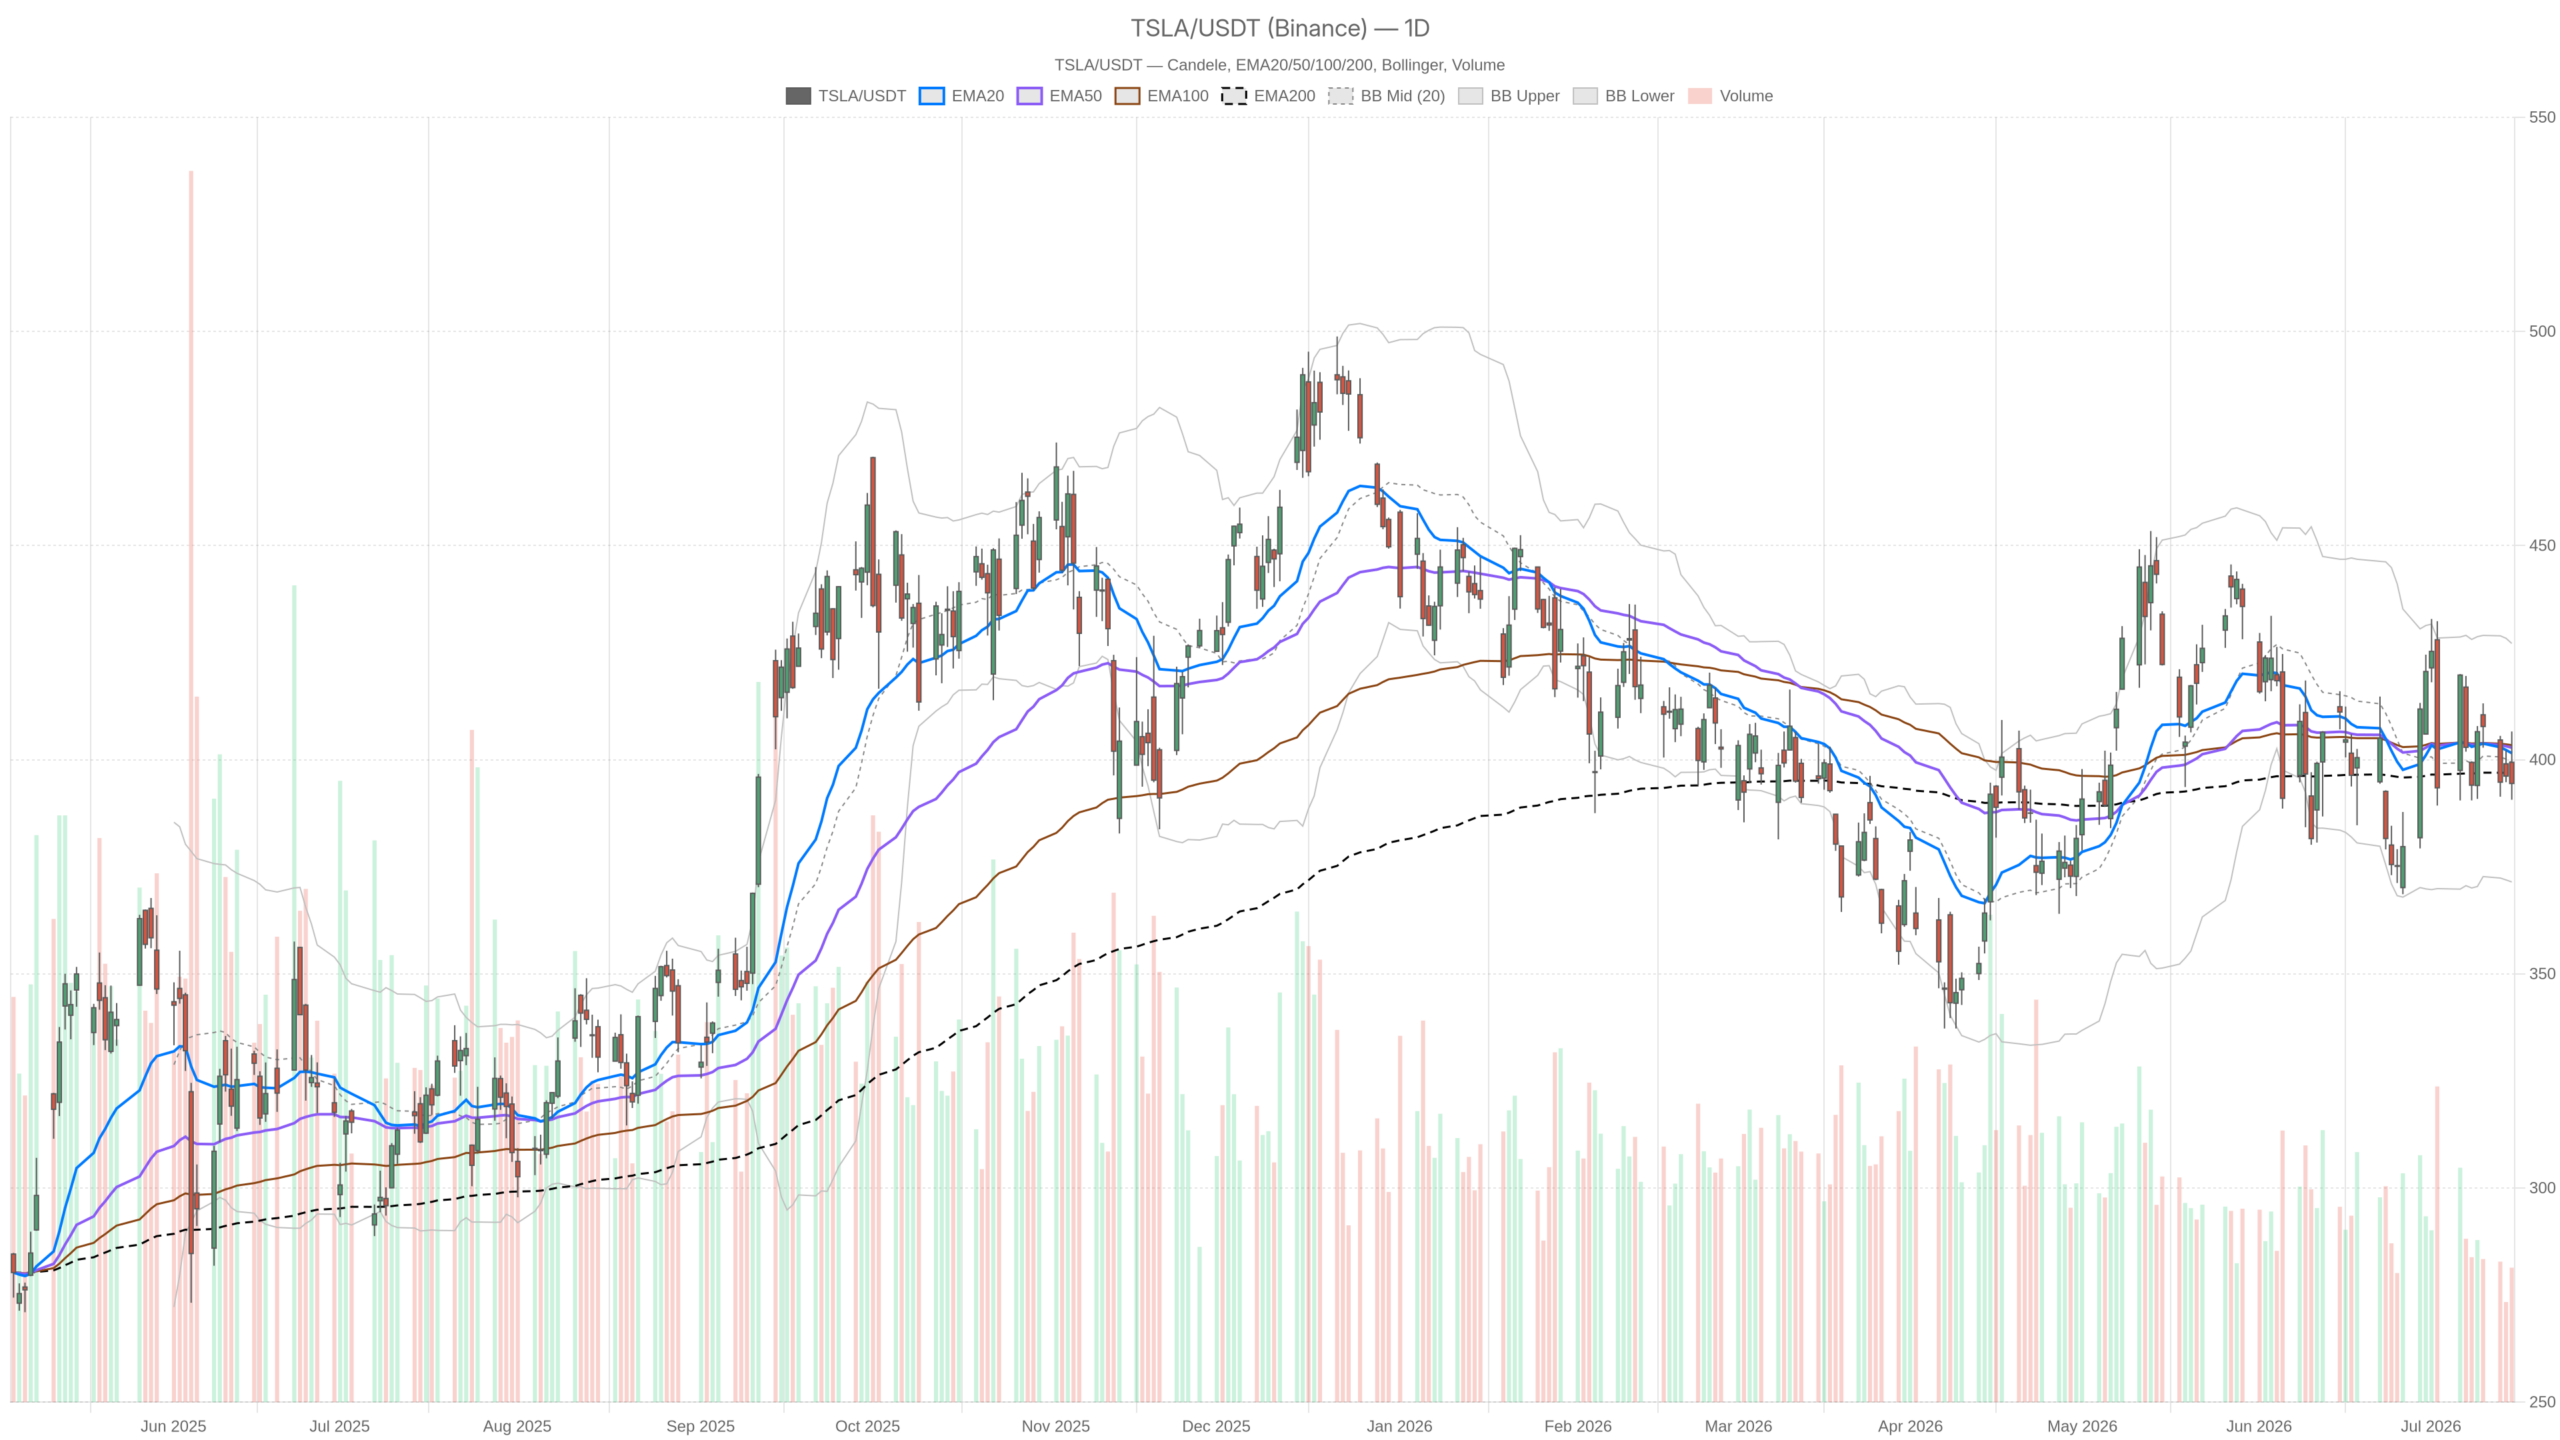 TSLA — daily chart with candlesticks, EMA20/EMA50 and volume.
Key takeaways
- Tesla stock closed at $394.46 on July 15, below the EMA20 ($401.53) and EMA50 ($402.81), with the EMA200 at $396.93 providing the last line of daily trend support.
- The daily RSI sits at 47.14 with a negative MACD, while the hourly and 15-minute charts both register a bearish regime — though no washout has occurred.
- Q2 deliveries reportedly hit records alongside surging energy storage, but analysts flag lower ASPs, AI-related capex, and negative free cash flow risk as offsetting concerns.
- Wells Fargo maintains a $130 price target on Tesla stock — implying 67% downside — while Jefferies passed over TSLA in favor of Amazon as its top Magnificent 7 pick ahead of earnings.
- The daily ATR of $18.88 signals nearly $19 in typical daily swings, making positioning around the upcoming Q2 earnings print highly volatile and binary.
Daily Timeframe: Tesla Stock Under Pressure at Key Moving Averages
Tesla stock is under active pressure on the daily chart, trading below both the EMA20 and EMA50 while finding only thin support at the EMA200 at $396.93. The stock has not decisively broken beneath long-term trend support, which keeps the daily picture from turning outright bearish. However, the averages now function as resistance rather than support.
Momentum Indicators Confirm the Weakness
The daily RSI at 47.14 reinforces the neutral-to-weak read. It is neither oversold nor showing recovery momentum. The daily MACD tells a more pointed story. The line at -1.76 sits below the signal at -1.35, with the histogram extended to -0.41. The bearish divergence is mild but consistent, confirming that buying pressure has not yet returned in any meaningful way.
Volatility Context and Pivot Structure
Bollinger Bands place the midline at $399.31, with price sitting below it. The upper band at $427.15 and lower band at $371.46 define a wide volatility range. Meanwhile, the ATR of 18.88 confirms this is not a quiet stock. Daily swings of nearly $19 are the norm — a fact that matters significantly for positioning around earnings.
Daily pivot analysis places the pivot point at $397.24, with resistance at $403.81 and support at $387.88. Notably, Tuesday’s session tested the upper range, hitting a high of $406.59 before retreating sharply to close at $394.46. That rejection near R1 suggests sellers are active at elevated levels. The stock failed to hold any intraday gains.
Hourly Structure Confirms Bearish Lean
The hourly chart confirms a bearish alignment across all three key EMAs. TSLA closed the 15:30 UTC candle at $394.19, trading below the EMA20 at $396.84, the EMA50 at $399.34, and the EMA200 at $404.87. Price is stacked beneath a declining series of averages — confirming downside pressure rather than merely suggesting it.
The hourly RSI at 42.77 hovers in weak territory without reaching oversold levels. That nuance matters. There is no washout, no panic — just a slow grind lower that lacks the conviction of a clean capitulation. However, the hourly MACD offers the session’s sole constructive signal. The histogram sits at +0.05, meaning the MACD line (-1.65) has fractionally crossed above the signal line (-1.70). This micro-positive cross is not a reversal signal on its own, but it does indicate the hourly selloff is momentarily losing steam.
Hourly Bollinger Bands are tight, with the midline at $395.58 and the upper band at $399.45. Price trading below the midline and well inside the bands suggests no explosive move is imminent in either direction. The hourly ATR of 4.44 reflects modest intraday volatility, consistent with a market in a holding pattern ahead of a catalyst.
15-Minute View: Execution Context Remains Soft
The 15-minute chart mirrors the hourly bearish structure. Price at $394.19 sits below the EMA20 ($395.63), EMA50 ($396.36), and EMA200 ($400.24). The stacked bearish EMA alignment confirms the same downside pressure seen on higher timeframes. The 15m MACD histogram at -0.14 confirms a slight downward drift, with no sign of a near-term base forming.
For execution purposes, the 15m pivot cluster around $394.50 PP and $395.00 R1 marks the immediate overhead friction zone. Any short-term bounce would need to clear these levels convincingly before testing the $396–$397 zone. Meanwhile, support sits at $393.69. A sustained move below this level could invite a test of $390, which aligns with the daily session low.
Fundamental Backdrop: Tesla Stock Faces Polarized Sentiment
Tesla stock faces a sharply divided fundamental debate. Q2 deliveries have reportedly hit records, and energy storage has surged — factors that make an earnings beat plausible. Yet analysts are flagging lower average selling prices, heavy AI-related capital spending, and negative free cash flow risk as significant concerns.
Wells Fargo raised its price target but kept a sell rating, maintaining a target of $130 — implying a 67% downside from current levels. The gap between that bear case and the current share price is stark. Meanwhile, Jefferies named Amazon as its top Magnificent 7 pick ahead of earnings, passing over Tesla and Apple. That kind of institutional ranking carries weight in how portfolio managers position into the print.
In contrast, the bull argument rests on delivery records and energy storage momentum driving a positive earnings surprise. If execution holds up and guidance is constructive, the EMA cluster near $401–$403 becomes the first real recovery target for Tesla stock.
Bullish Scenario: What Tesla Stock Needs to Reverse
A bullish reversal requires Tesla stock to reclaim the $397–$399 daily pivot and midline zone. Beyond that, reclaiming the EMA20 at $401.53 and EMA50 at $402.81 as support — not resistance — would signal a genuine shift in daily structure. A strong Q2 earnings beat, constructive forward guidance on energy storage, and clarity on AI spending could all serve as catalysts. The daily RSI at 47 has room to run toward 60+ before encountering overbought conditions, so momentum support exists if the narrative shifts.
Bearish Scenario: Where Tesla Stock Breaks Down
The bearish case is arguably more technically grounded right now. Failure to reclaim $397 on the daily chart could trigger a move toward the daily S1 at $387.88. A weak or in-line earnings print would compound that risk. The Bollinger lower band at $371.46 represents the next meaningful structural level beneath that. The MACD remains negative on both the daily and 15m charts. With RSI sitting mid-range and no bullish divergence, the path of least resistance stays lower — unless a strong catalyst intervenes. Wells Fargo’s $130 target, while extreme, reflects legitimate concern about valuation compression risk if growth does not accelerate.
Positioning Outlook: Volatility, Uncertainty, and the Earnings Wildcard
Overall, Tesla stock sits in a technically weakened but not yet broken position. The daily regime remains neutral, but the hourly and 15m are both bearish. That multi-timeframe disagreement is itself the story — TSLA is not in freefall, but it is not finding buyers either. The ATR of nearly $19 per day underlines how quickly that can change.
With Q2 earnings approaching and sentiment divided between delivery optimism and valuation skepticism, traders should expect sharp directional moves. The risk is asymmetric and binary around the print. Until then, the technical structure favors caution over conviction.
FAQ
Is Tesla stock in a bullish or bearish trend right now?
The technical picture is mixed. The daily chart is neutral, but the hourly and 15-minute charts are both bearish. Tesla stock trades below its EMA20 ($401.53) and EMA50 ($402.81) on the daily timeframe, with the EMA200 at $396.93 serving as thin support.
What are the key support levels for Tesla stock?
The immediate support is the EMA200 at $396.93. Below that, the daily S1 pivot sits at $387.88, followed by the lower Bollinger Band at $371.46.
What could move Tesla stock after Q2 earnings?
A strong earnings beat with constructive guidance on energy storage and AI spending could push Tesla stock back above the $401–$403 EMA cluster. Conversely, a weak or in-line print could trigger a move toward $387.88 or lower, especially if valuation concerns resurface.
What is Wells Fargo’s outlook on Tesla stock?
Wells Fargo raised its price target but maintained a sell rating on Tesla stock, keeping a $130 target — implying roughly 67% downside from current levels. The bank’s bearish stance reflects valuation compression risk if growth does not accelerate.
Disclaimer: This article is for informational purposes only and does not constitute financial advice, an investment recommendation, or a solicitation to buy or sell any financial instrument or cryptocurrency. The analysis provided is not indicative of future results. Investing in crypto assets and financial markets carries a high risk of capital loss. Always do your own research (DYOR) and consult a qualified financial advisor before making any decision.
Article produced with the assistance of artificial intelligence and reviewed by the editorial team.








 English (US) ·