
 1 month ago
17
1 month ago
17
A brief bullish wave on Tuesday convinced investors that this week’s retrace was temporary and that cryptocurrencies were ready to resume their ballistic rallies. However, a 2.6% drop in Ethereum price in 24 hours seems to be dimming the hope for an immediate U-turn toward all-time highs.
After climbing to $4,091, Ethereum price hovers at $3,430 during US business hours on Tuesday. A 38% drop in the 24-hour trading volume to $19 billion underscores falling interest interest among traders. Another 3% correction in the market cap mirrors a growing bearish outlook.
Ethereum Price Prediction As Futures Open Interest Cascades
Plunging prices over the weekend and early this week left many investors reeling in pain. Liquidations were in millions as Ethereum dived from its recent high to test support at $3,050.
The derivatives market also suffered slightly, dropping from a new record high of $13 billion posted in March to $11.34 billion by March, based on data from Coinglass. Although it had recovered marginally to $11.7 billion, further corrections cannot be ruled out at the moment.
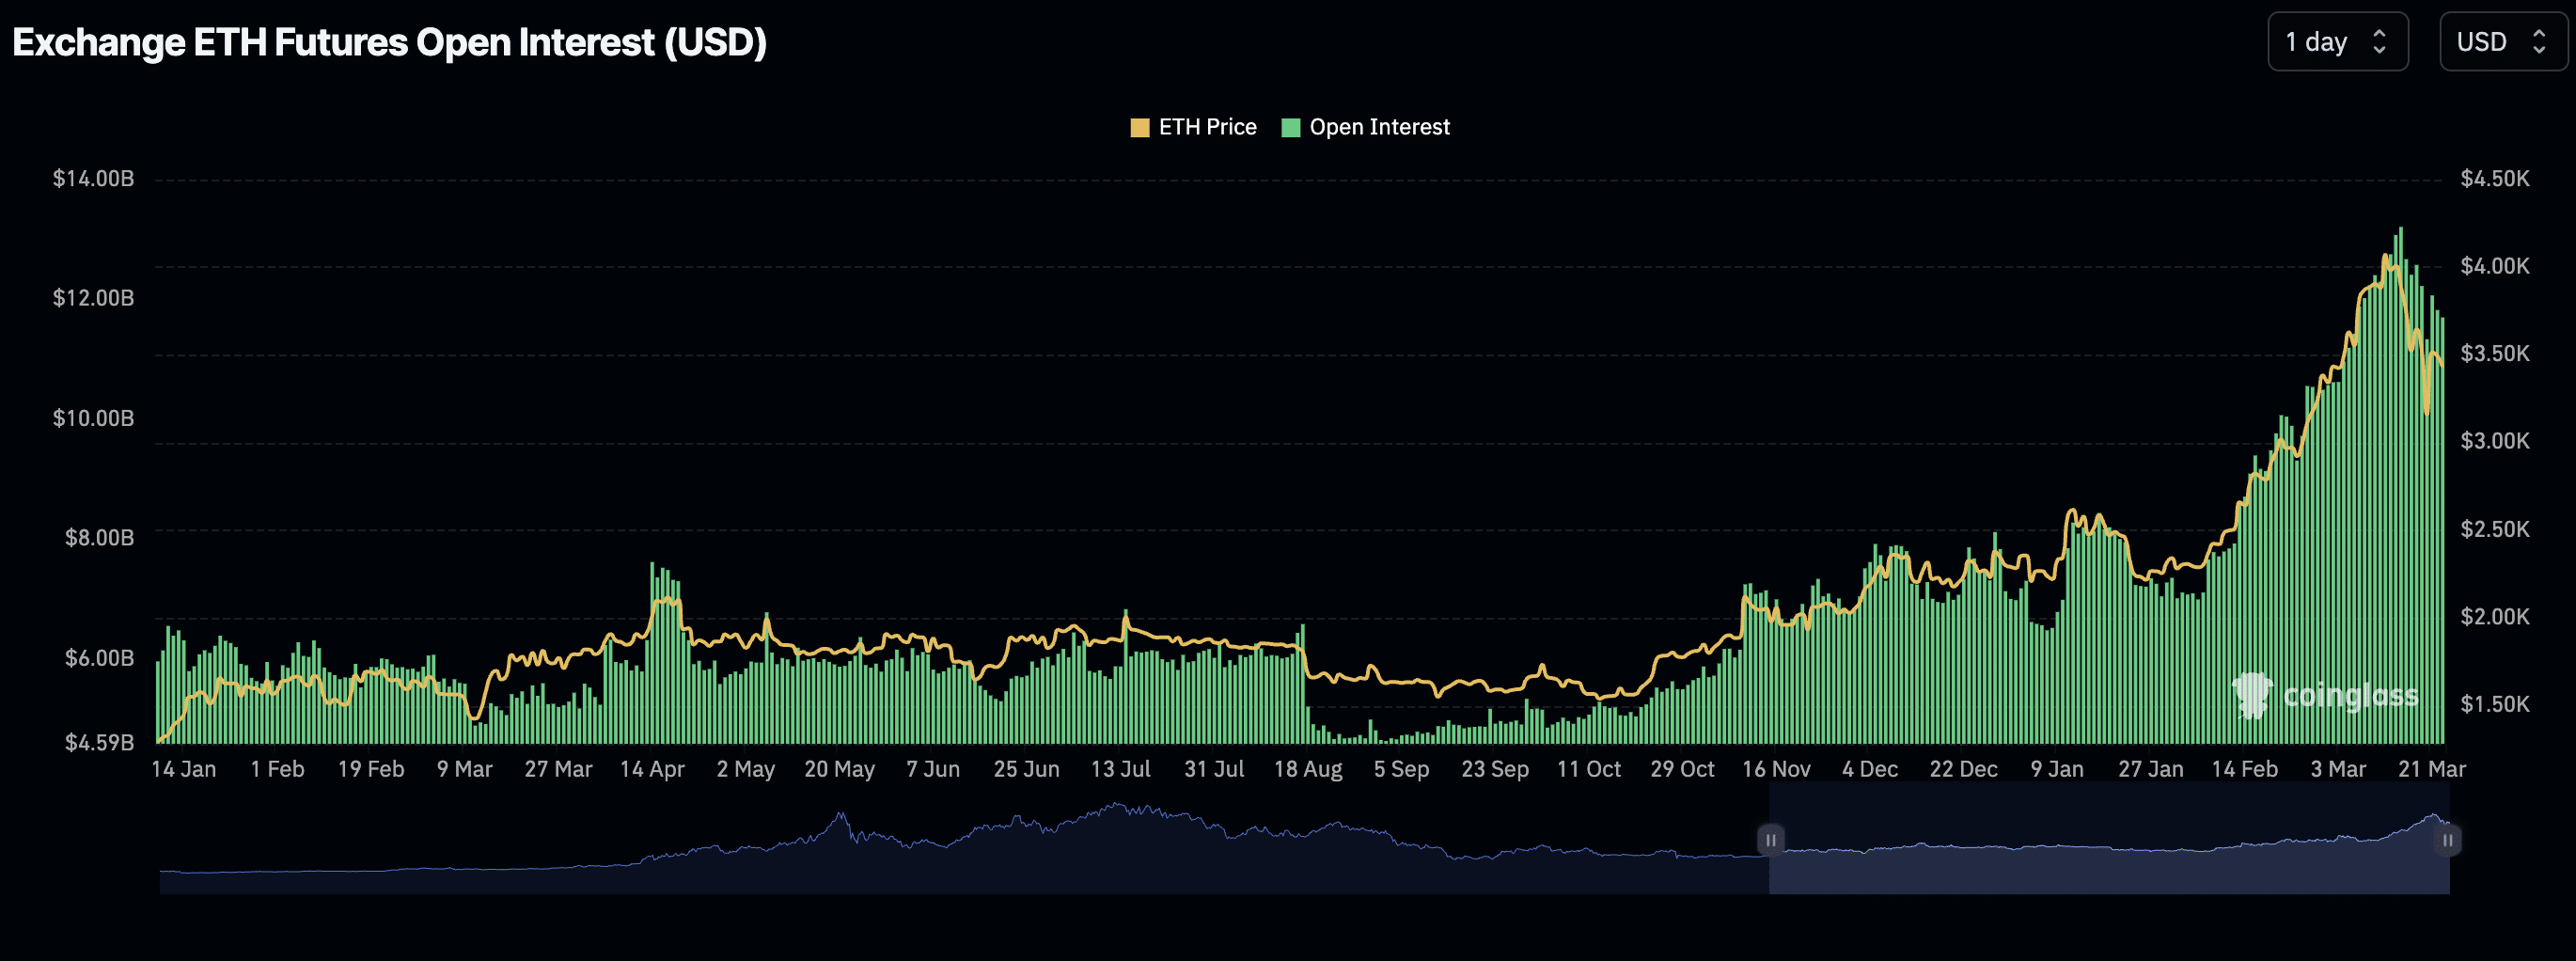 Ethereum Open Interest | Coinglass
A decrease in derivatives markets’ open interest indicates waning trader activity, which may reflect reduced liquidity, reduced confidence in the market, and the potential for shifts in market trends.
According to Defi Llama, the decentralized finance (DeFi) total value locked (TVL) metric which tracks assets in the ecosystem’s smart contracts, is down to $50.63 billion from a recent high of $57.59 billion.
DeFi TVL which also refers to staking tends to add to the selling pressure as it shrinks. This means that investors retract their holdings from staking contracts amid considerations of selling thus causing prices to drop further. It can also be used as a sentiment indicator for the future of the coin.
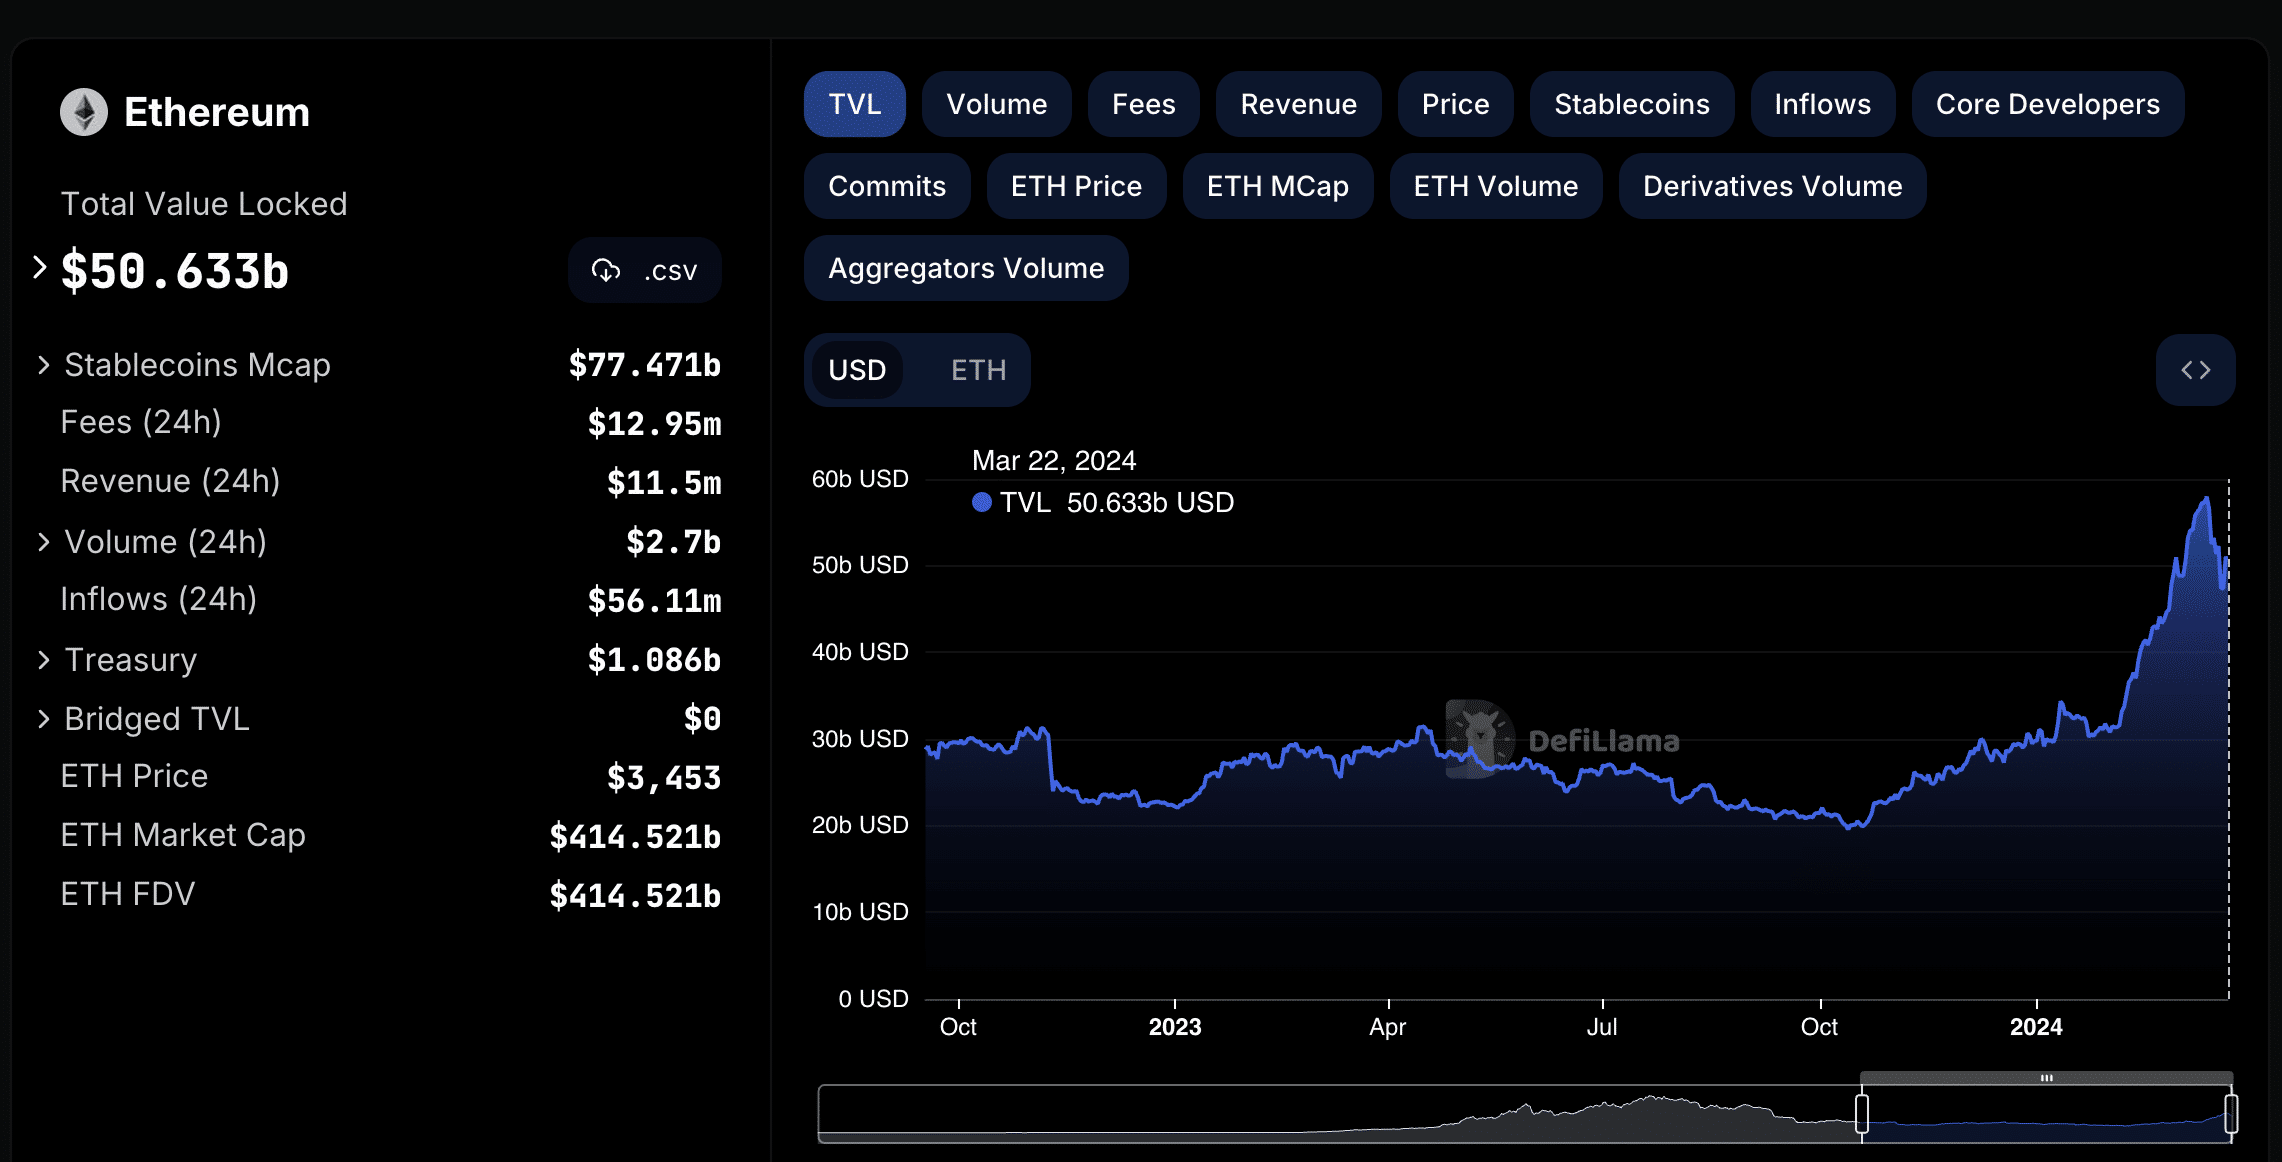 Ethereum DeFi TVL chart | Defi Llama
Navigating A Bearish Ethereum Technical Structure
The recovery witnessed last week made it to $3,640. A correction followed immediately due to the lack of momentum. Investors needed more convincing that Ethereum was finally heading for highs above $4,000 and subsequently to $5,000.
Meanwhile, the 38.2% Fibonacci level holds as support at the time of writing, and ETH is expected to bounce from this level. The Moving Average Convergence Divergence (MACD) indicator although bullish, is beginning to show signs of a retracement towards the neutral area which in the end may encourage traders to short ETH.
 Ethereum price prediction | Tradingview
Due to weakening support levels and strong resistance areas based on blockchain data from IntoTheBlock, Ethereum price may face a difficult time reaching the $4,000 mark in the short term.
 Ethereum IOMAP model | IntoTheBlock
According to the IOMAP model, the region between $3,615 and $3,715 represents the biggest supply where 727,000 addresses purchased 4.22 million ETH at an average price of $3,370.
If ETH manages to recover to this level, investors in this cohort may decide to sell at their breakeven points, dampening the uptrend in the process and possibly triggering another sell-off.
As observed in the IOMAP model, support areas have been weakening which could drastically change the technical structure, resulting in far-reaching losses to $2,400.
The post This Indicator Signals Ethereum Price Downfall To $2,400 appeared first on CoinGape.


 English (US) ·