Aug 14, 2025 at 23:48 // Price
The price of Toncoin (TON) is correcting upwards but remains in a horizontal trend at the bottom of the chart.
Toncoin price long-term forecast: ranging
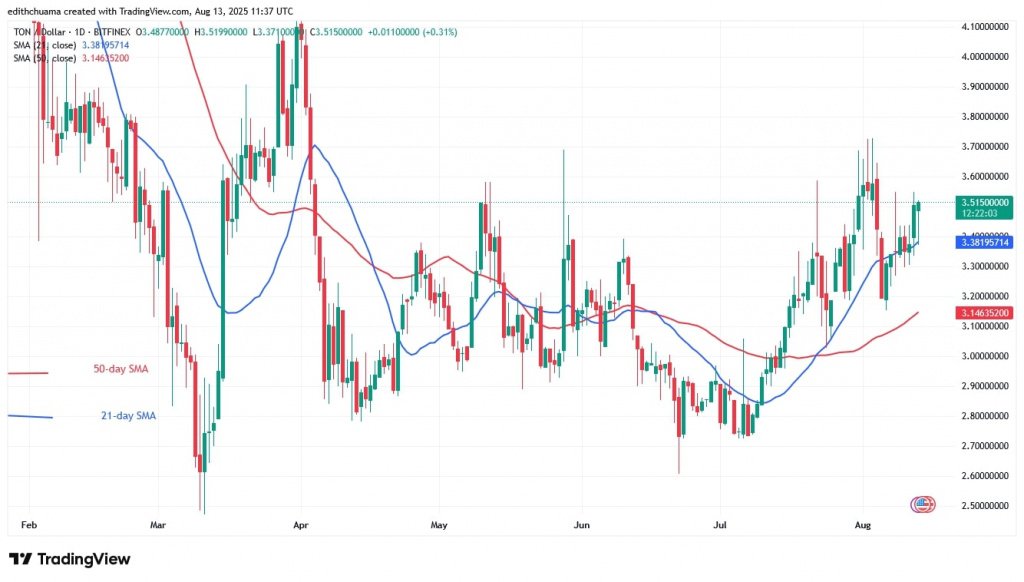
The price of the cryptocurrency is oscillating above the $2.80 support but below the $3.60 resistance level. The price bars are higher than the moving average lines, which is pushing the cryptocurrency higher. Since May, the bullish momentum has been held back by the overhead resistance at $3.60.
Every time the cryptocurrency encounters the aforementioned resistance, it falls below the moving average lines. The bulls will buy the dip and push the price back above the moving average lines.
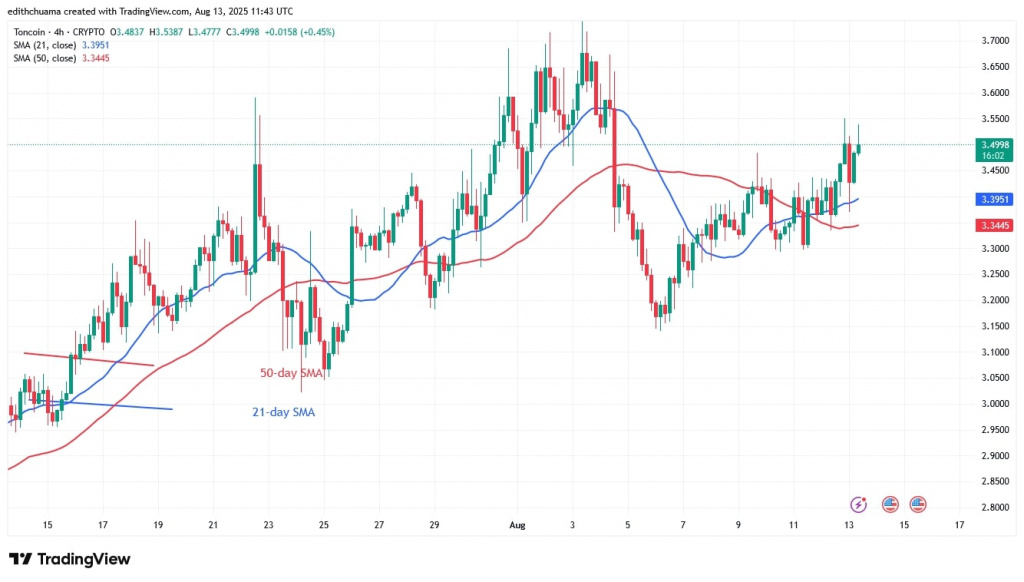
Today, neither the bulls nor the bears have the upper hand. The altcoin is trading slightly above the 21-day SMA after being rejected at the upper resistance level. TON is currently worth $3.47.
Analysing the Toncoin indicators
The price action is characterised by long candlestick wicks at the overhead resistance level of $3.60. This indicates strong selling pressure at the upper resistance level. The moving average lines are horizontal, and point to the trend. The 21-day SMA is above the 50-day SMA, indicating a bullish signal for the cryptocurrency.
Technical Indicators
Key Resistance Zones: $4.00, $4.50, and $5.00
Key Support Zones: $3.50, $3.00, and $2.50

What is the next move for Toncoin?
TON is in an upward correction and is approaching the $3.60 barrier. The upward move faces an initial barrier at the $3.55 high. The cryptocurrency price is retreating after reaching resistance at $3.50. The retracement has paused above the 21-day SMA while the altcoin is fluctuating below the recent high.

Disclaimer. This analysis and forecast are the personal opinions of the author. They are not a recommendation to buy or sell cryptocurrency and should not be viewed as an endorsement by CoinIdol.com. Readers should do their research before investing in funds.

 2 months ago
60


 English (US) ·