
 3 hours ago
10
3 hours ago
10
The improvement in broader market sentiment over the past week has led to an uptick in Toncoin’s (TON) price. The Telegram-linked token is pushing strongly toward its 50-day Simple Moving Average (SMA).
A successful breakout could signal a continuation of the ongoing uptrend and potentially lead to a 20% price surge.
Toncoin Holders Push Toward Resistance
Over the past month, TON’s 50-day SMA, representing its average closing price over the past 50 trading days, has formed a key resistance level at $5.76. Each attempt to cross that level has been met with a spike in selling pressure, which pushed TON’s price back to support formed at its 20-day exponential moving average (EMA) at $5.47.
Read more: What Are Telegram Bot Coins?
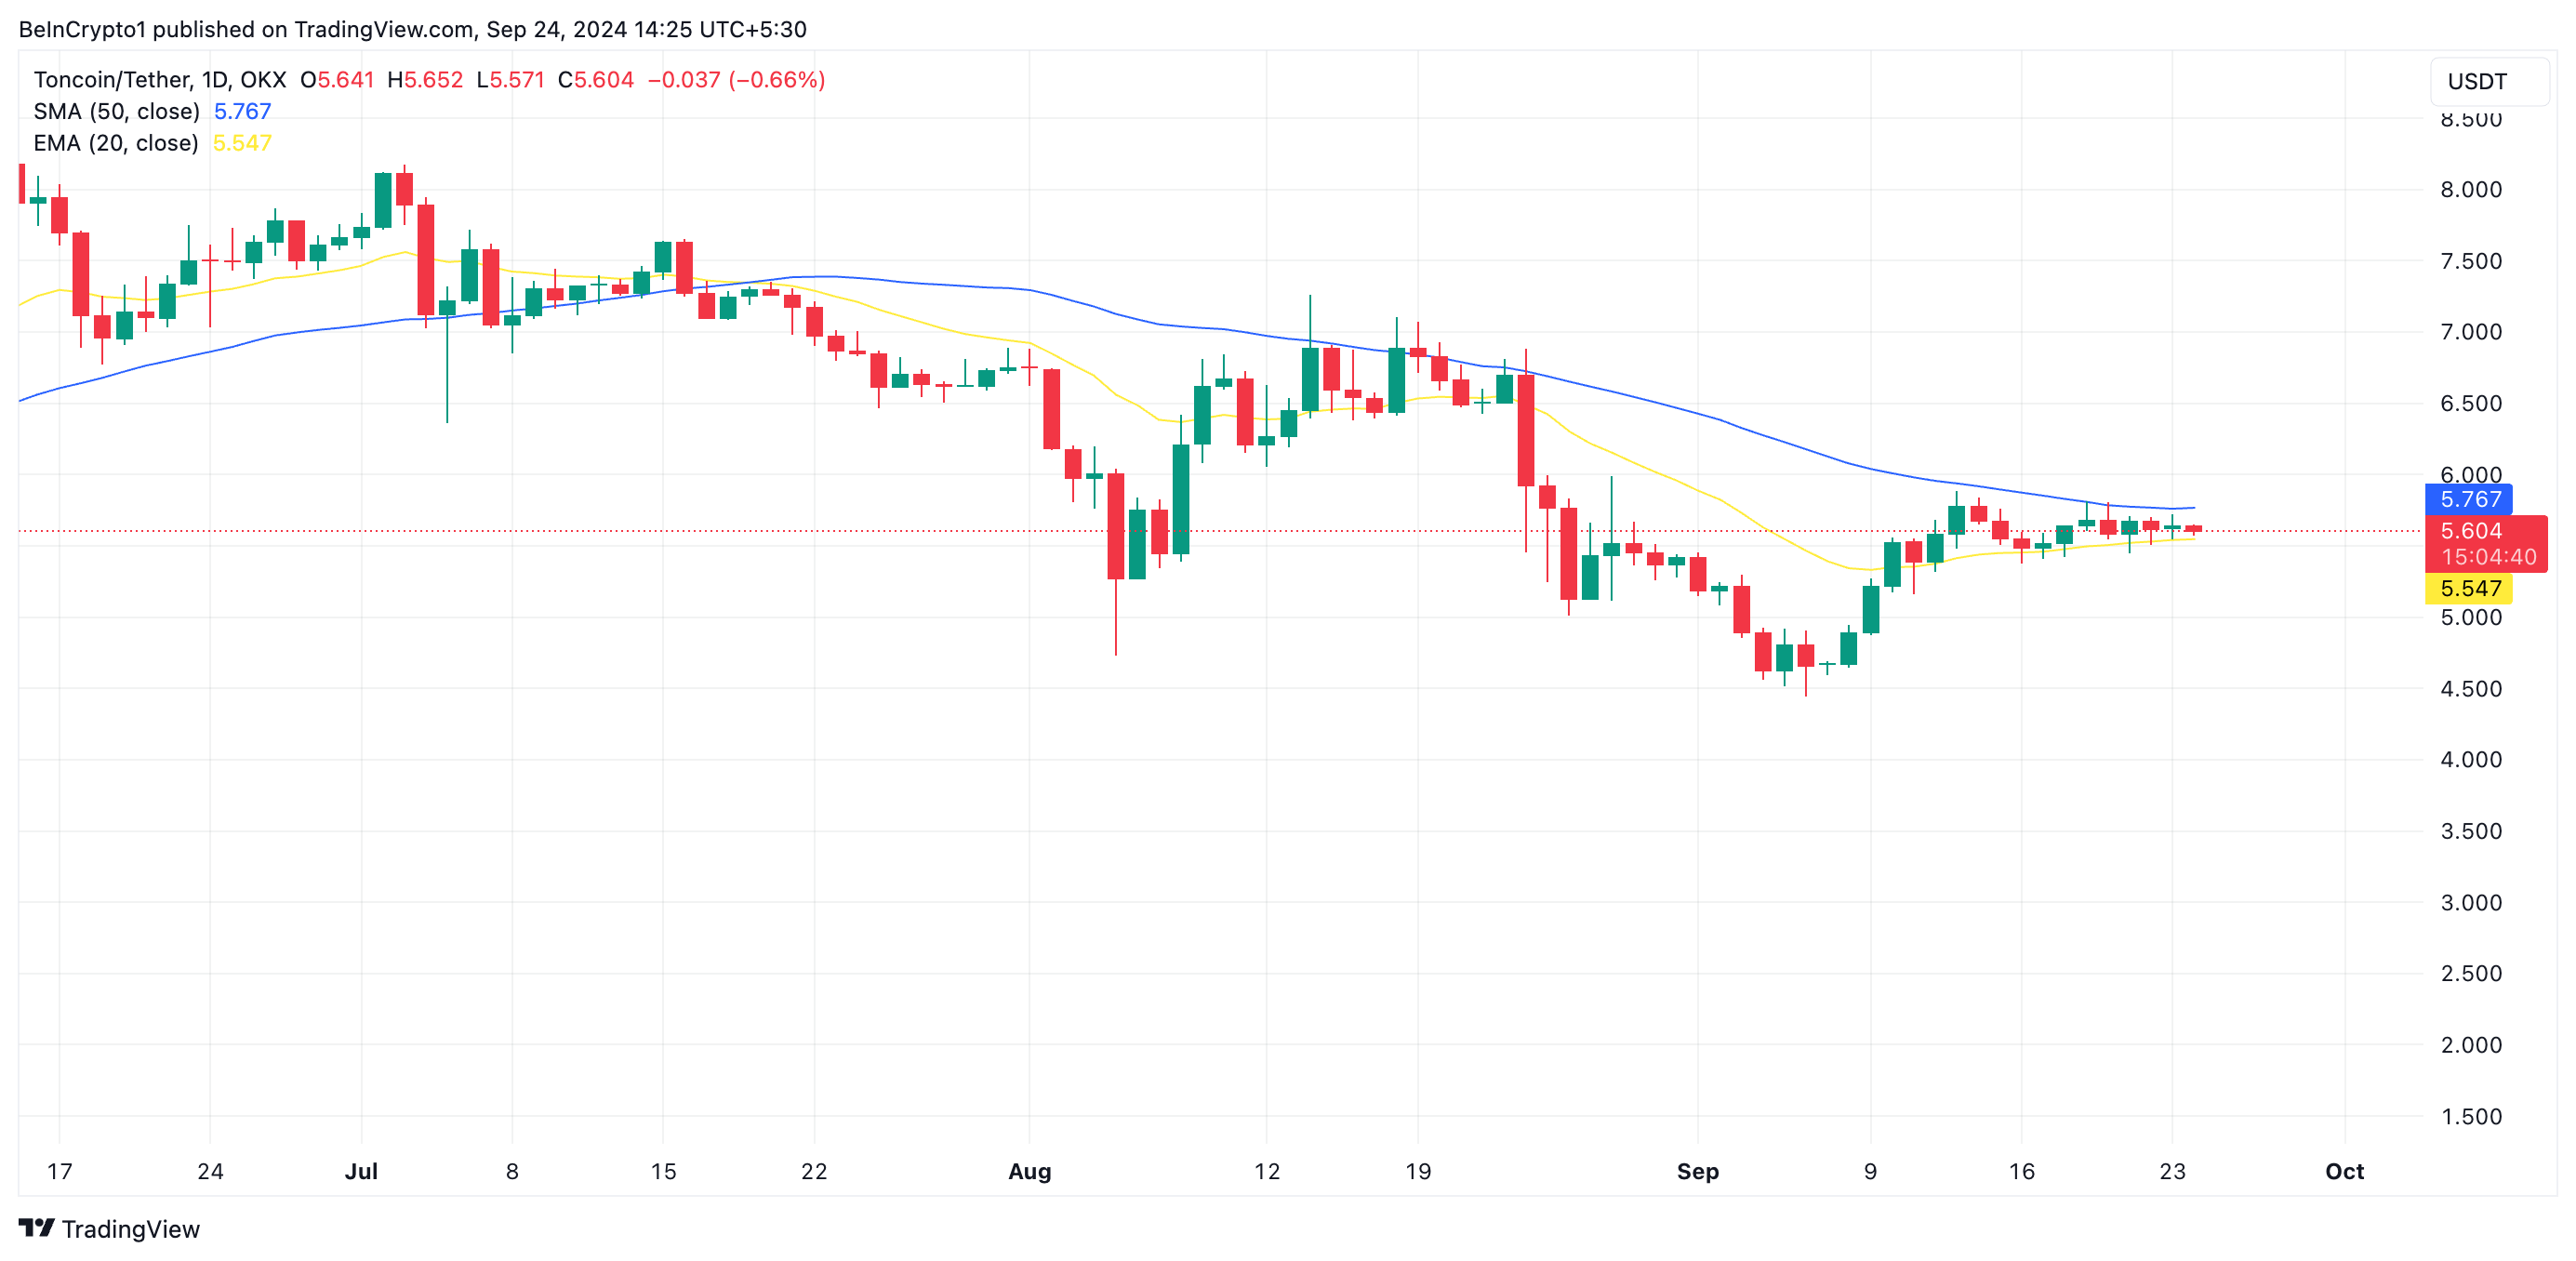 Toncoin Moving Averages. Source: TradingView
When an asset’s 50-day SMA is above its 20-day EMA, it suggests a bearish trend with significant selling pressure. However, TON market participants are looking to reverse that trend, as they have increased their demand for the altcoin in the past week.
IntoTheBlock’s data has revealed an uptick in the TON’s daily active addresses in the past seven days. According to the on-chain data provider, the daily count of addresses that have completed at least one TON transaction has surged by 29% during that period. Likewise, the new demand for the altcoin has also climbed by 78%.
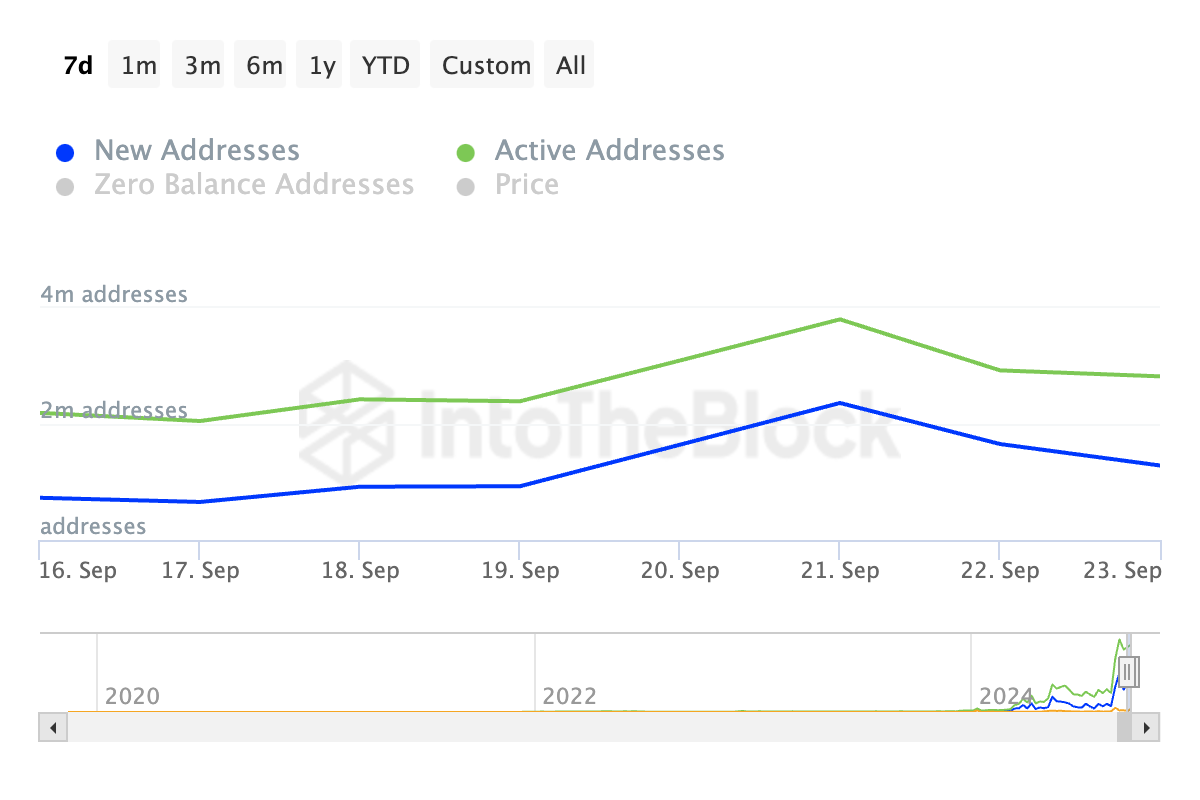 Toncoin Daily Active Addresses. Source: IntoTheBlock
Further, TON’s positive price daily active address (DAA) divergence supports this outlook. This metric, which measures an asset’s price movements with the changes in its number of daily active addresses, is at 119.08% at press time.
This indicates that TON’s price rally is backed by market participants’ corresponding demand for the altcoin.
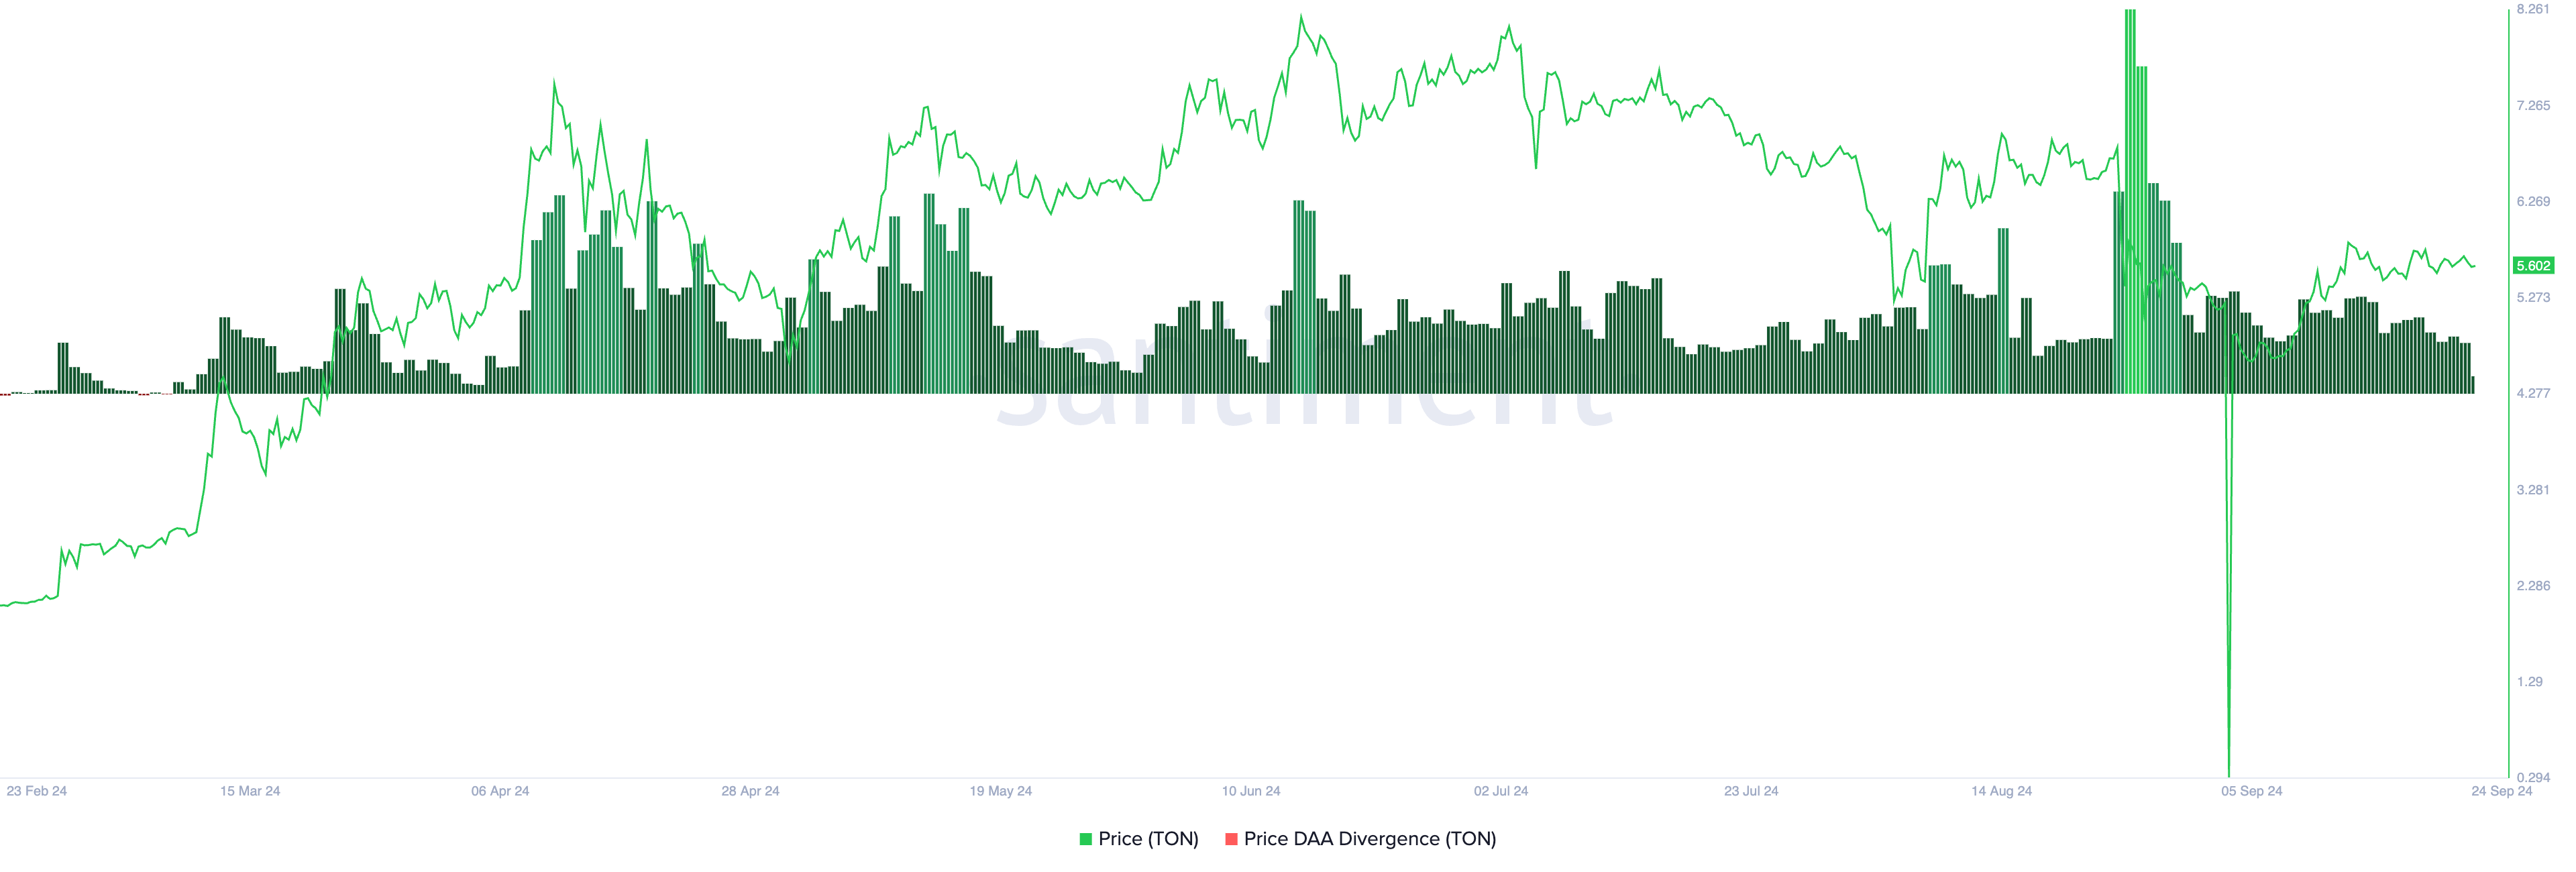 Toncoin Price Daily Active Address Divergence. Source: Santiment
TON Price Prediction: $6.82 Is Possible In the Near Term
Toncoin’s moving average convergence/divergence (MACD) assessed on a daily chart lends credence to the above position. At press time, TON’s MACD line (blue) rests above its signal line (orange) and attempts to cross its zero line.
When the MACD line is above the signal line, it suggests that the short-term momentum is stronger than the long-term momentum. Traders view it as a sign to exit short and take long positions.
If buying pressure continues, TON’s price could break through the resistance at the 50-day SMA. A successful breakout might lead to a 20% rise, pushing the price to $6.82.
Read more: What Are Telegram Mini Apps? A Guide for Crypto Beginners
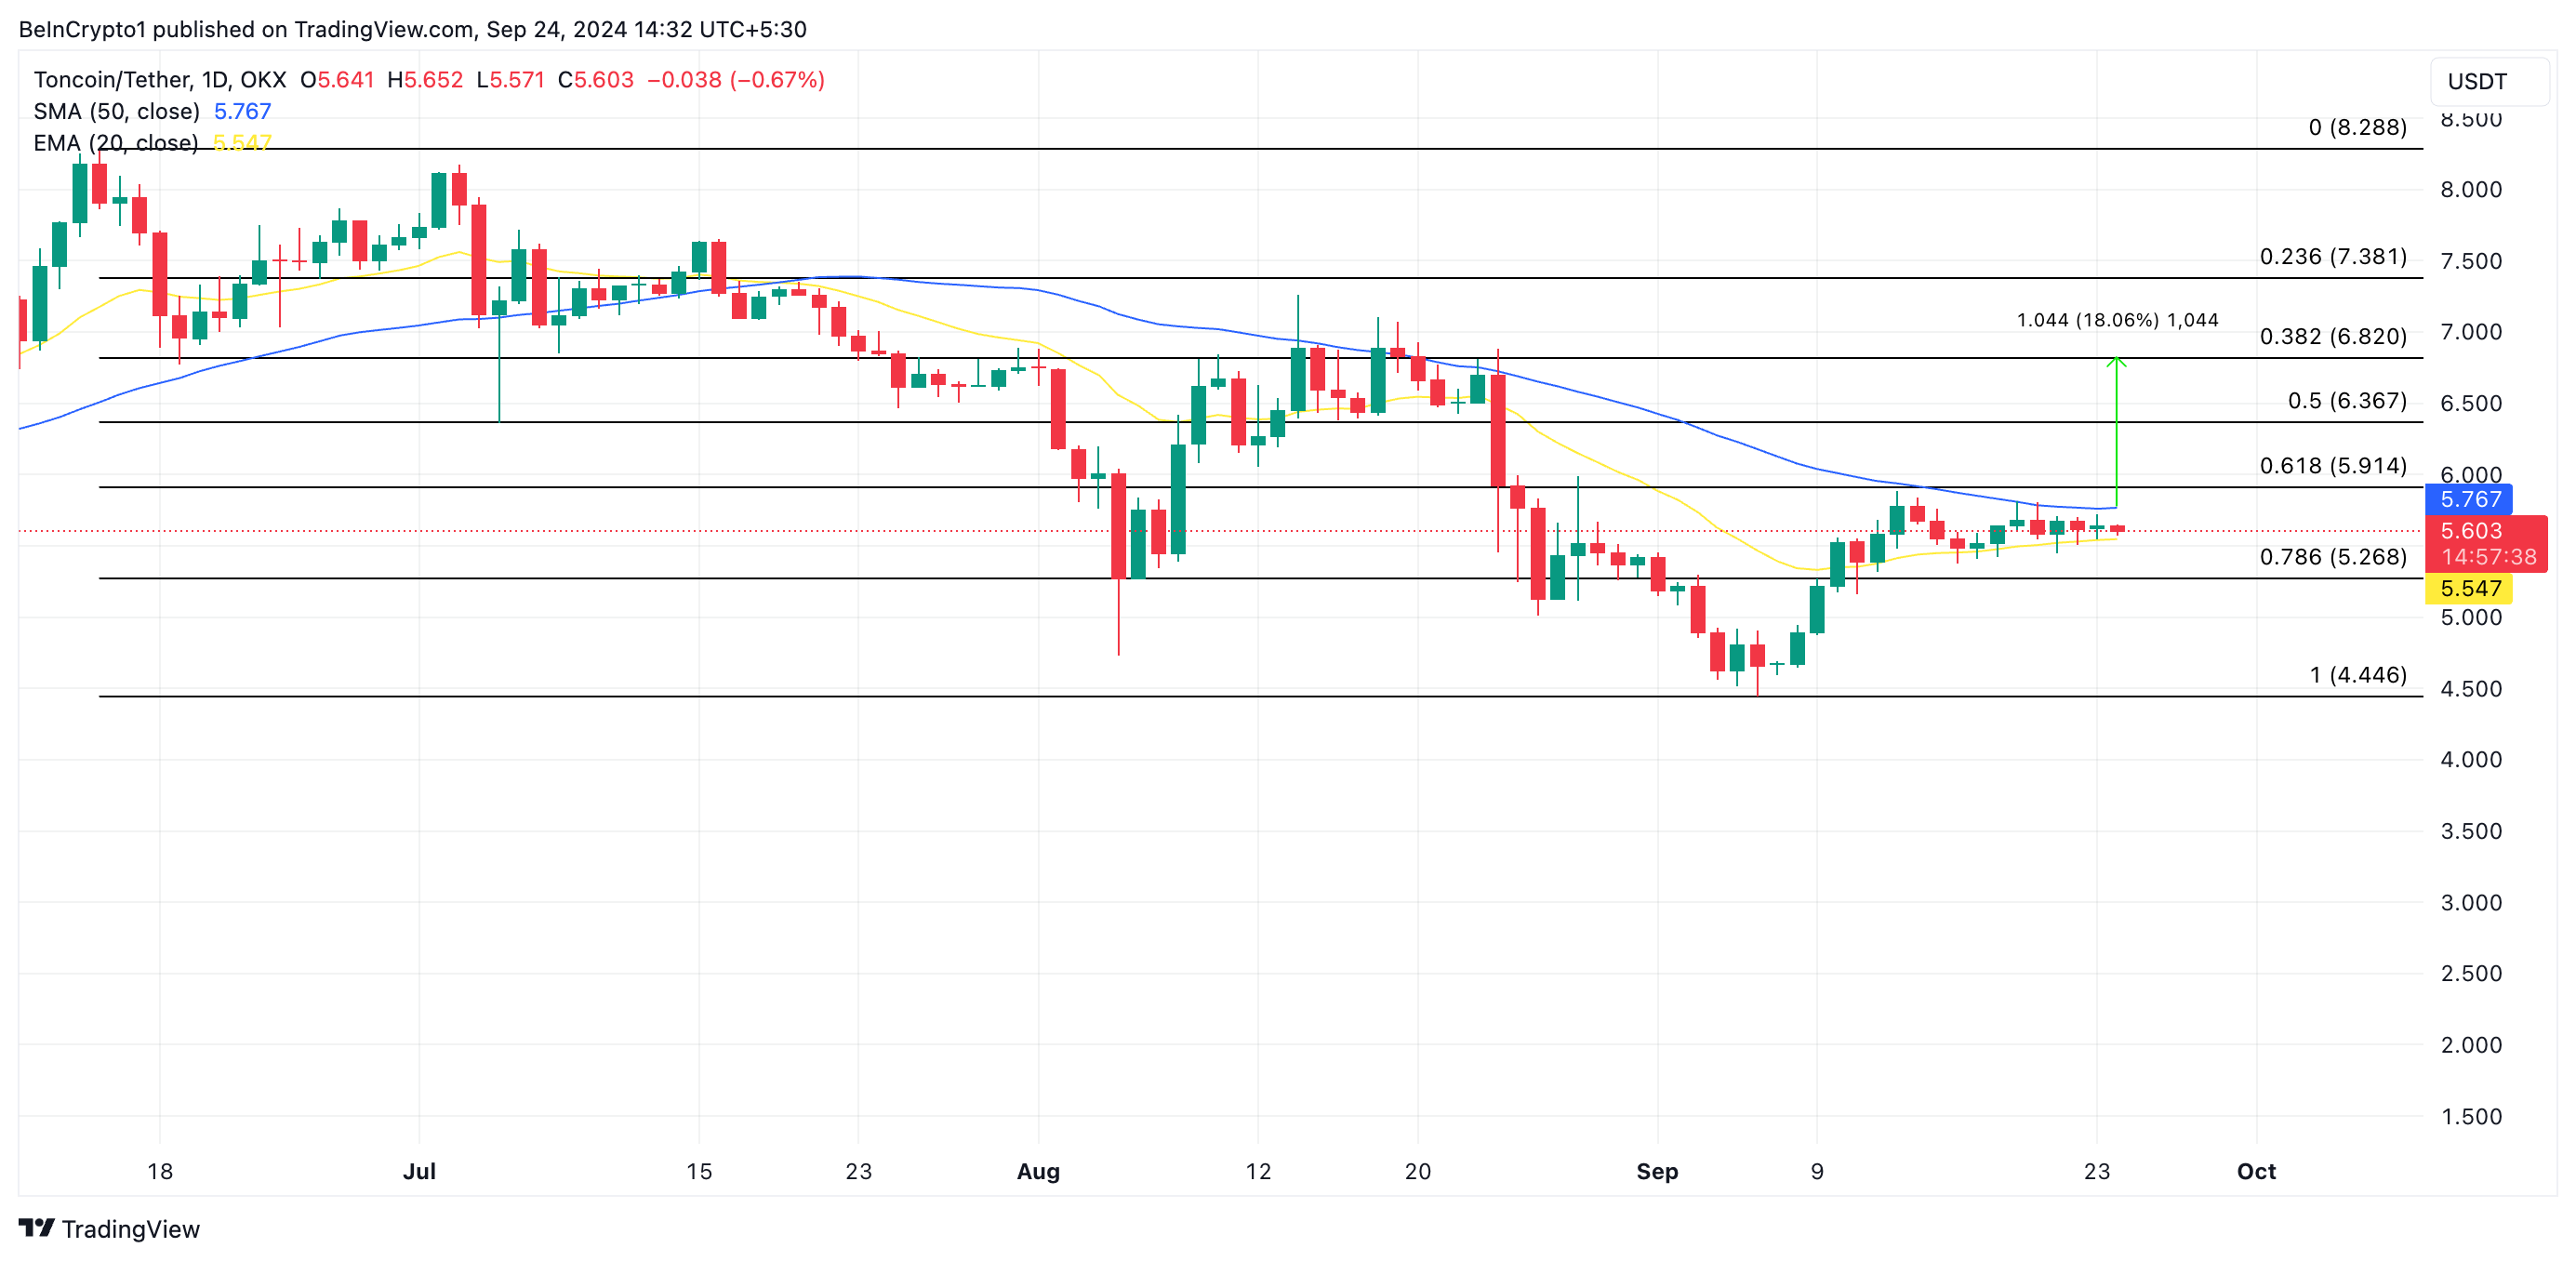 Toncoin Price Analysis. Source: TradingView
However, another unsuccessful attempt to rise above the 50-day SMA could lead to a decline to the support level at $5.47, invalidating the above bullish projection.
The post Toncoin (TON) Nears 50-Day SMA, Targets 20% Price Surge appeared first on BeInCrypto.


 English (US) ·