
 2 hours ago
7
2 hours ago
7
Toncoin (TON) price has recently shown signs of consolidation, with indicators pointing to a lack of clear momentum in either direction. The Relative Strength Index (RSI) and other technical indicators reflect neutral conditions, suggesting that the market sentiment is balanced for now.
The price is currently hovering near key levels, with neither bulls nor bears taking a definitive lead. Whether TON will break out of this range will depend on how the next few days unfold, potentially providing signals for a trend reversal or continued sideways movement.
TON RSI Shows a Neutral State
Toncoin’s (TON) Relative Strength Index (RSI) is currently at 44.38, down from 66 just one day ago. This drop indicates a weakening momentum, moving from a previously stronger position to a more neutral state.
The RSI measures the speed and change of price movements, and this decline suggests that buying pressure has eased, resulting in a more balanced market sentiment.
Read more: 6 Best Toncoin (TON) Wallets in 2024
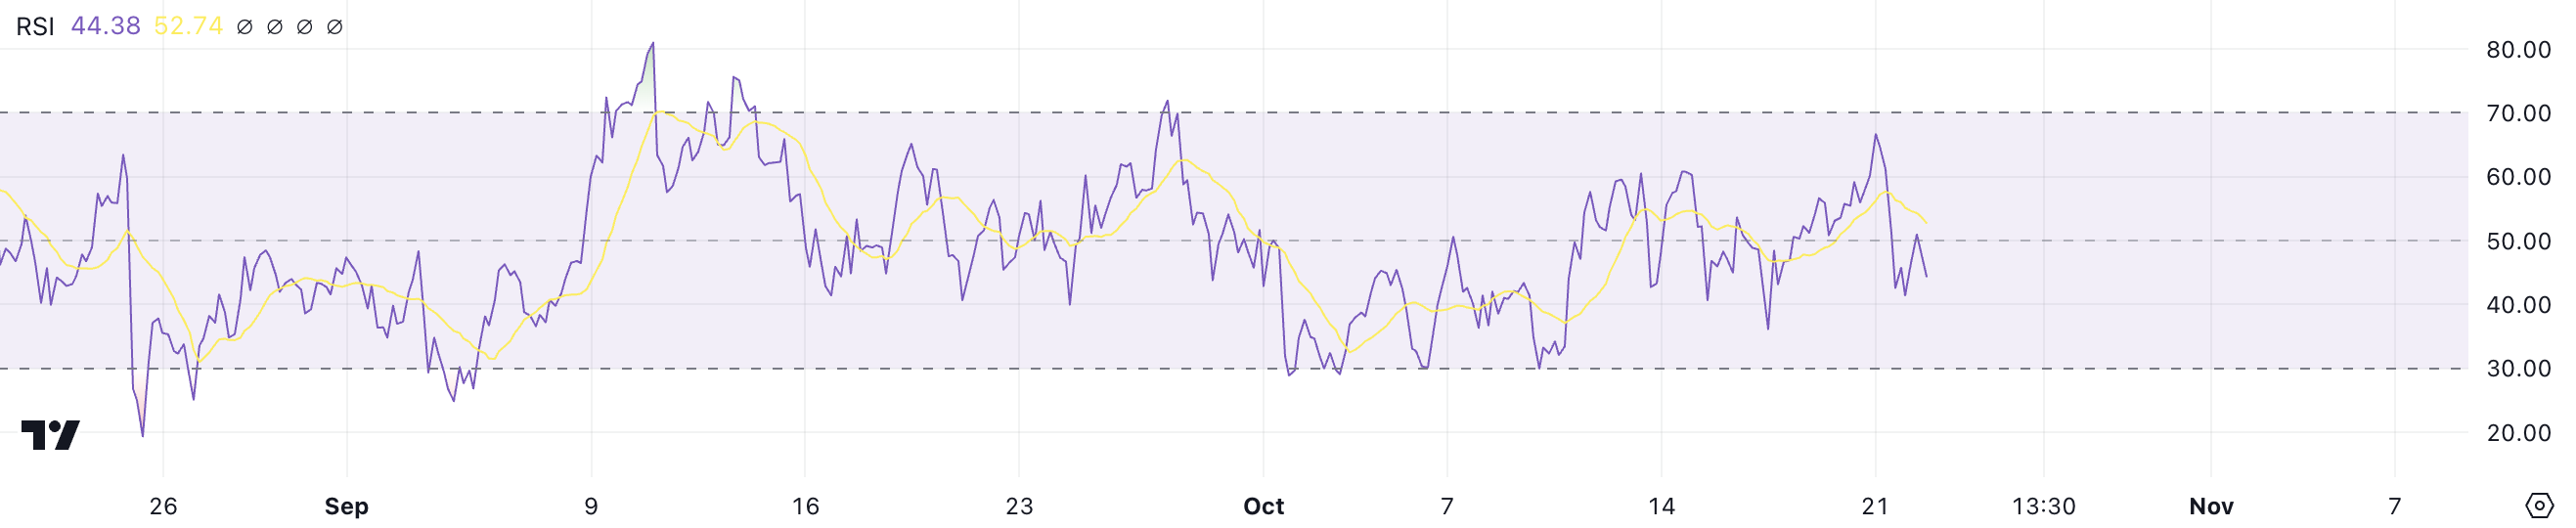 TON RSI. Source: TradingView
The RSI is an important indicator used to assess whether an asset is overbought or oversold. Values above 70 typically indicate overbought conditions, and values below 30 suggest oversold conditions. TON price action shows a period of consolidation around $5.2, with a brief spike to $5.40 a few days ago.
The current RSI level, sitting at 44.38, suggests that this consolidation could continue, as there is no clear momentum in either direction for the TON price at the moment.
Toncoin Ichimoku Cloud Shows Consolidation
The Ichimoku Cloud for TON shows that the price is currently below the cloud, indicating bearish momentum. The leading spans, represented by the green and red clouds, are relatively flat. This suggests a lack of strong directional movement.
The price’s position near the base of the cloud reflects ongoing consolidation. This means it doesn’t show a clear indication of a strong upward or downward trend emerging in the immediate term.
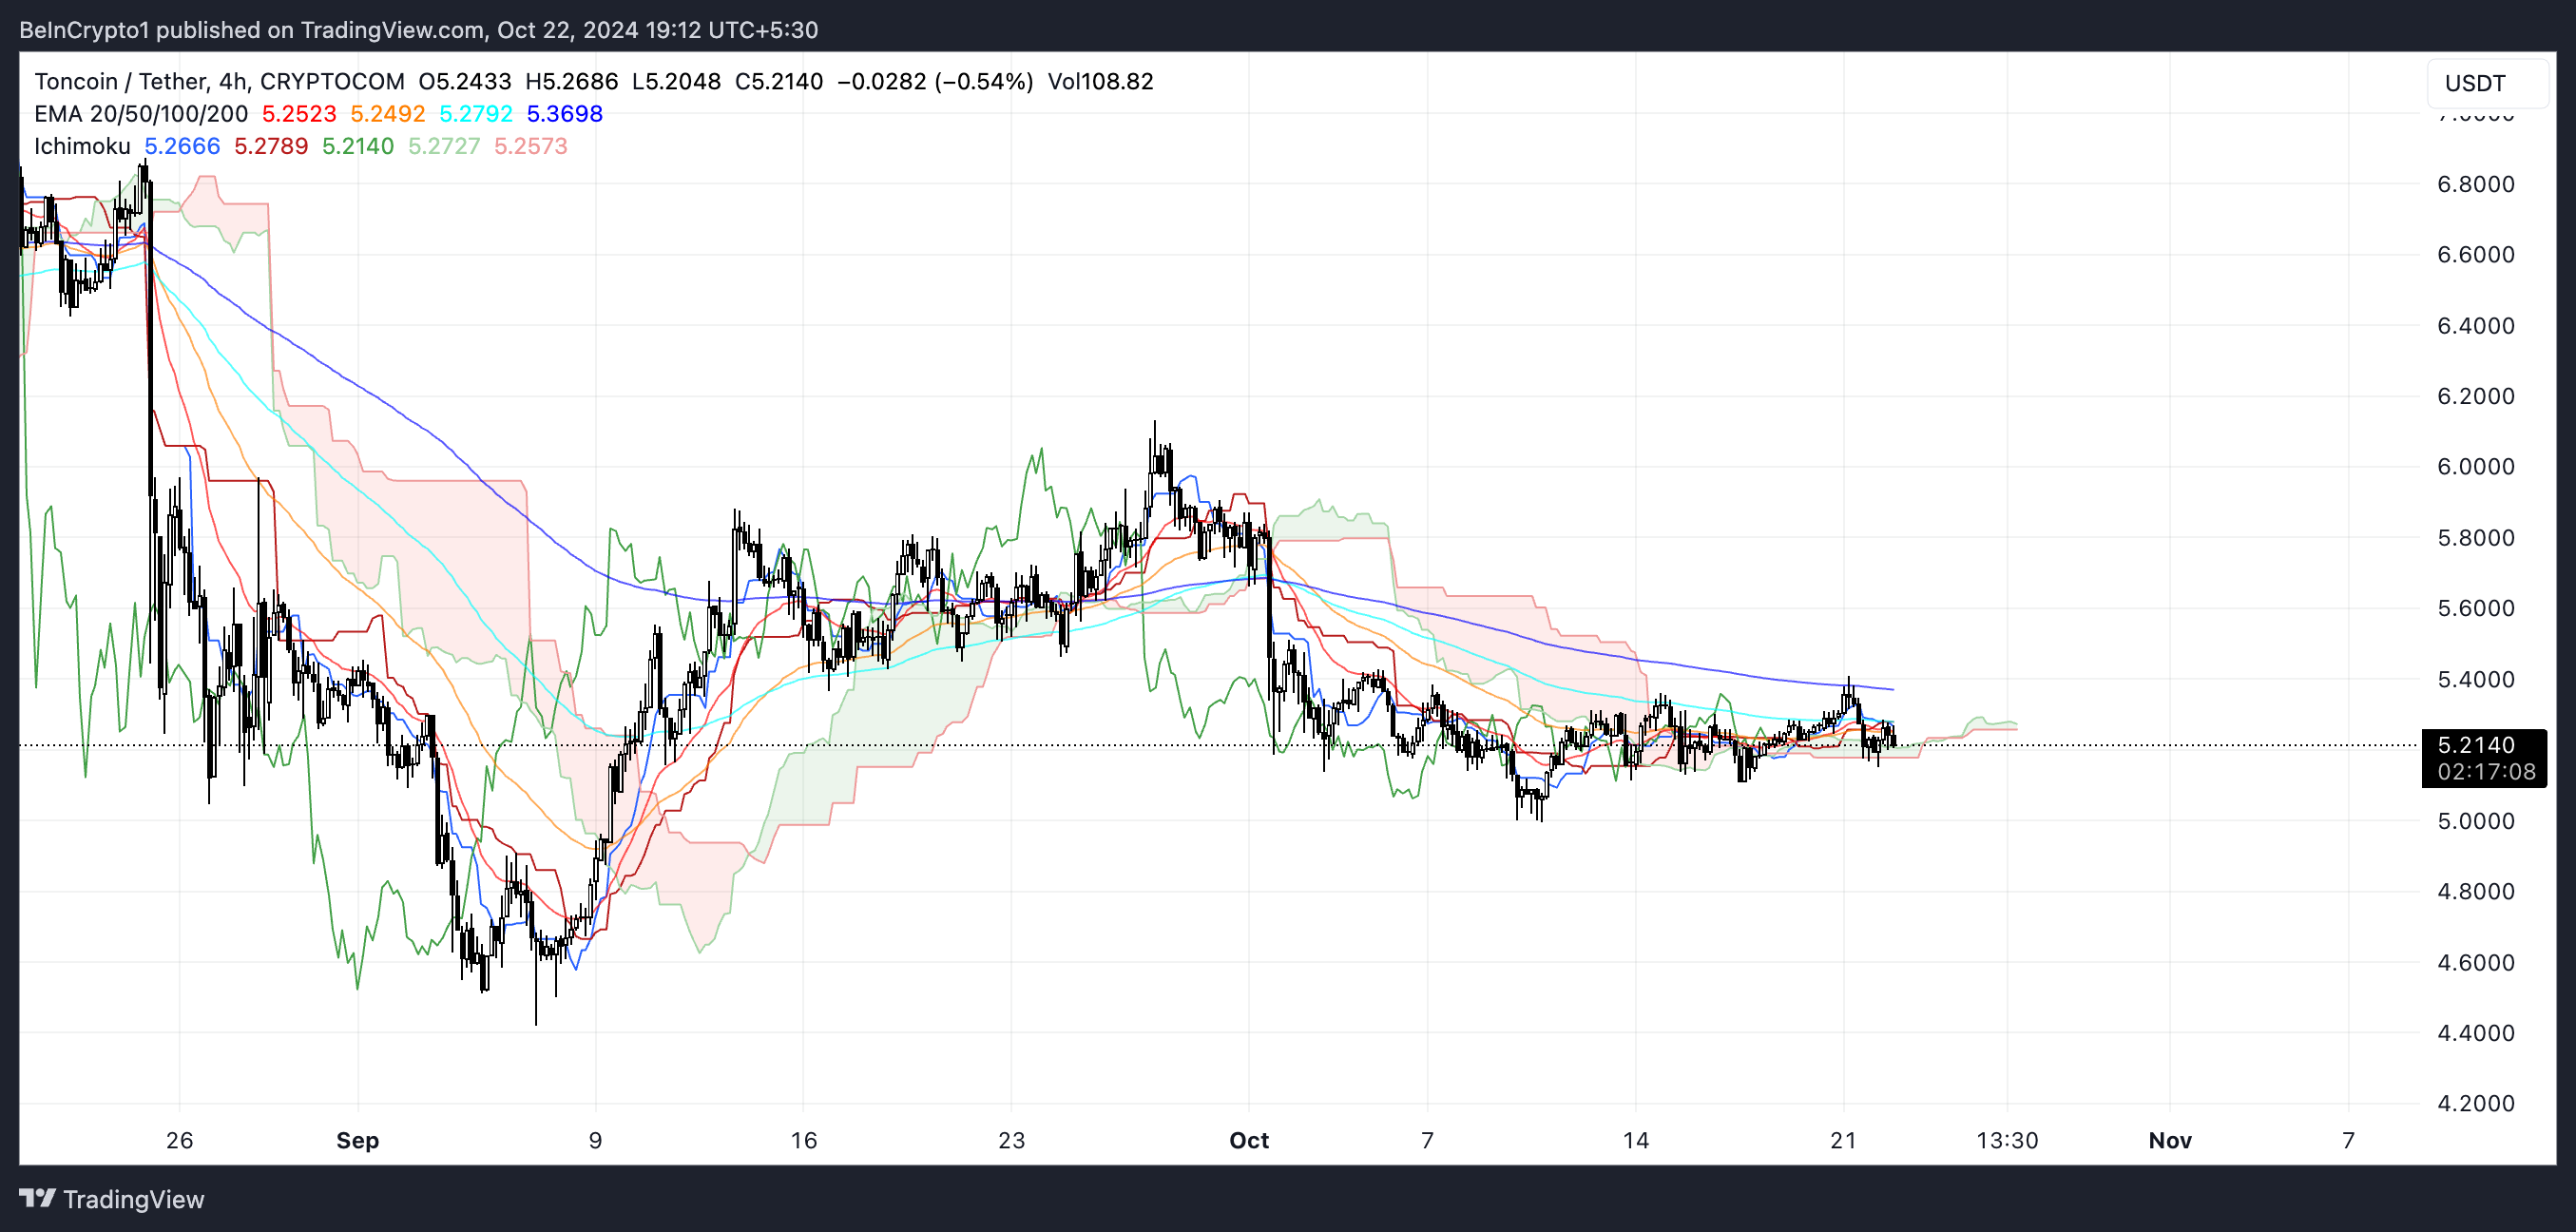 TON Ichimoku Cloud. Source: TradingView
Additionally, the moving averages are trending downward, and the price remains below these lines, further confirming the prevailing bearish sentiment. With the cloud providing resistance overhead and the price consistently hovering around the $5.2 level, TON appears to be in a consolidation phase.
If the price breaks above the EMA lines or the Ichimoku cloud, it could signal a trend reversal, but for now, the signs point to continued indecision and a potential period of sideways trading.
TON Price Prediction: Can TON Return to $6 In October?
The EMA lines for TON clearly indicate bearish pressure, with the short-term EMAs positioned below the long-term EMA. The downward slope of these lines signifies that bearish momentum is still in play.
The price currently trades near all of these EMAs, indicating consolidation. That also means the possibility of significant price movement in either direction depending on market conditions.
Read more: Top 9 Telegram Channels for Crypto Signals in October 2024
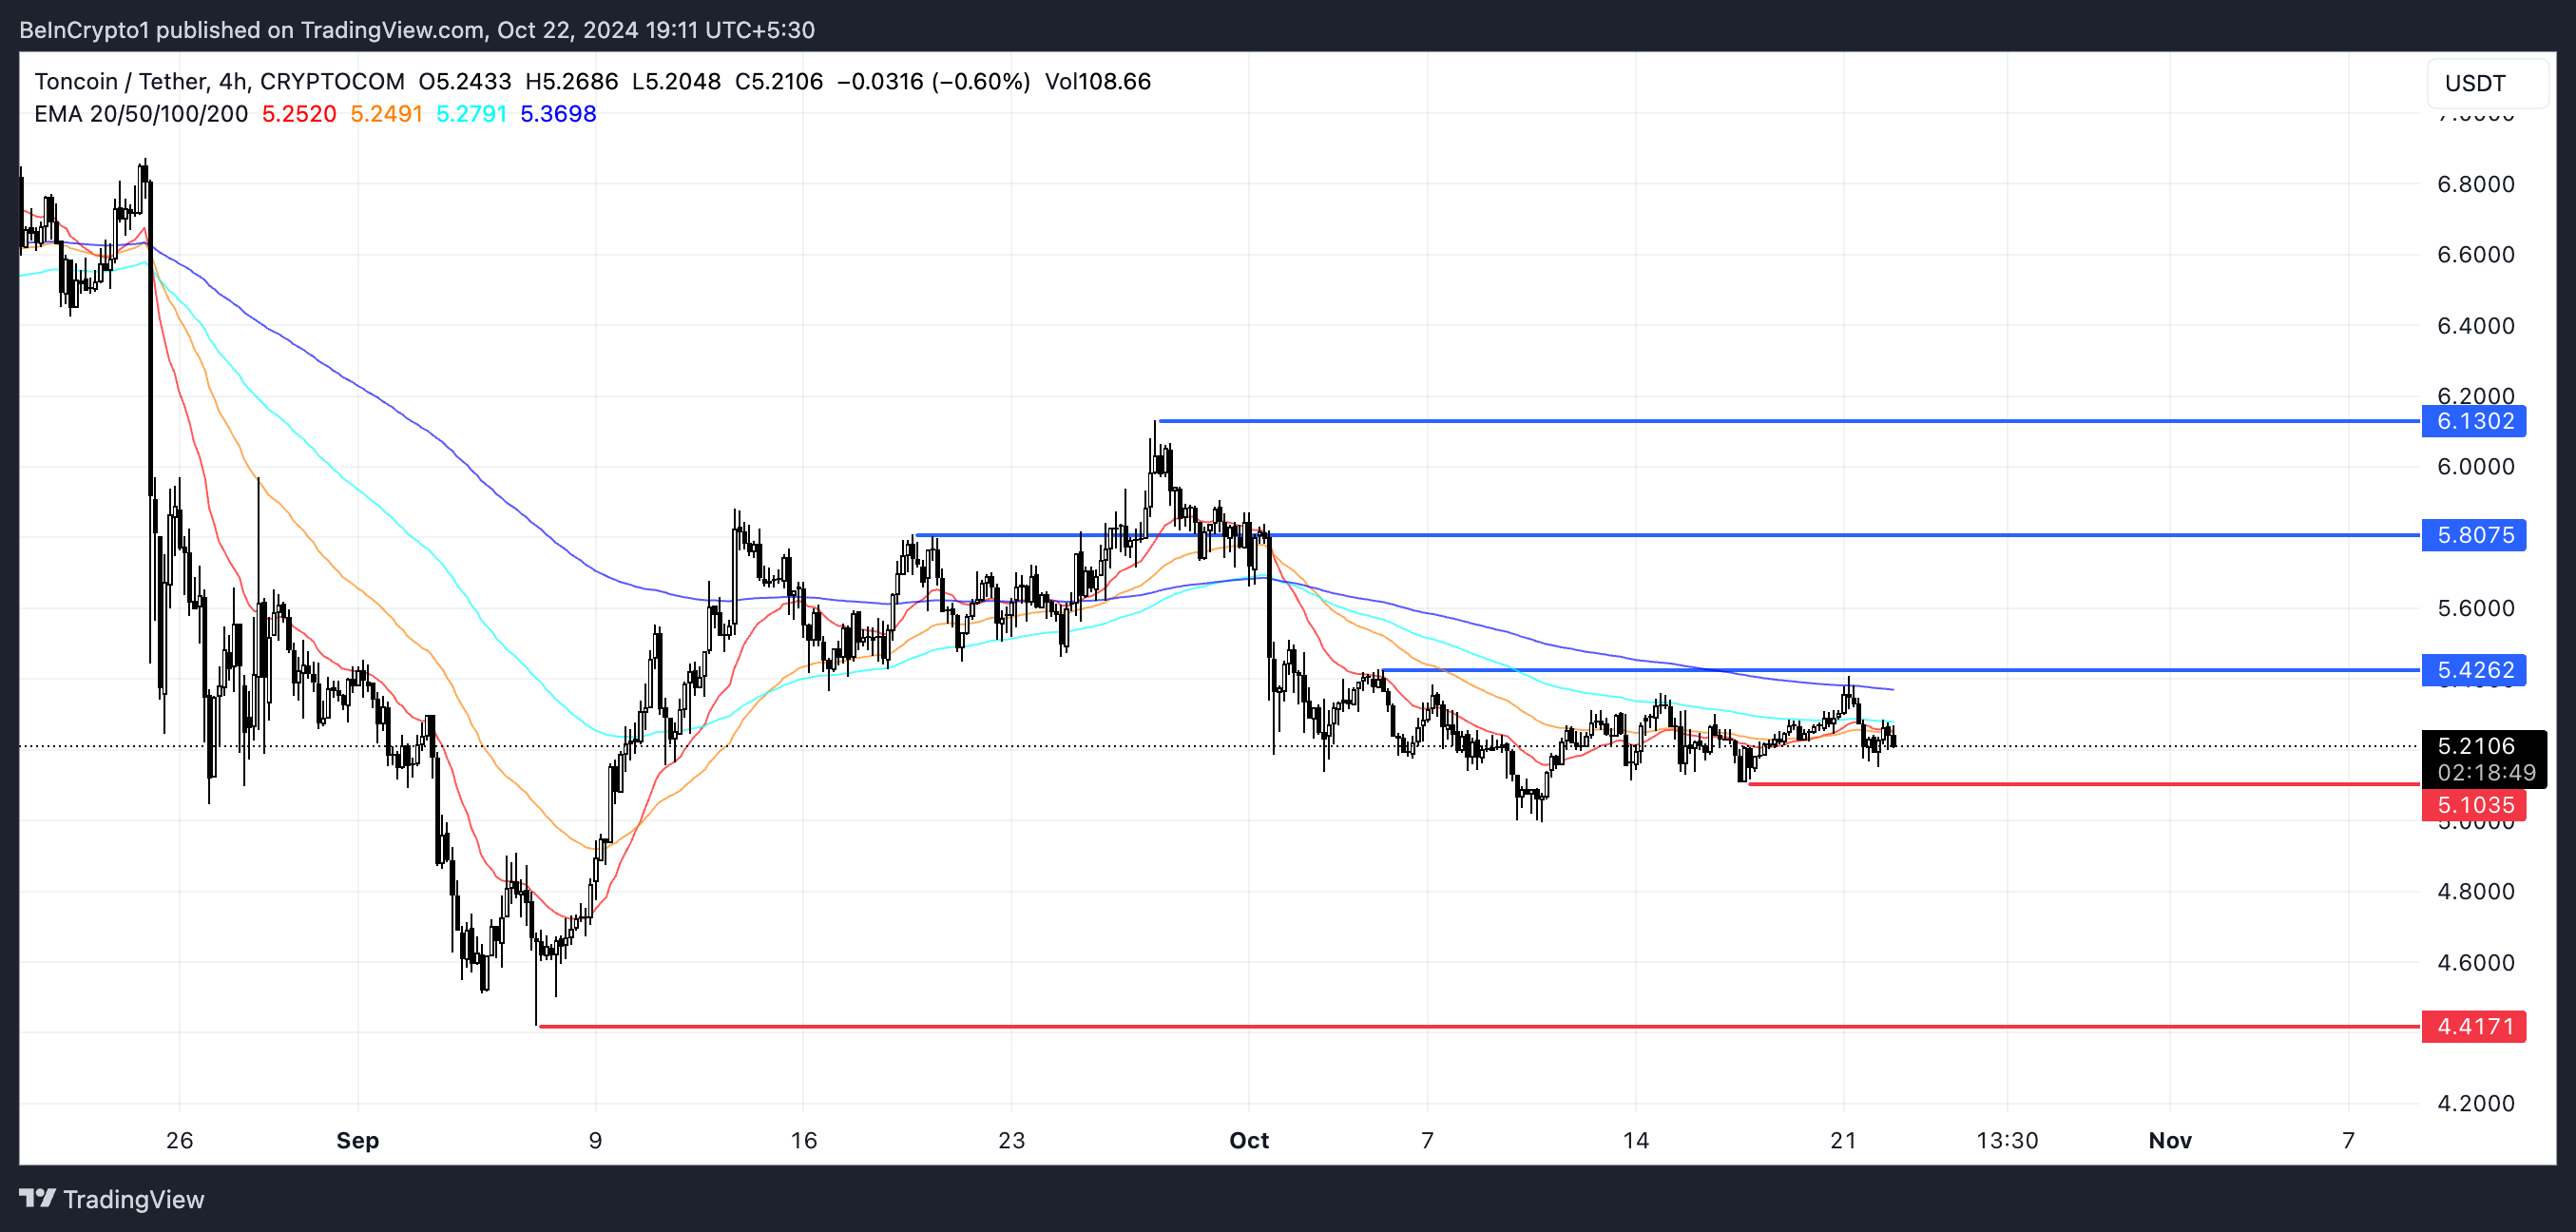 TON EMA Lines and Support and Resistance. Source: TradingView
TON also has key support and resistance levels that help map out potential price action. Immediate support lies at $5.10, and if this level is breached, the next support is down at $4.42, which could signal a deeper correction. On the upside, resistance levels are marked at $5.42, $5.80, and $6.13.
A successful breakout above these resistance levels, particularly above $5.80, could suggest a reversal in momentum and a return to a bullish trend. However, until a decisive move occurs, TON seems to be trading within a range, showing a neutral to bearish outlook.
The post Toncoin (TON) Price Faces Consolidation with Bearish Pressure Building appeared first on BeInCrypto.


 English (US) ·