
 2 months ago
44
2 months ago
44
The April meme coin rally accelerated as Pudgy Penguins (PENGU), MemeCore (M), and SPX6900 (SPX) posted weekly gains between 19% and 32%, with each chart now testing decisive Fibonacci levels.
The three tokens dominate this week’s meme coin leaderboard, but their technical setups diverge. One faces a stretched RSI, another breaks fresh resistance, and the third attempts a breakout on uncertain volume.
MemeCore (M) Stalls Near $4.86 After Fibonacci Extension Hit
MemeCore (M) trades near $4.19 after a 23% weekly advance, holding within the upper Fibonacci pocket between the 0.786 and 1.0 retracement levels. The token printed a recent swing high of $4.86 on April 24.
The Fibonacci structure draws from the November low and a second test of that same low on February 1. After retracing toward the 0.618 golden pocket near $3.46, buyers stepped back in.
That bounce coincided with a retest of an ascending exponential curve and the green-box support zone close to $3.00.
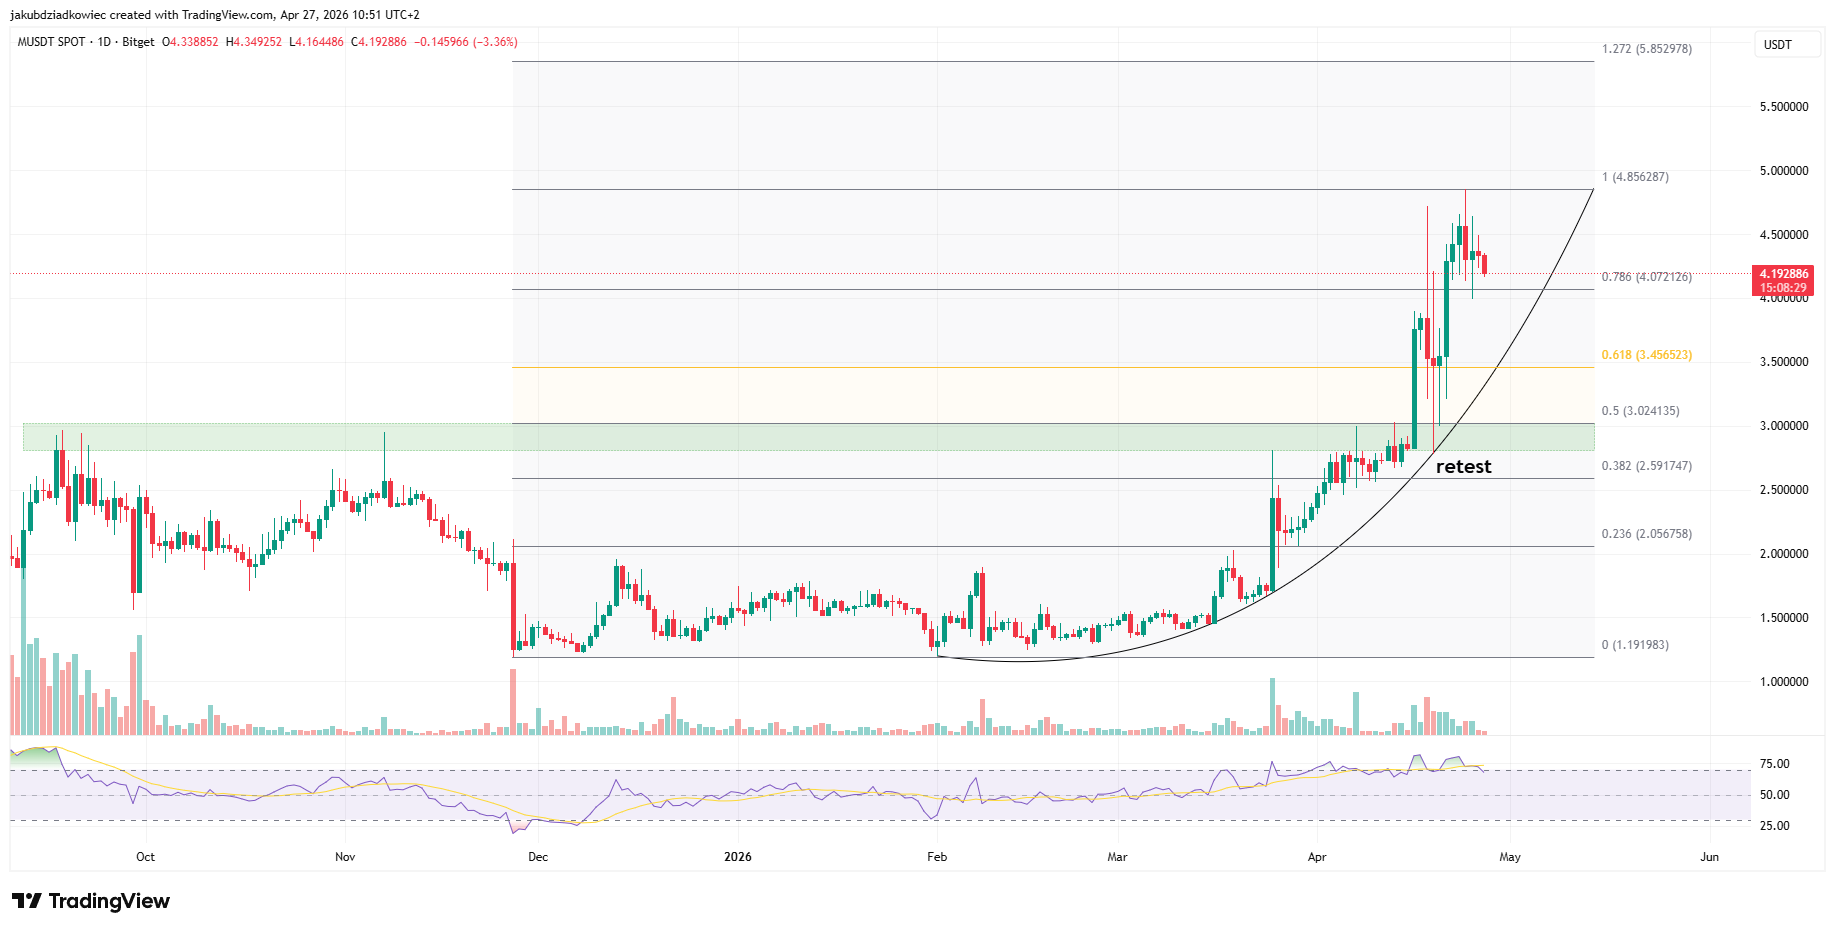 M daily chart / Source: Tradingview
Momentum signals warrant caution. The Relative Strength Index (RSI) sits at the edge of overbought territory and prints one bearish divergence against the latest swing high. Volume is also contracting, which weakens the case for an immediate continuation.
A clean break above $4.86 opens the path to the 1.272 Fibonacci extension at $5.85, the next bullish target. Failure to reclaim that high keeps M trapped in the upper pocket and exposes a deeper retest of the $3.46 golden pocket.
Pudgy Penguins (PENGU) Powers Meme Coin Rally With Breakout
PENGU trades near $0.0096 after a 32% weekly surge. The token broke decisively above the $0.008 resistance zone that had capped price action since early February, flipping that level to support.
The breakout escapes a multi-month accumulation range that formed between $0.006 and $0.008. Daily volume picked up sharply during the move, supporting the validity of the breakout. RSI climbs toward the overbought line yet has room to run before signaling exhaustion.
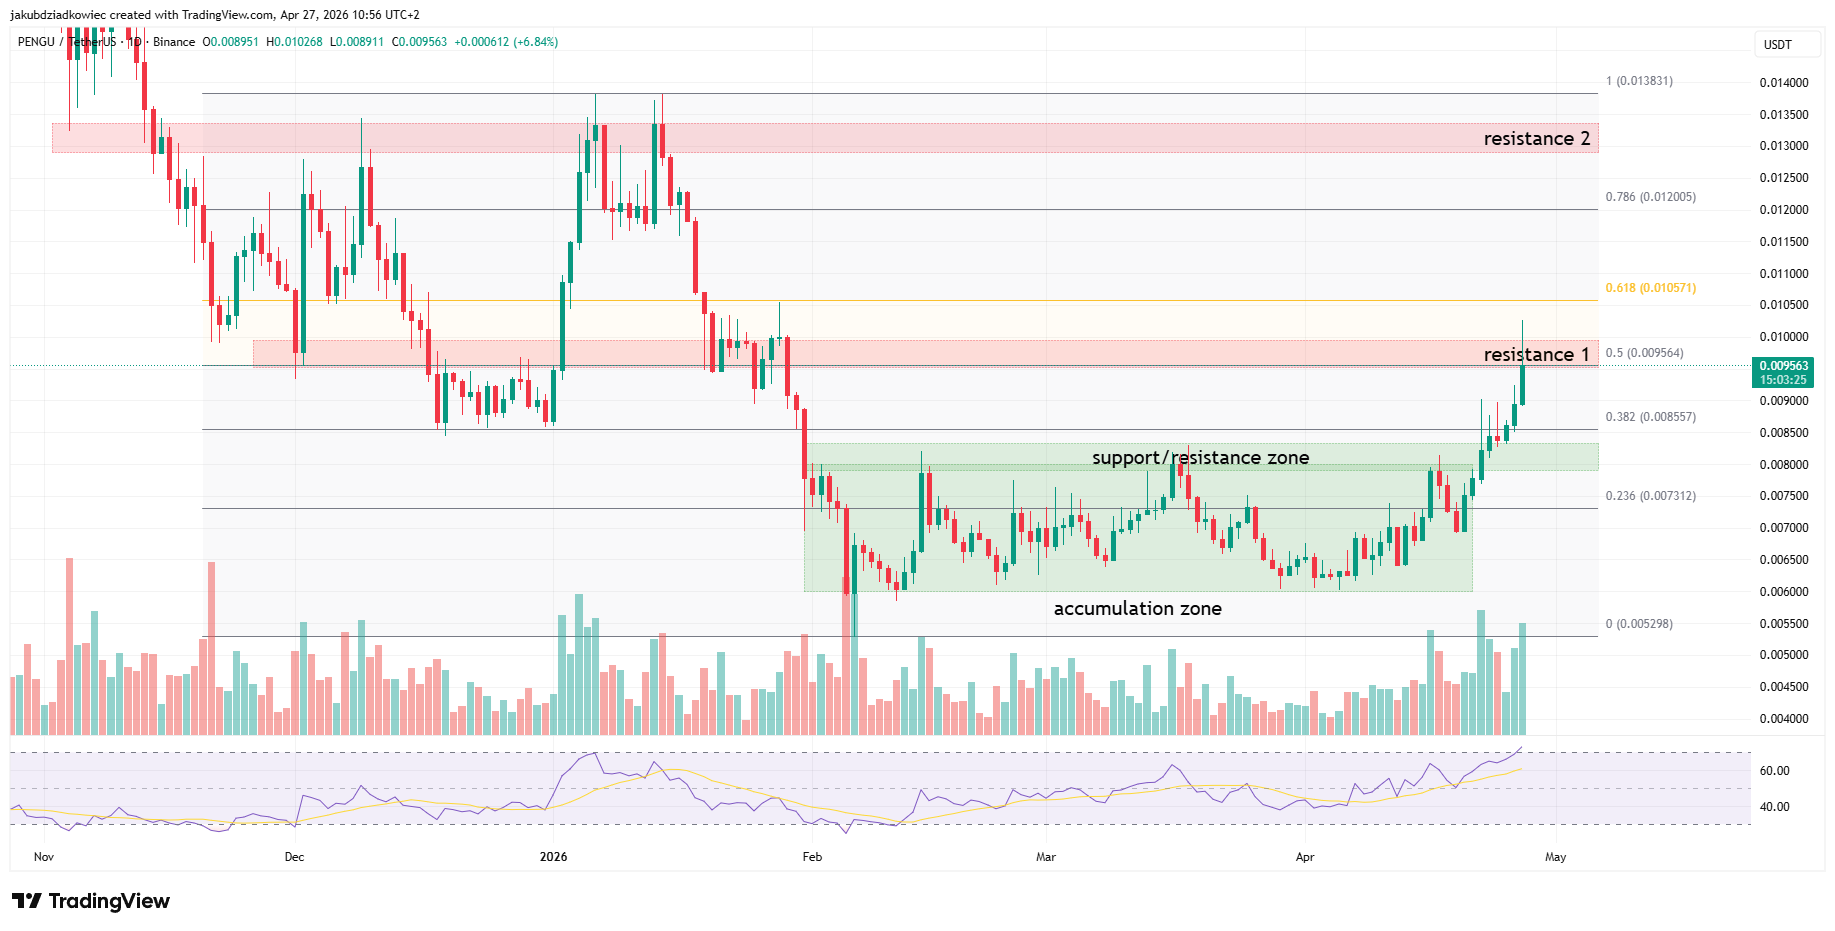 PENGU daily chart / Source: Tradingview
Price now contests the 0.5 Fibonacci retracement at $0.0096, the immediate resistance flagged on the chart. A long upper wick shows sellers defending the level. Holding above $0.008 keeps the bullish structure intact.
A daily close above $0.0096 sets the next destination at the 0.618 golden pocket near $0.0106. Beyond that, the $0.013 zone marks the prior resistance shelf and aligns with the 1.0 Fibonacci level. Loss of $0.008 invalidates the breakout.
SPX6900 (SPX) Breakout Lacks Volume Confirmation
SPX6900 (SPX) sits near $0.3839 after a 19% weekly advance, mirroring a setup the token printed earlier in the year. Price emerged from an accumulation channel between $0.27 and $0.35 that held throughout most of February, March, and the first half of April.
The current resistance challenge sits at the 0.382 Fibonacci retracement near $0.426, the next zone where sellers have previously blocked rallies. RSI hovers around 60 and tilts higher, which fits a healthy uptrend rather than an overheated reading.
Bollinger Bands have widened, with price riding the upper band. That expansion confirms increasing volatility and a bullish bias on the short-term tape. Volume tells a different story. The breakout attempt prints on subdued turnover, reducing conviction in the move.
A volume-backed close above $0.426 would unlock the 0.5 retracement near $0.489 and then the 0.618 golden pocket at $0.55.
Without participation, SPX risks slipping back into the upper end of the accumulation channel near $0.35, with the lower bound at $0.22 acting as the structural floor. Broader sector rotation into meme coins could supply the missing volume.
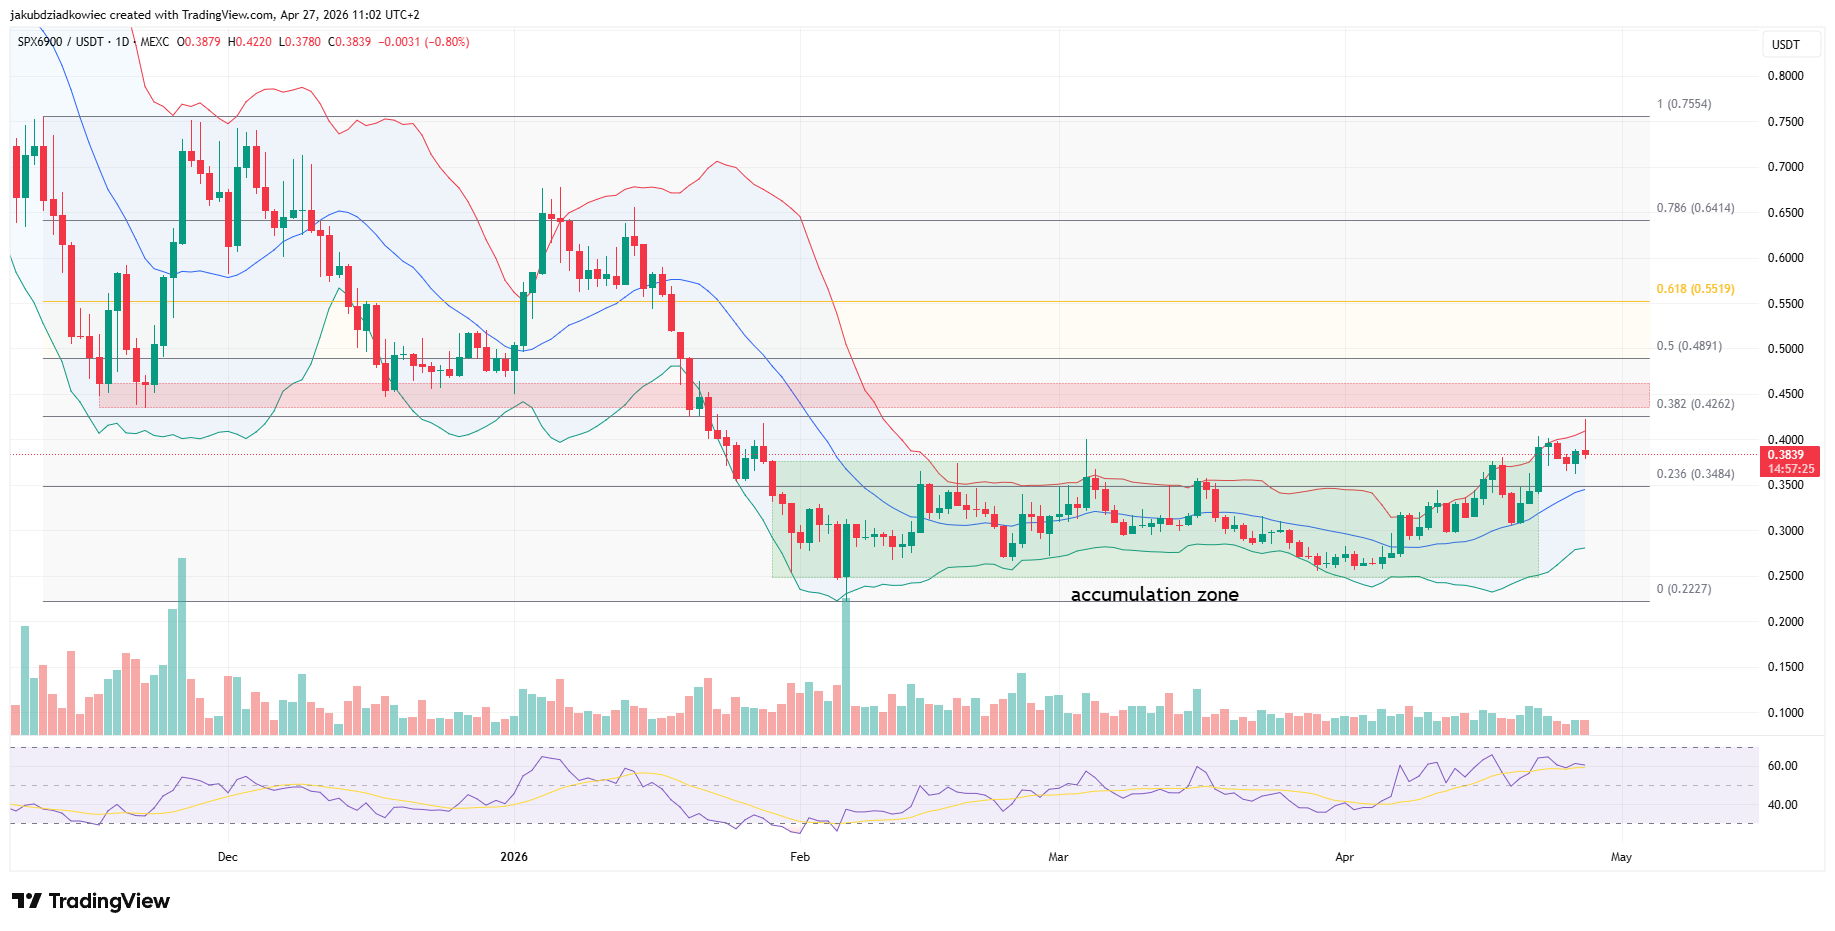 SPX daily chart / Source: Tradingview
The post Top 3 Meme Coins to Watch in Final Week of April 2026 appeared first on BeInCrypto.


 English (US) ·