
 3 weeks ago
29
3 weeks ago
29
- TRON remains one of the few top crypto assets showing recent strength
- Price is testing a key range resistance near $0.32 with weak volume support
- A confirmed breakout or rejection will likely define the next major move
At the time of writing, TRON (TRX) managed to stay slightly green over the past week, climbing about 0.85% while most top 20 assets struggled to find footing. It even pushed up to a local high near $0.317 on March 27, which, for a moment, looked like a clean continuation. But that move didn’t really hold, and price slipped back, dropping roughly 1.48% within a day. Still, compared to the broader market, TRX hasn’t looked weak, just… a bit indecisive maybe.
Since the early February drop, TRON has quietly built back momentum, gaining over 15% in just a little more than seven weeks. That recovery didn’t feel explosive, more like a steady grind upward, but it mattered. Price now sits close to the mid-January high around $0.32, which is starting to look like a real test zone. Whether it breaks or stalls here, that’s where things get interesting.
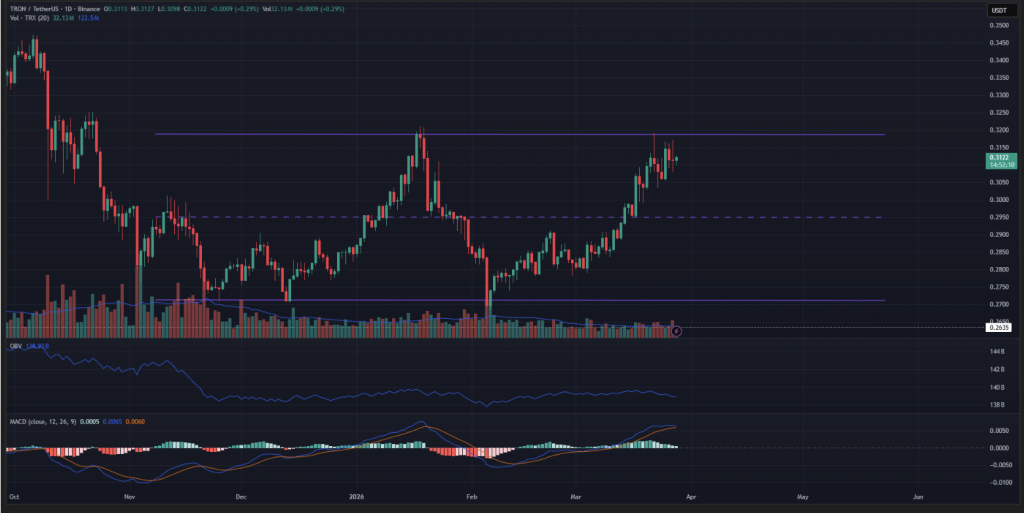
Range Structure Begins to Tighten
On the daily chart, TRX still leans bullish, with momentum indicators like MACD pointing upward, though not aggressively. Price is now brushing against the upper boundary of a multi-month range, roughly between $0.271 and $0.319. That range has been in play for about four months, so it’s not something traders can ignore easily. And usually, when price hits the top of a range like this, things either break hard… or reject just as quickly.
There’s also a subtle warning sign, the OBV hasn’t made new highs recently, which suggests buying pressure isn’t exactly dominating. It’s not a collapse in demand, but it’s also not the kind of strength you’d expect before a breakout. Volume overall has been pretty average since December, nothing that screams conviction. That lack of strong participation might end up holding TRX back, at least for now.
Short-Term Momentum Starts to Fade
Zooming into the 4-hour chart, the structure still technically holds bullish, though momentum is clearly softening. Indicators are starting to flatten, and even OBV is losing a bit of its edge. There was a reaction around the $0.309 level recently, showing buyers are still around, just not overly aggressive. It feels like a market waiting for confirmation rather than rushing in.
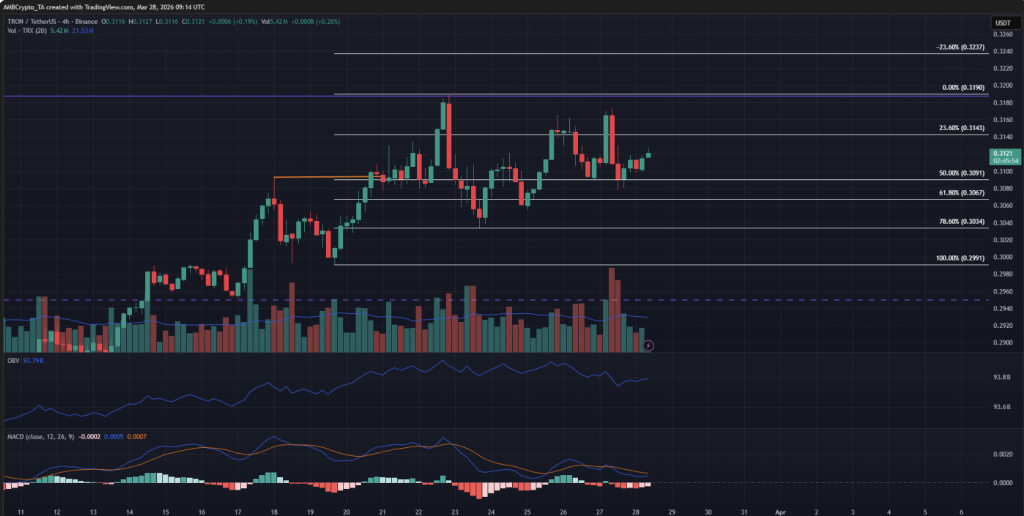
Even so, traders should probably respect the broader range until it breaks cleanly, not just briefly pokes above. In situations like this, profit-taking becomes more common, especially near resistance zones. That could mean a gradual move back toward the lower range, rather than an immediate breakout. It’s not bearish outright, but it’s cautious, maybe even hesitant.
Key Level That Could Shift the Bias
Right now, TRX sits in what many would call a “no-trade zone,” where direction isn’t fully clear yet. If price starts to drift lower, the range lows near $0.271 could come back into focus. On the other hand, a strong daily close above $0.32 would likely flip sentiment quickly and invalidate the current cautious outlook. That level matters more than it seems.
Until then, it’s a waiting game, honestly. The structure hasn’t broken, but it hasn’t confirmed strength either. Traders might lean slightly bearish near resistance, while still keeping an eye on breakout potential. It’s one of those setups where patience tends to pay off more than rushing in.
Disclaimer: BlockNews provides independent reporting on crypto, blockchain, and digital finance. All content is for informational purposes only and does not constitute financial advice. Readers should do their own research before making investment decisions. Some articles may use AI tools to assist in drafting, but every piece is reviewed and edited by our editorial team of experienced crypto writers and analysts before publication.


 English (US) ·