
 3 months ago
42
3 months ago
42
The Tron (TRX) price has increased considerably in 2024 and reached a new 1,000-day high today.
The TRX price has accelerated its rate of increase twice in the past two years. Will it do so once more?
TRON Reaches 1,000-Day High
The weekly time frame chart shows the TRX price has increased by nearly 30% in 2024. More recently, it created four successive bullish weekly candlesticks.
The upward movement caused a breakout from a horizontal resistance area and led to a high of $0.132 today. This is the highest price in more than 1,000 days, more specifically since May 2023. TRX faces only one more resistance until its all-time high.
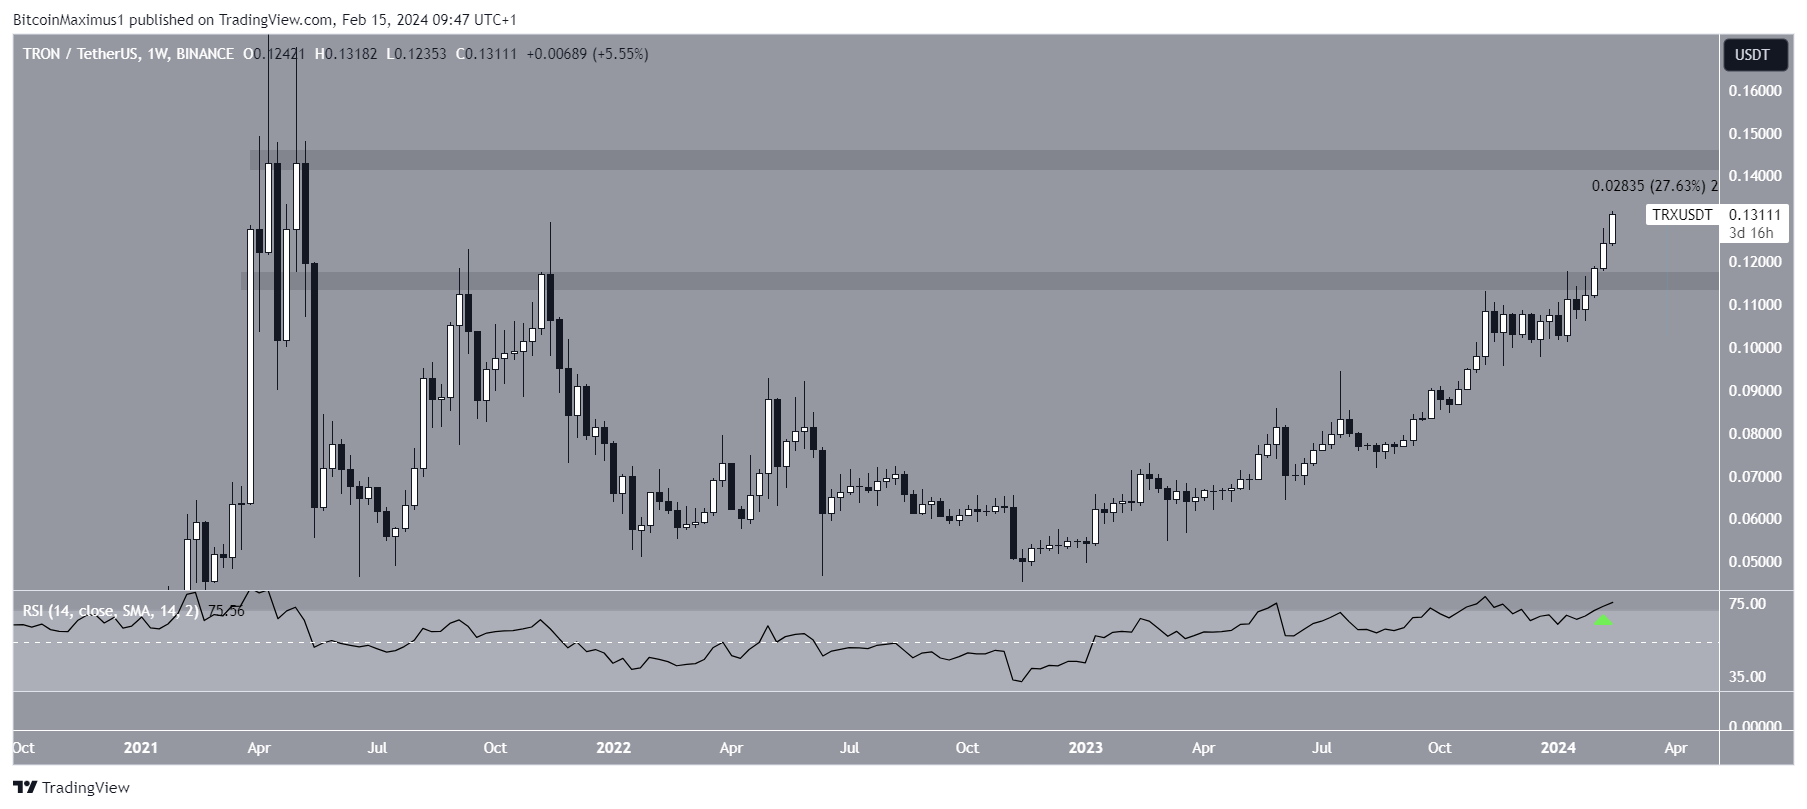 TRX/USDT Weekly Chart. Source: TradingView
The weekly Relative Strength Index (RSI) gives a bullish reading. The RSI is a momentum indicator traders use to evaluate whether a market is overbought or oversold and whether to accumulate or sell an asset.
Readings above 50 and an upward trend suggest that bulls still have an advantage, while readings below 50 indicate the opposite. The RSI is increasing and just moved above 70, both signs of a bullish trend.
What Are Analysts Saying?
Cryptocurrency traders and analysts on X positively view the future TRX trend.
MammonnTrading tweeted a TRX price chart, stating that it is one of the best-looking cryptocurrencies.
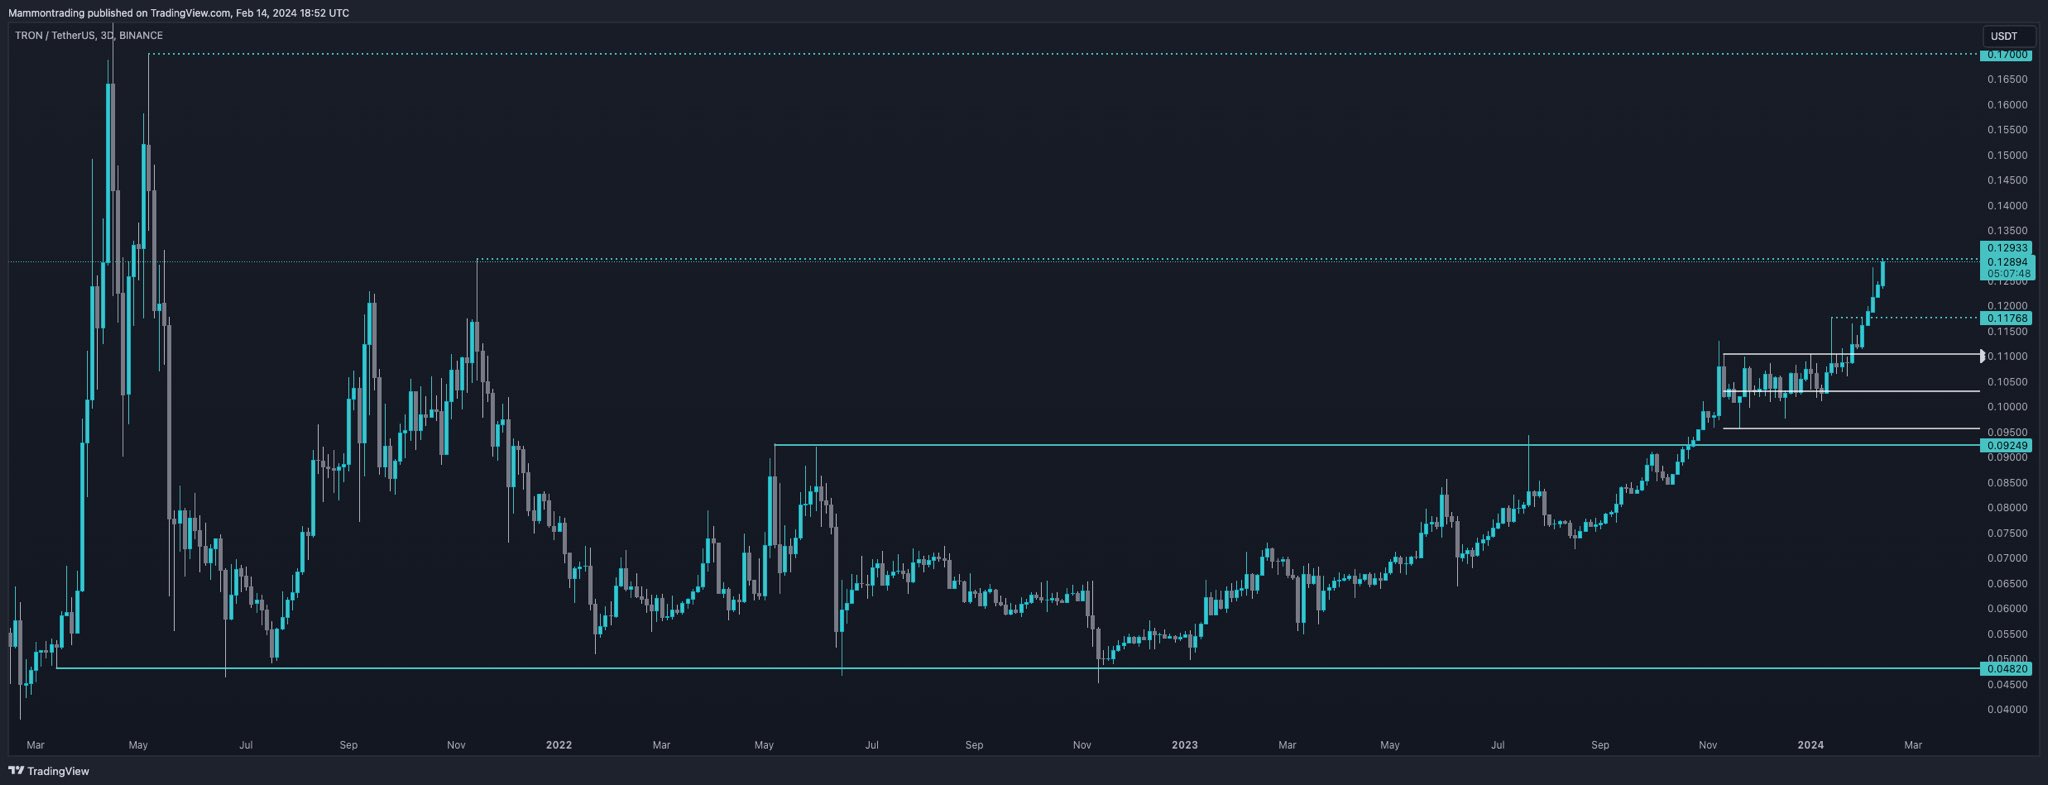 TRX/USDT Weekly Chart. Source: X
He also believes the TRX price will continue increasing.
Still funny that i see literally no single mention of Trx on my timeline although the chart is an absolute beauty. This has been in an
only mode since November 22 while rest of the market was still shitting itself. Strongest
out there, only 40% left from reaching it’s ath. All OG crypto figures are gone, Justin being the only one left wasn’t in my playbook tbh” Mammon stated.
Read More: 7 Best TRON Wallets for Storing TRX Tokens
TRX Price Prediction: When Will New Highs Be Reached?
The daily time frame chart supports the continuation of the increase because of the price action and wave count.
The price action shows that TRX has increased alongside an ascending support trend line since December 2022. In September 2023, it created another, steeper ascending support trend line.
Read More: What Is TRON (TRX) and How Does It Work?
According to the wave count, it is likely that this steeper count is wave three in a five-wave upward movement.
Technical analysts utilize the Elliott Wave theory to ascertain the trend’s direction by studying recurring long-term price patterns and investor psychology.
Giving waves one and three a 1:1.61 ratio can lead to a high of $0.140, 10% above the current price. This would take TRX close to its 2021 top of $0.181.
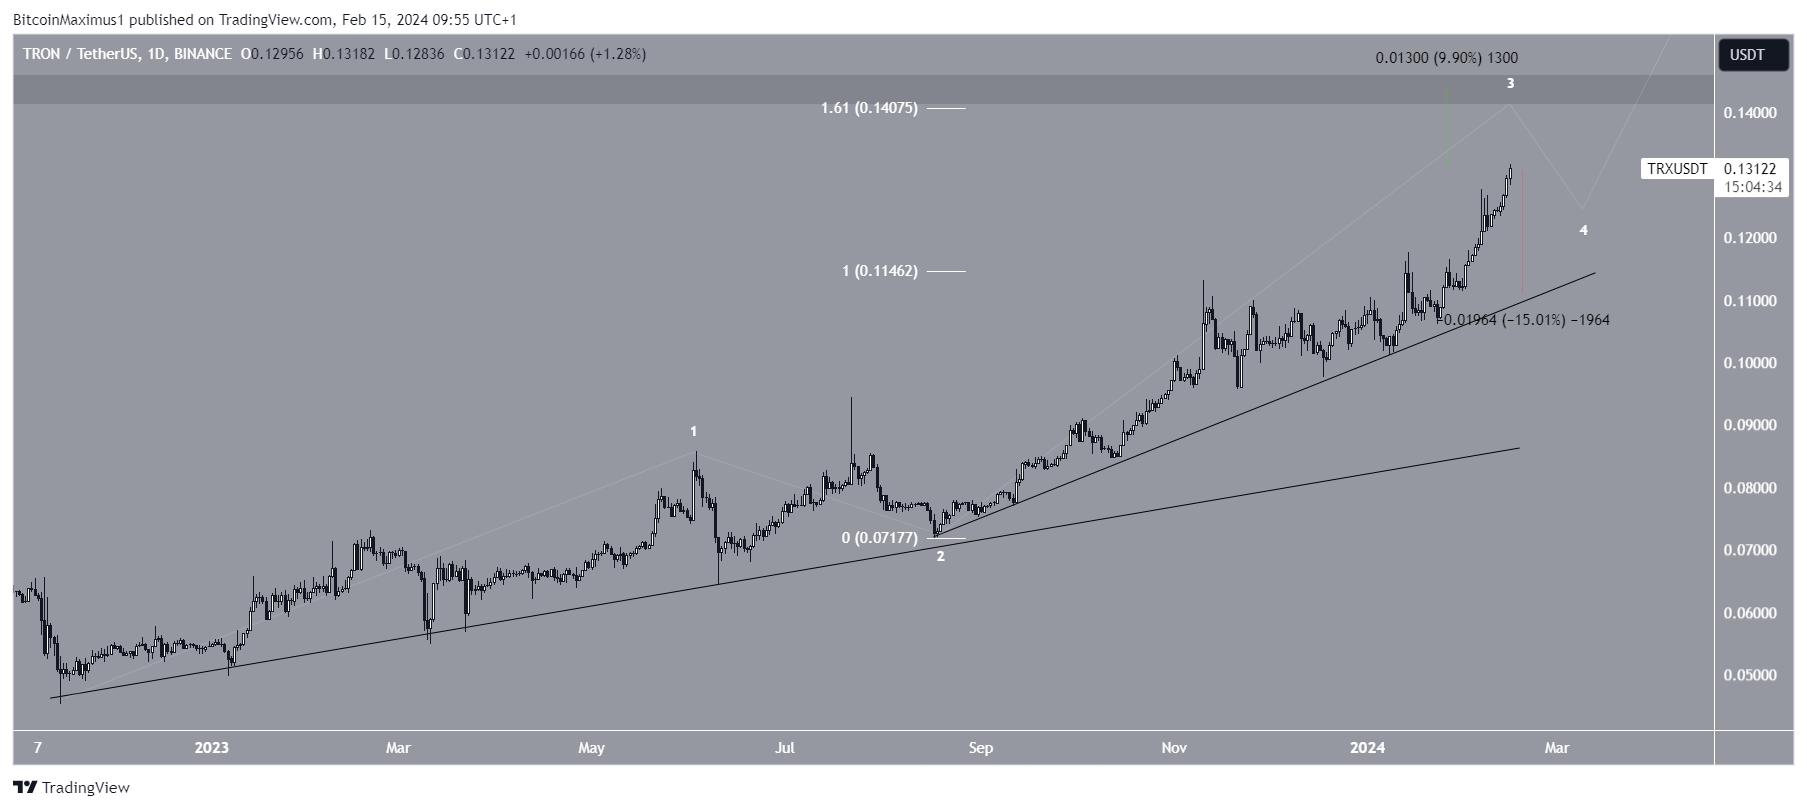 TRX/USDT Daily Chart. Source: TradingView
Despite the bullish TRX price prediction, a sudden rejection at the current level can trigger a 15% drop to the ascending support trend line at $0.110.
For BeInCrypto‘s latest crypto market analysis, click here.
The post TRON (TRX) Price Breaks $0.13 Barrier: Hits 1000-Day High appeared first on BeInCrypto.


 English (US) ·