
 3 weeks ago
50
3 weeks ago
50
TSMC stock is caught in a sharp technical correction despite a compelling fundamental narrative. Trading at $398.37, TSM sits below key moving averages with deteriorating momentum. Yet record Q2 results and accelerating AI-driven demand create tension between a weakening chart and a strengthening business.
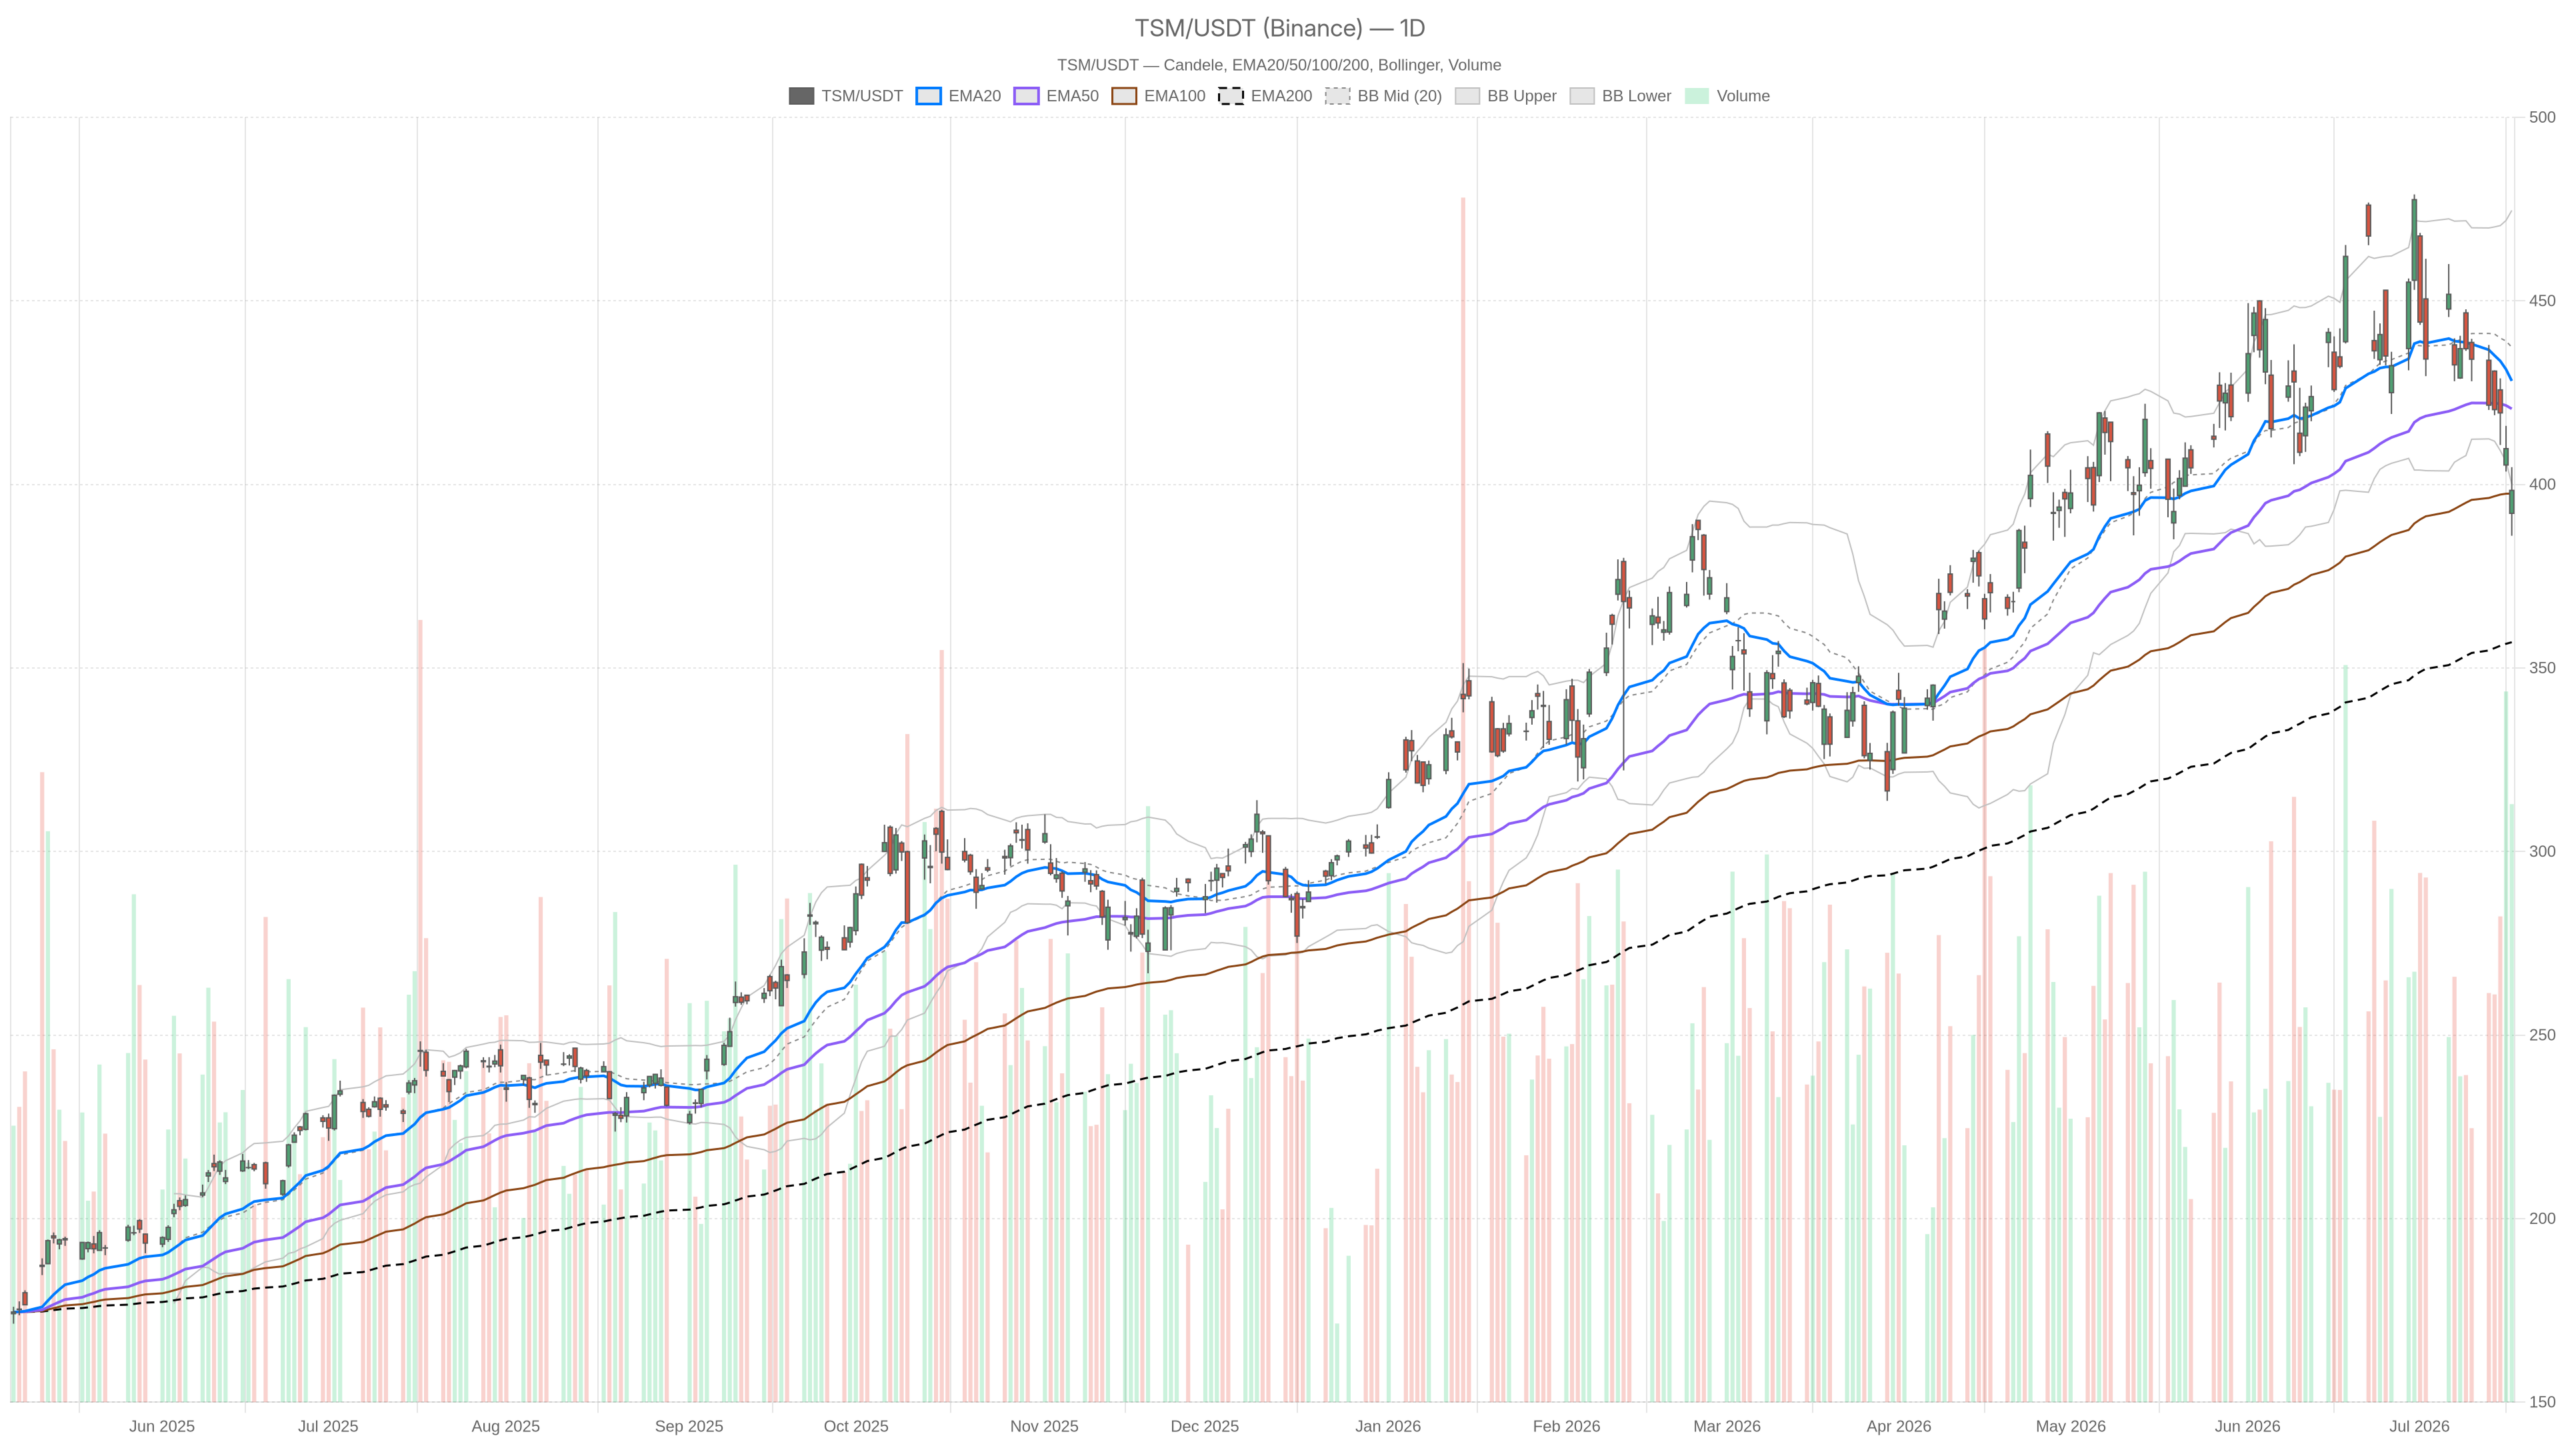 TSM — daily chart with candlesticks, EMA20/EMA50 and volume.
Key takeaways
- TSMC stock closed at $398.37, well below its EMA20 ($428.20) and EMA50 ($420.60)
- Daily RSI at 39.11 approaches oversold territory with no bullish divergence visible
- TSMC has committed $265 billion total to U.S. investments, signaling high-conviction AI demand visibility
- Daily ATR of $20.64 warns that wide swings in either direction remain within normal range
- Critical support sits at $388.03 (daily S1); a break below opens the path toward the $357 EMA200 region
Daily Bias: Bearish Pressure Dominates TSMC Stock
TSMC stock’s daily chart is unambiguously bearish. Price closed at $398.37, well below the EMA20 at $428.20 and the EMA50 at $420.60.
Price is hugging the lower Bollinger Band, whose floor sits at $400.10 — barely above the close. That proximity signals sustained selling pressure rather than consolidation for a bounce.
Crucially, the daily RSI of 39.11 confirms the weakness. It has not reached oversold territory yet, but it is close. No bullish divergence is visible. Momentum is simply declining alongside price.
In addition, the MACD reinforces the picture. The MACD line is at -4.21 and the signal sits at 1.59. The histogram has widened to -5.80. That is an accelerating bearish crossover, not a fading one.
Meanwhile, the daily pivot point sits at $396.36. R1 is at $406.71 and S1 at $388.03. The close above the pivot is marginally constructive on a session basis. However, with price far below the Bollinger midband ($437.37) and both key EMAs, the regime correctly reads as neutral. That label arguably understates the downside pressure currently in play.
Notably, the EMA200 at $357.01 provides longer-term structural support significantly below current levels. That gap suggests the medium-term uptrend is not broken. But the stock has given up substantial ground from its highs.
Hourly Timeframe Confirms the Bearish Case
The hourly chart deepens the bearish case for TSMC stock. Price at $398.33 trades below all three key EMAs in a textbook bearish alignment.
On the 1-hour chart, the EMA20 sits at $407.25, the EMA50 at $418.36, and the EMA200 at $429.64. That triple stack of declining EMAs above price leaves no overhead support. Only resistance exists at every moving average level.
At the same time, hourly RSI at 33.52 is flirting with oversold conditions. In isolation, this could suggest a short-term bounce is approaching. However, the MACD shows a line of -6.95 against a signal of -6.50. The histogram at -0.46 reflects only a slight slowing of bearish momentum. It is not a reversal. The selling is not done; it is merely pausing.
Still, the 1H Bollinger Band lower boundary at $391.99 marks the next meaningful technical floor. Price is drifting toward it without a clear catalyst to reverse. The pivot structure remains tight: R1 at $399.71 and S1 at $396.70. TSM closed the last 1H candle pinned between these two levels. This suggests very short-term indecision within a larger bearish structure.
15-Minute Chart: A Flicker of Stabilization
TSMC stock shows tentative stabilization on the 15-minute chart. However, no meaningful bullish reversal is taking shape.
The 15m MACD histogram has turned fractionally positive at +0.04. The MACD line at -1.77 has crossed marginally above its signal at -1.81. This is a micro-level development, not a trend change. At best, it suggests the immediate selling impulse has briefly exhausted itself.
Meanwhile, the 15m RSI at 45.80 is neutral. That is consistent with a market that has stabilized momentarily after a drop. Price sits just below the 15m EMA20 at $399.23, with the EMA50 further above at $403.53.
In this context, the 15-minute timeframe is useful only for execution. It says the stock is not in freefall at this precise moment. But the higher-timeframe bearish bias remains fully intact.
The Bullish Scenario: Fundamentals as the Catalyst
The bullish case for TSMC stock rests on fundamentals rather than technicals. The company’s AI-driven demand outlook has rarely looked stronger.
There is a credible bull case grounded in the news flow. TSMC’s CFO Wendell Huang confirmed to CNBC that the company is accelerating its Arizona factory buildout. The goal is to capitalize on what he called the AI megatrend. TSMC is adding $100 billion to its Arizona investments. That brings total U.S. spending commitments to $265 billion. This is not a company hedging its bets. It is a company with high-conviction visibility into future demand.
Beyond the capital commitment, TSMC reported record Q2 results and raised its 2026 outlook. The 2nm and A14 roadmap leadership positions the company at the frontier of chip manufacturing. It directly supplies the data center infrastructure build-out driving the AI supercycle.
However, for the bullish scenario to take hold technically, TSM would need to reclaim and hold the daily pivot at $396.36. It must then push above $406.71 (R1) with volume conviction. A move back above the EMA20 at $428.20 would confirm a genuine trend recovery. Earnings momentum and continued AI capex announcements are the likely catalysts.
The Bearish Scenario: What Would Invalidate the Recovery
The bearish scenario for TSMC stock hinges on a break below $388.03 daily S1 support. That would open a path toward significantly lower levels.
If TSM loses the $388.03 S1 level, the next meaningful floor becomes the $357 EMA200 region. That is a significant distance below. A daily ATR of $20.64 means these moves can happen quickly within a single session.
Moreover, the critical invalidation level for any bull thesis is a sustained break below $388. At that point, the burden of proof rests firmly with the buyers to demonstrate control. Given the daily MACD histogram at -5.80 and the hourly’s continued bearish regime, sellers currently hold the advantage.
In contrast to the bullish news backdrop, the technical picture has deteriorated materially. The disconnect between strong fundamentals and a weakening chart is the central risk for anyone entering long positions at current levels.
Positioning and Volatility Outlook for TSMC Stock
TSMC stock presents a complex setup heading into the coming sessions. The daily trend is under pressure and elevated volatility widens the risk in both directions.
Overall, the hourly timeframe is bearish. Only the shortest timeframe shows any tentative stabilization. The ATR of $20.64 on the daily warns that wide swings remain fully within normal range.
The fundamental case for TSMC stock is arguably stronger than ever. It is anchored by a $265 billion U.S. investment commitment and record earnings. But technical positioning suggests the market is still working through a corrective phase.
Therefore, patience is warranted. Waiting for a confirmed reclaim of the $406–$428 zone before adding exposure would reduce the risk of catching a falling knife. The long-term story remains compelling, but the entry timing is not yet confirmed by the chart.
FAQ
What is the current price of TSMC stock?
TSMC stock closed at $398.37 on July 17, trading below its EMA20 ($428.20) and EMA50 ($420.60) on the daily timeframe.
Is TSMC stock technically bullish or bearish right now?
The technical picture is bearish across both daily and hourly timeframes. The daily RSI at 39.11 is declining without bullish divergence, and the MACD shows an accelerating bearish crossover with a histogram reading of -5.80.
What are the key support levels for TSMC stock?
Key support levels include the daily pivot at $396.36, S1 at $388.03, and the 1H lower Bollinger Band at $391.99. A sustained break below $388 would expose the EMA200 at $357.01.
Why is TSMC investing so heavily in the United States?
TSMC is accelerating its Arizona factory buildout to capitalize on what CFO Wendell Huang called the AI megatrend. The company’s total U.S. spending commitments now stand at $265 billion, reflecting high-conviction visibility into future AI-driven demand.
Disclaimer: This article is for informational purposes only and does not constitute financial advice, an investment recommendation, or a solicitation to buy or sell any financial instrument or cryptocurrency. The analysis provided is not indicative of future results. Investing in crypto assets and financial markets carries a high risk of capital loss. Always do your own research (DYOR) and consult a qualified financial advisor before making any decision.
Article produced with the assistance of artificial intelligence and reviewed by the editorial team.






 English (US) ·