
 2 hours ago
12
2 hours ago
12

Walmart Inc. stock is trading in a tight technical balance just days before the retailer’s fiscal second-quarter earnings report, due August 20. Price is hugging major resistance while shorter-term momentum leans bullish but shows fatigue. This tension is unlikely to resolve until the earnings catalyst hits the tape.
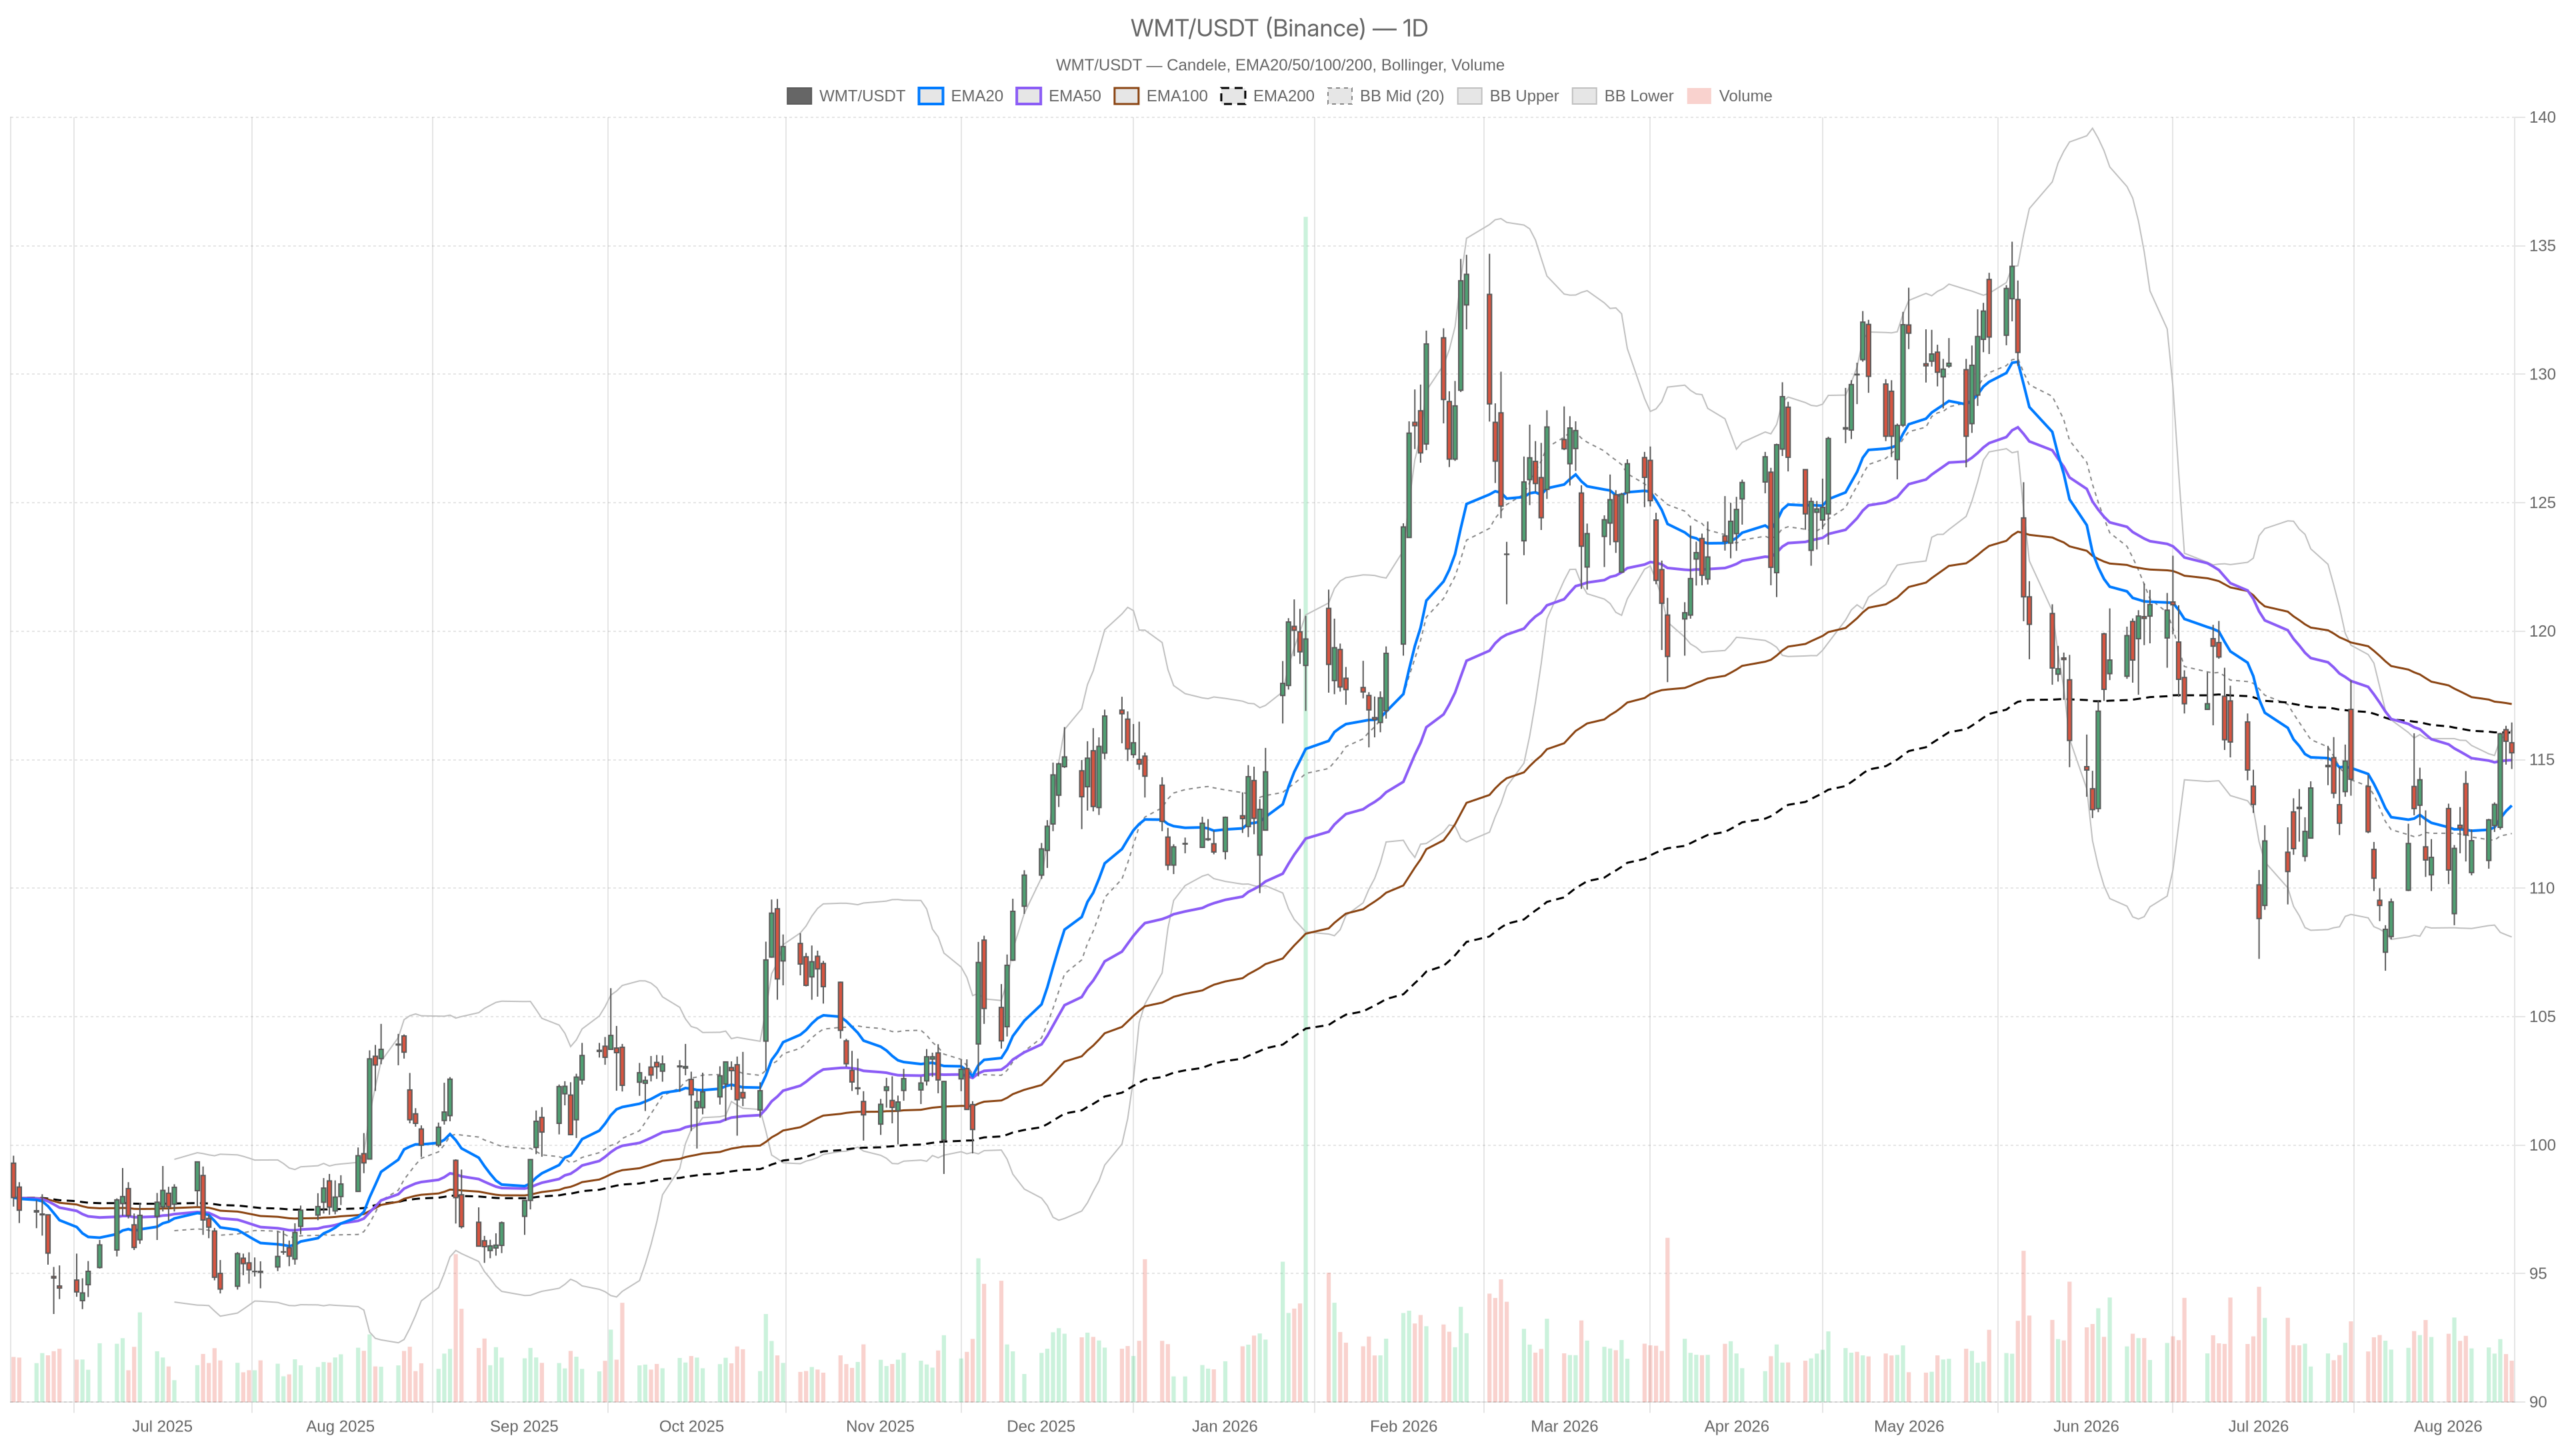 WMT — daily chart with candlesticks, EMA20/EMA50 and volume.
Key takeaways
- Walmart Inc. stock closed at $115.27, below the 200-day EMA at $116.05.
- Daily RSI14 reads 56.51, while the hourly RSI14 stands at a more bullish 60.51.
- The 15-minute chart is effectively flat, with MACD line and signal both at 0.04.
- BofA reiterated a Buy rating on Walmart ahead of the August 20 earnings report.
- A decisive move above $116.27 or below $114.46 would define the next trend.
Walmart Inc. Stock Daily Structure Still Capped by the 200-Day Average
Walmart Inc. stock remains capped below its 200-day average, which keeps the daily regime classified as neutral. On the daily chart, WMT closed at $115.27. This sits above the 20-day EMA at $113.22 and the 50-day EMA at $114.98. However, price remains below the 200-day EMA at $116.05, a level that has capped the broader recovery.
Daily Trend Indicators Lean Bullish
RSI14 at 56.51 reflects moderate bullish momentum without reaching overbought territory. Meanwhile, MACD shows the line at 0.16 above its signal at -0.54. The histogram of 0.70 points to strengthening upside momentum.
Volatility Context and Pivot Levels
The stock is pressing against the upper Bollinger Band at 116.16, with the mid-band at 112.13. This suggests the rally has room but is testing its own ceiling. Meanwhile, ATR14 stands at 2.56, meaning volatility is elevated but not extreme heading into the report.
Daily pivot analysis puts the pivot point at 115.45, with resistance at $116.27 and support at $114.46. Price currently sits just under the pivot. That is a subtle sign near-term buyers have not fully committed yet. Overall, the daily trend is improving but remains unconfirmed until the 200-day EMA and the upper Bollinger Band are cleared decisively.
Hourly Momentum Confirms the Bias, With a Caveat
The 1-hour chart supports a bullish bias, but its MACD already shows early signs of momentum fatigue. EMA stacking is bullish. The 20-hour EMA sits at 114.95, the 50-hour at 113.82, and the 200-hour at 113.19. All three remain below spot price.
RSI14 on this timeframe reads 60.51, comfortably bullish without stretching. Therefore, intraday buyers remain in control for now. However, the MACD tells a slightly different story. The line at 0.57 has dipped below the signal at 0.69, producing a negative histogram of -0.13. This is a mild warning that upside momentum is cooling. Still, the broader trend structure stays intact.
Bollinger Bands on the hourly chart are notably tight. The upper band sits at 115.88 and the lower band at 114.75, around a mid-point of 115.32. That compression, combined with an ATR14 of just 0.59, reflects a market waiting for a catalyst. Price is essentially glued to the hourly pivot at 115.31.
Execution Context Turns Flat on the 15-Minute Chart
The 15-minute chart shows no directional push ahead of the earnings report. On this timeframe, used strictly for execution context, the picture turns flat. RSI14 sits at 47.58, close to neutral. MACD shows the line and signal both at 0.04 with a zero histogram.
Price is trading right around its own pivot at 115.31. It sits between the 20-period EMA at 115.37 and the 50-period EMA at 115.20. ATR14 has compressed to just 0.17. This confirms a low-volatility consolidation phase rather than a directional move.
Three Timeframes Fail to Align Ahead of Earnings
The three timeframes are not fully aligned, leaving Walmart Inc. stock in a classic pre-catalyst setup. In short, the daily trend is constructive but unconfirmed below its 200-day average. The hourly regime is technically bullish, yet it already shows early signs of momentum fatigue. In contrast, the 15-minute tape is essentially flat.
Traders appear reluctant to commit meaningful directional risk until Walmart’s earnings release on August 20 provides a clearer signal. Notably, this earnings date is drawing significant attention across Wall Street. BofA reiterated a Buy rating on Walmart, pointing to metrics beyond the headline U.S. comparable-sales figure.
At the same time, coverage from The Motley Fool describes Walmart stock as “sluggish” this year. That followed a prior run that had it outperforming the broader market. Investors favored its perceived safety and reliability as a Dividend King with 53 consecutive years of dividend increases.
Bullish Scenario: Clearing the 200-Day Average
For bulls, the path is clear: a decisive daily close above the 200-day average would confirm the improving structure. Specifically, price would need to clear the 200-day EMA at $116.05 and then break through the daily R1 at $116.27. That sequence would also validate the bullish hourly EMA stack already in place.
If Walmart Inc. stock can clear the upper daily Bollinger Band near 116.16 on strong volume, that would signal a durable move higher. It would point to acceptance rather than a brief spike. A supportive earnings report could provide exactly that trigger. Notably, that report would need to satisfy the deeper metrics BofA has flagged beyond comparable sales.
Bearish Scenario: Rejection at Resistance
On the downside, a bearish outcome would likely begin with rejection at or near the 200-day EMA and the upper Bollinger Band. That would probably be followed by a slide back through the hourly EMA20 at 114.95. A subsequent break below the daily S1 at $114.46 would invalidate the near-term bullish tilt.
It would also reinforce the “sluggish” narrative that has followed the stock for much of this year. In that scenario, the negative MACD histogram already visible on the hourly chart would likely deepen. That would confirm momentum has shifted away from buyers.
Overall, Walmart Inc. stock sits at a technical crossroads just days before a pivotal earnings report. Positioning into August 20 should account for the fact that volatility is likely to expand sharply once results are released. Volatility is currently compressed on the shorter timeframes. Given the mixed signals across the daily, hourly, and 15-minute charts, uncertainty remains elevated. Ultimately, the earnings reaction itself will likely determine the stock’s next directional move.
FAQ
When does Walmart report its fiscal second-quarter earnings?
Walmart reports its fiscal second-quarter earnings on August 20. This date is drawing significant attention across Wall Street as a potential catalyst for the stock’s next directional move.
What is the key resistance level for Walmart Inc. stock?
The 200-day EMA at $116.05 is the key resistance level. The daily R1 at $116.27 and the upper Bollinger Band near $116.16 sit just above it, forming a closely watched resistance cluster.
What is the key support level to watch?
The daily S1 at $114.46 is a key support level. A break below it would invalidate the near-term bullish tilt, while the hourly EMA20 at $114.95 acts as an earlier warning level.
Is Walmart Inc. stock bullish or bearish right now?
The daily regime is classified as neutral. The hourly chart leans bullish, but its MACD already shows early signs of momentum fatigue. In contrast, the 15-minute chart is essentially flat.
Disclaimer: This article is for informational purposes only and does not constitute financial advice, an investment recommendation, or a solicitation to buy or sell any financial instrument or cryptocurrency. The analysis provided is not indicative of future results. Investing in crypto assets and financial markets carries a high risk of capital loss. Always do your own research (DYOR) and consult a qualified financial advisor before making any decision.
Article produced with the assistance of artificial intelligence and reviewed by the editorial team.







 English (US) ·