
 2 months ago
51
2 months ago
51
WhiteBIT Coin (WBT) cleared the $58.70 daily channel resistance on April 30, jumping more than 5.8% as buyers reclaimed control. The breakout opens a direct path toward the all-time high at $64.40.
The token trades at $57.10 according to CoinGecko, with daily RSI rising and MACD turning bullish. Lower-timeframe charts show extended momentum that may require a brief cooldown before WBT can attack record territory.
Daily WhiteBIT Chart Breaks Out Toward Record High
On the daily chart, WBT spent most of 2026 inside a horizontal parallel channel between $46 and $58.70. The midline near $53 aligns with the 0.382 Fibonacci retracement and has acted as both a floor and a ceiling during repeated tests, as marked by blue circles on the chart.
The April 30 candle pushed the price up 5.83%, breaking decisively above the channel top and opening room toward the record high at $64.40. A confirmed close above $58.70 would turn previous resistance into support.
Volume that had contracted through April started to expand on the breakout candle, while RSI bounced from its own ascending trendline and now reads 62 with room to climb. MACD has flipped green again after a brief bearish cross.
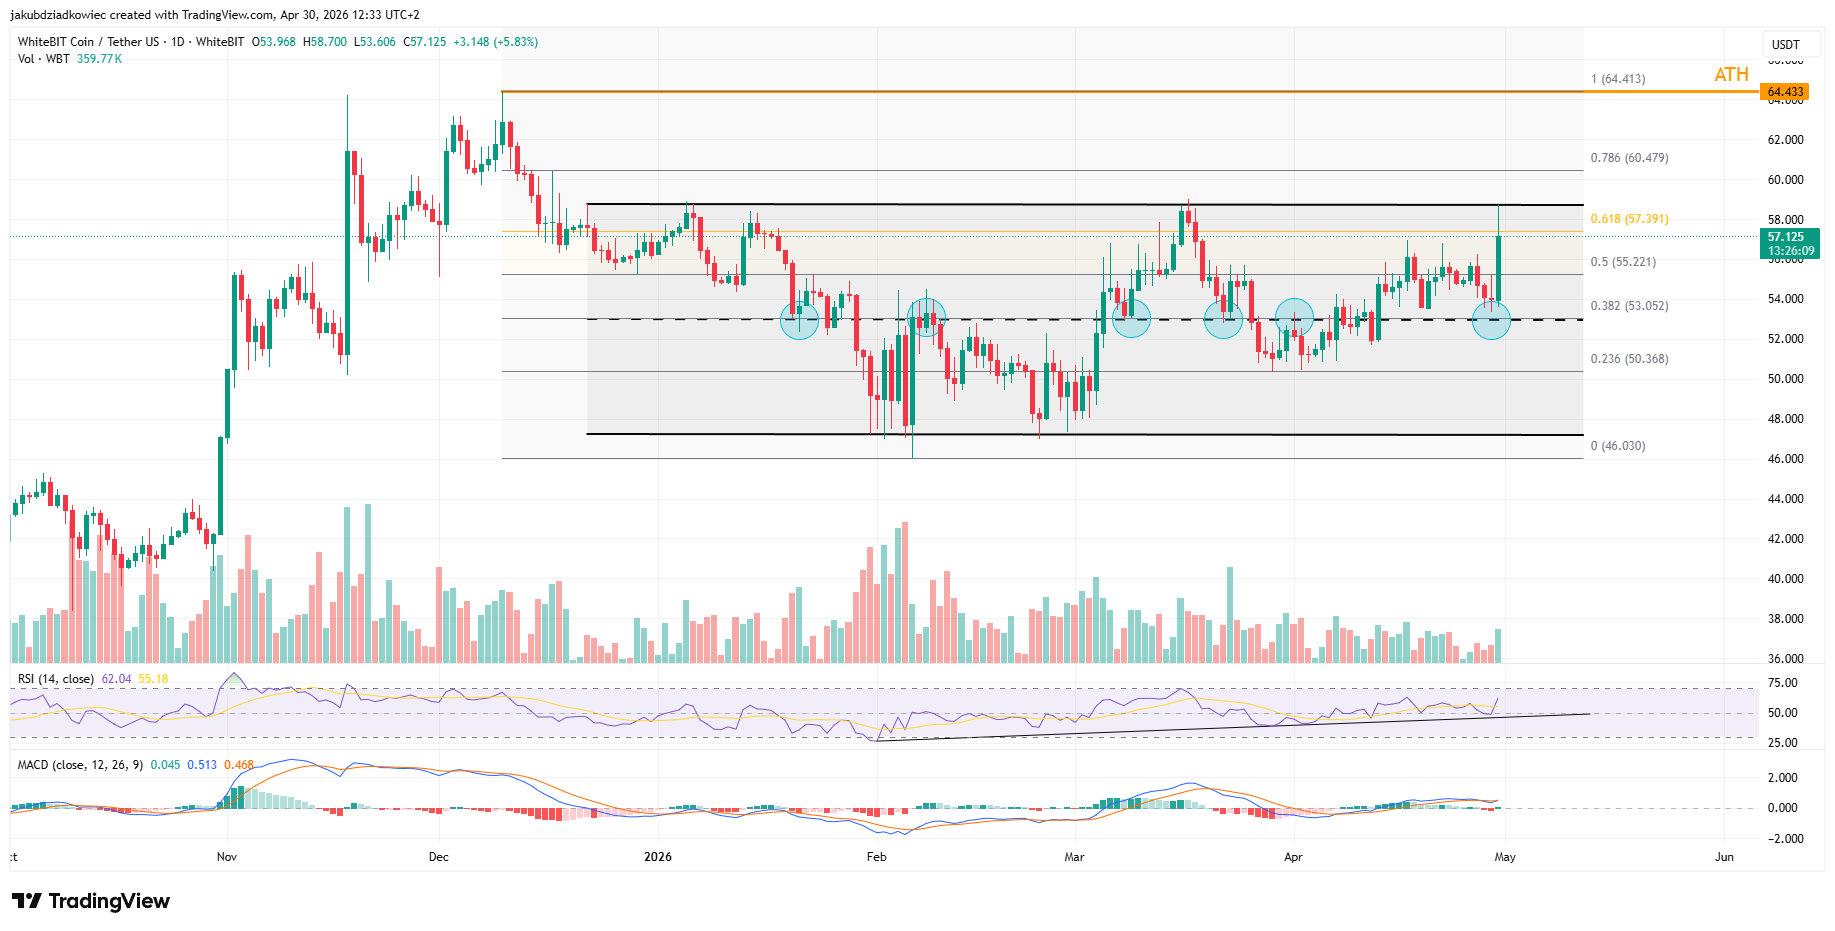 WBT daily chart / Source: Tradingview
Fundamentals back the technical picture. WBT recently joined S&P Dow Jones Indices, gained a Kraken listing, and surpassed $12 billion in market value, placing it among the most liquid altcoins with ATH potential heading into May.
A failure to hold $58.70 would push the price back inside the channel, with $53.05 as the next major support and the post-unlock zone as a deeper safety net.
4-Hour Channel and Volatility Expansion Confirm Buyer Strength
The 4-hour chart shows WBT trading inside an ascending parallel channel that has guided price action since early April. Buyers have repeatedly defended the lower band near $51, while the upper band sits around $58 and was tagged at $58.39 during the latest impulse.
Volume across the 4-hour timeframe climbed alongside the latest leg up, suggesting active accumulation rather than exhausted speculation. The breakout candle produced the largest green-volume bar of the month.
The Bollinger Band Width Percentile (BBWP) flipped red, marking a high-volatility expansion phase. Blue contraction readings on April 24, 25, and 26 preceded the move, replicating the classic squeeze pattern that tends to precede large directional swings.
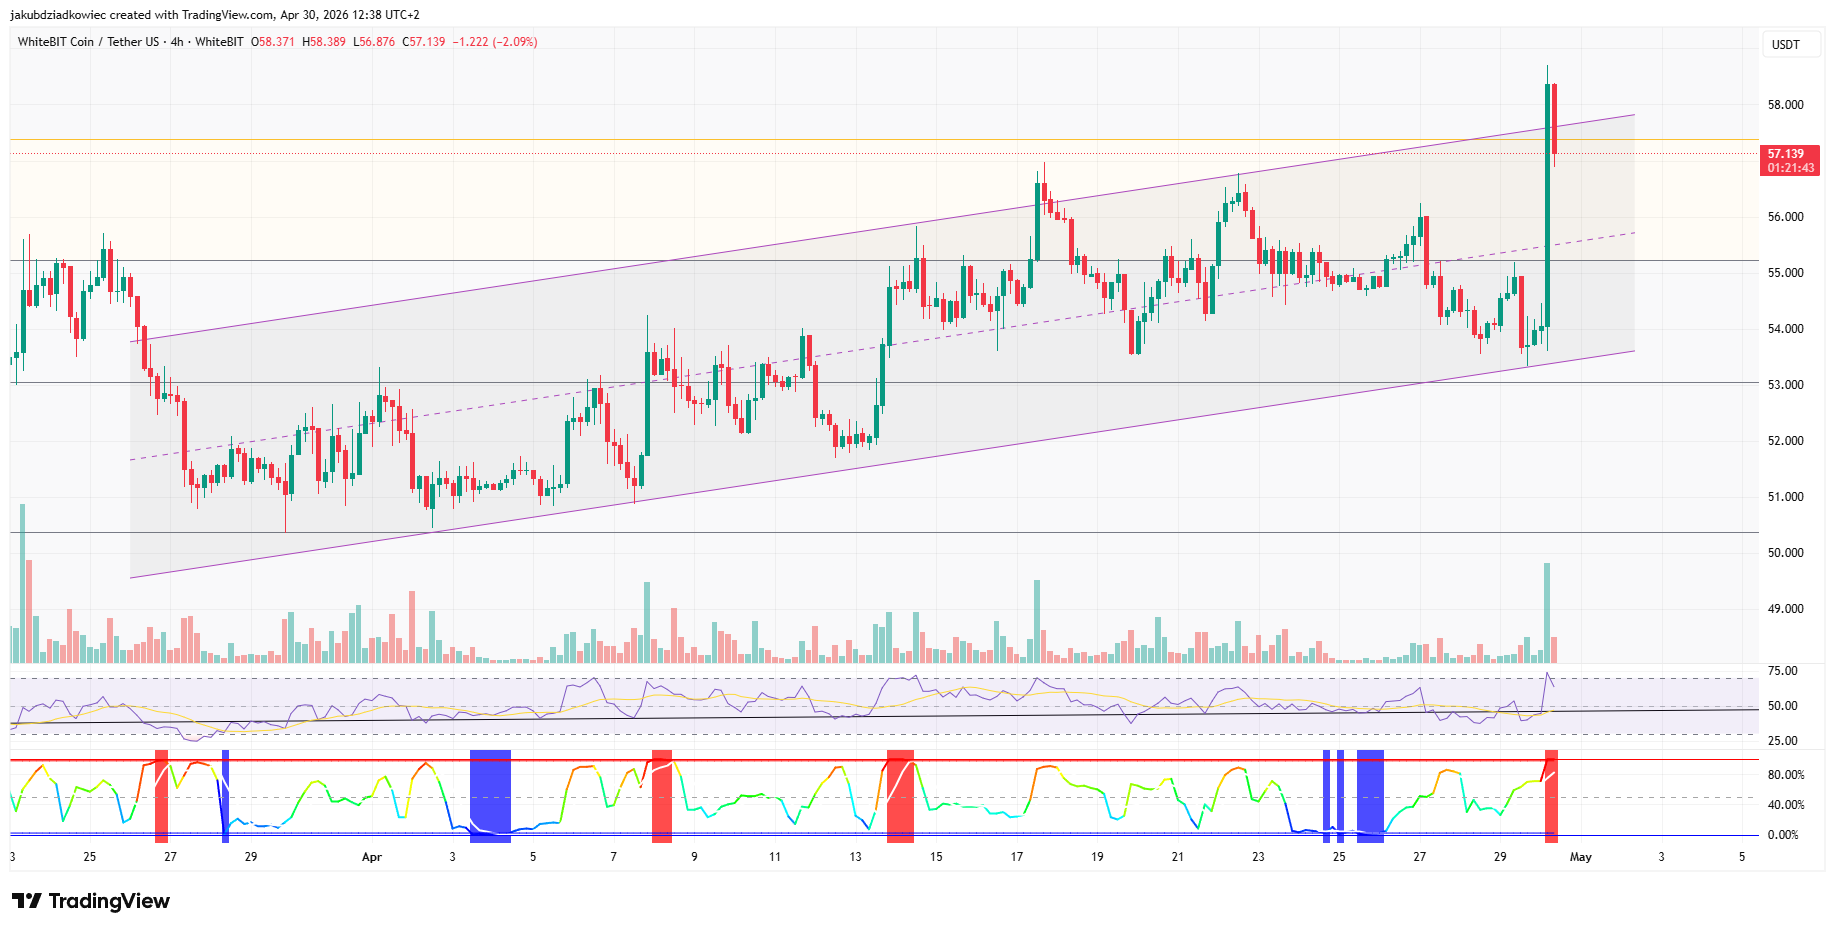 WBT 4-hourly chart / Source: Tradingview
1H Chart Shows Overbought Conditions, Analyst Eyes $56.45 Retest
The bullish setup on higher timeframes contrasts with stretched conditions on the 1-hour chart published by analyst @AIRewardrop. Price spiked to $58.19 in a near-vertical move, leaving RSI at 84.47 in deep overbought territory, while higher-timeframe EMAs remain stacked above price in bullish order.
The same analysis flagged that price has detached from the 1H EMA24 and VWAP, suggesting a mean reversion would help reset momentum before any sustained continuation.
“An RSI reading of 84.47 confirms aggressive momentum but signals extreme overextension. A cooldown period or sideways consolidation is needed to reset this oscillator before entering.”
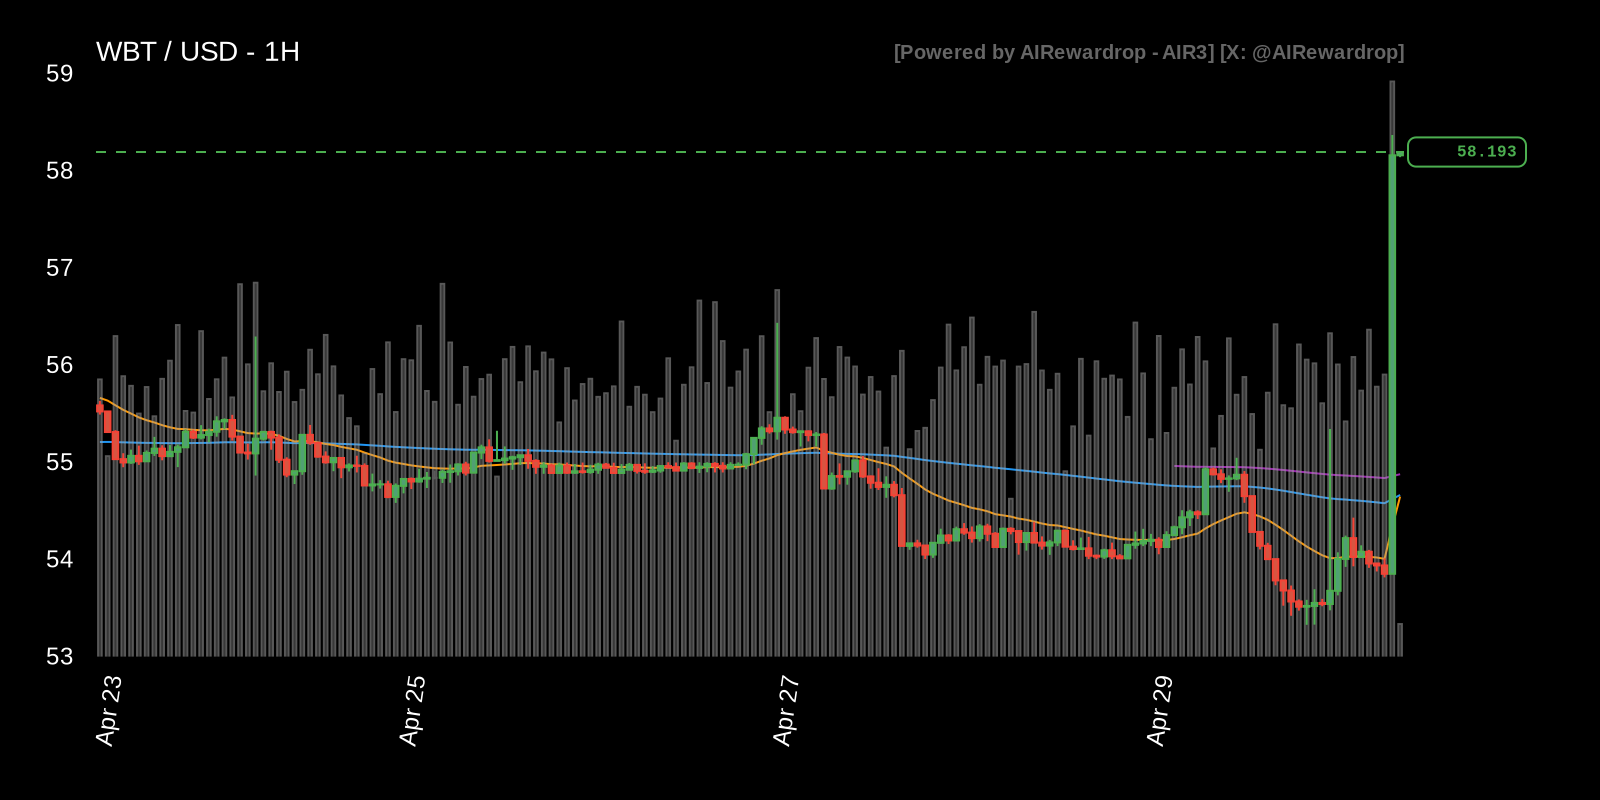 WBT 1-hourly chart / Source: X
The analyst pointed to $56.45 as the former pivot high that should now act as support, with $54.50 marking structural invalidation. A retrace toward those levels would offer a cleaner entry while keeping the broader bullish forecast intact.
The post WhiteBIT Coin Nears All-Time High After Daily Channel Breakout appeared first on BeInCrypto.


 English (US) ·