
 3 months ago
54
3 months ago
54
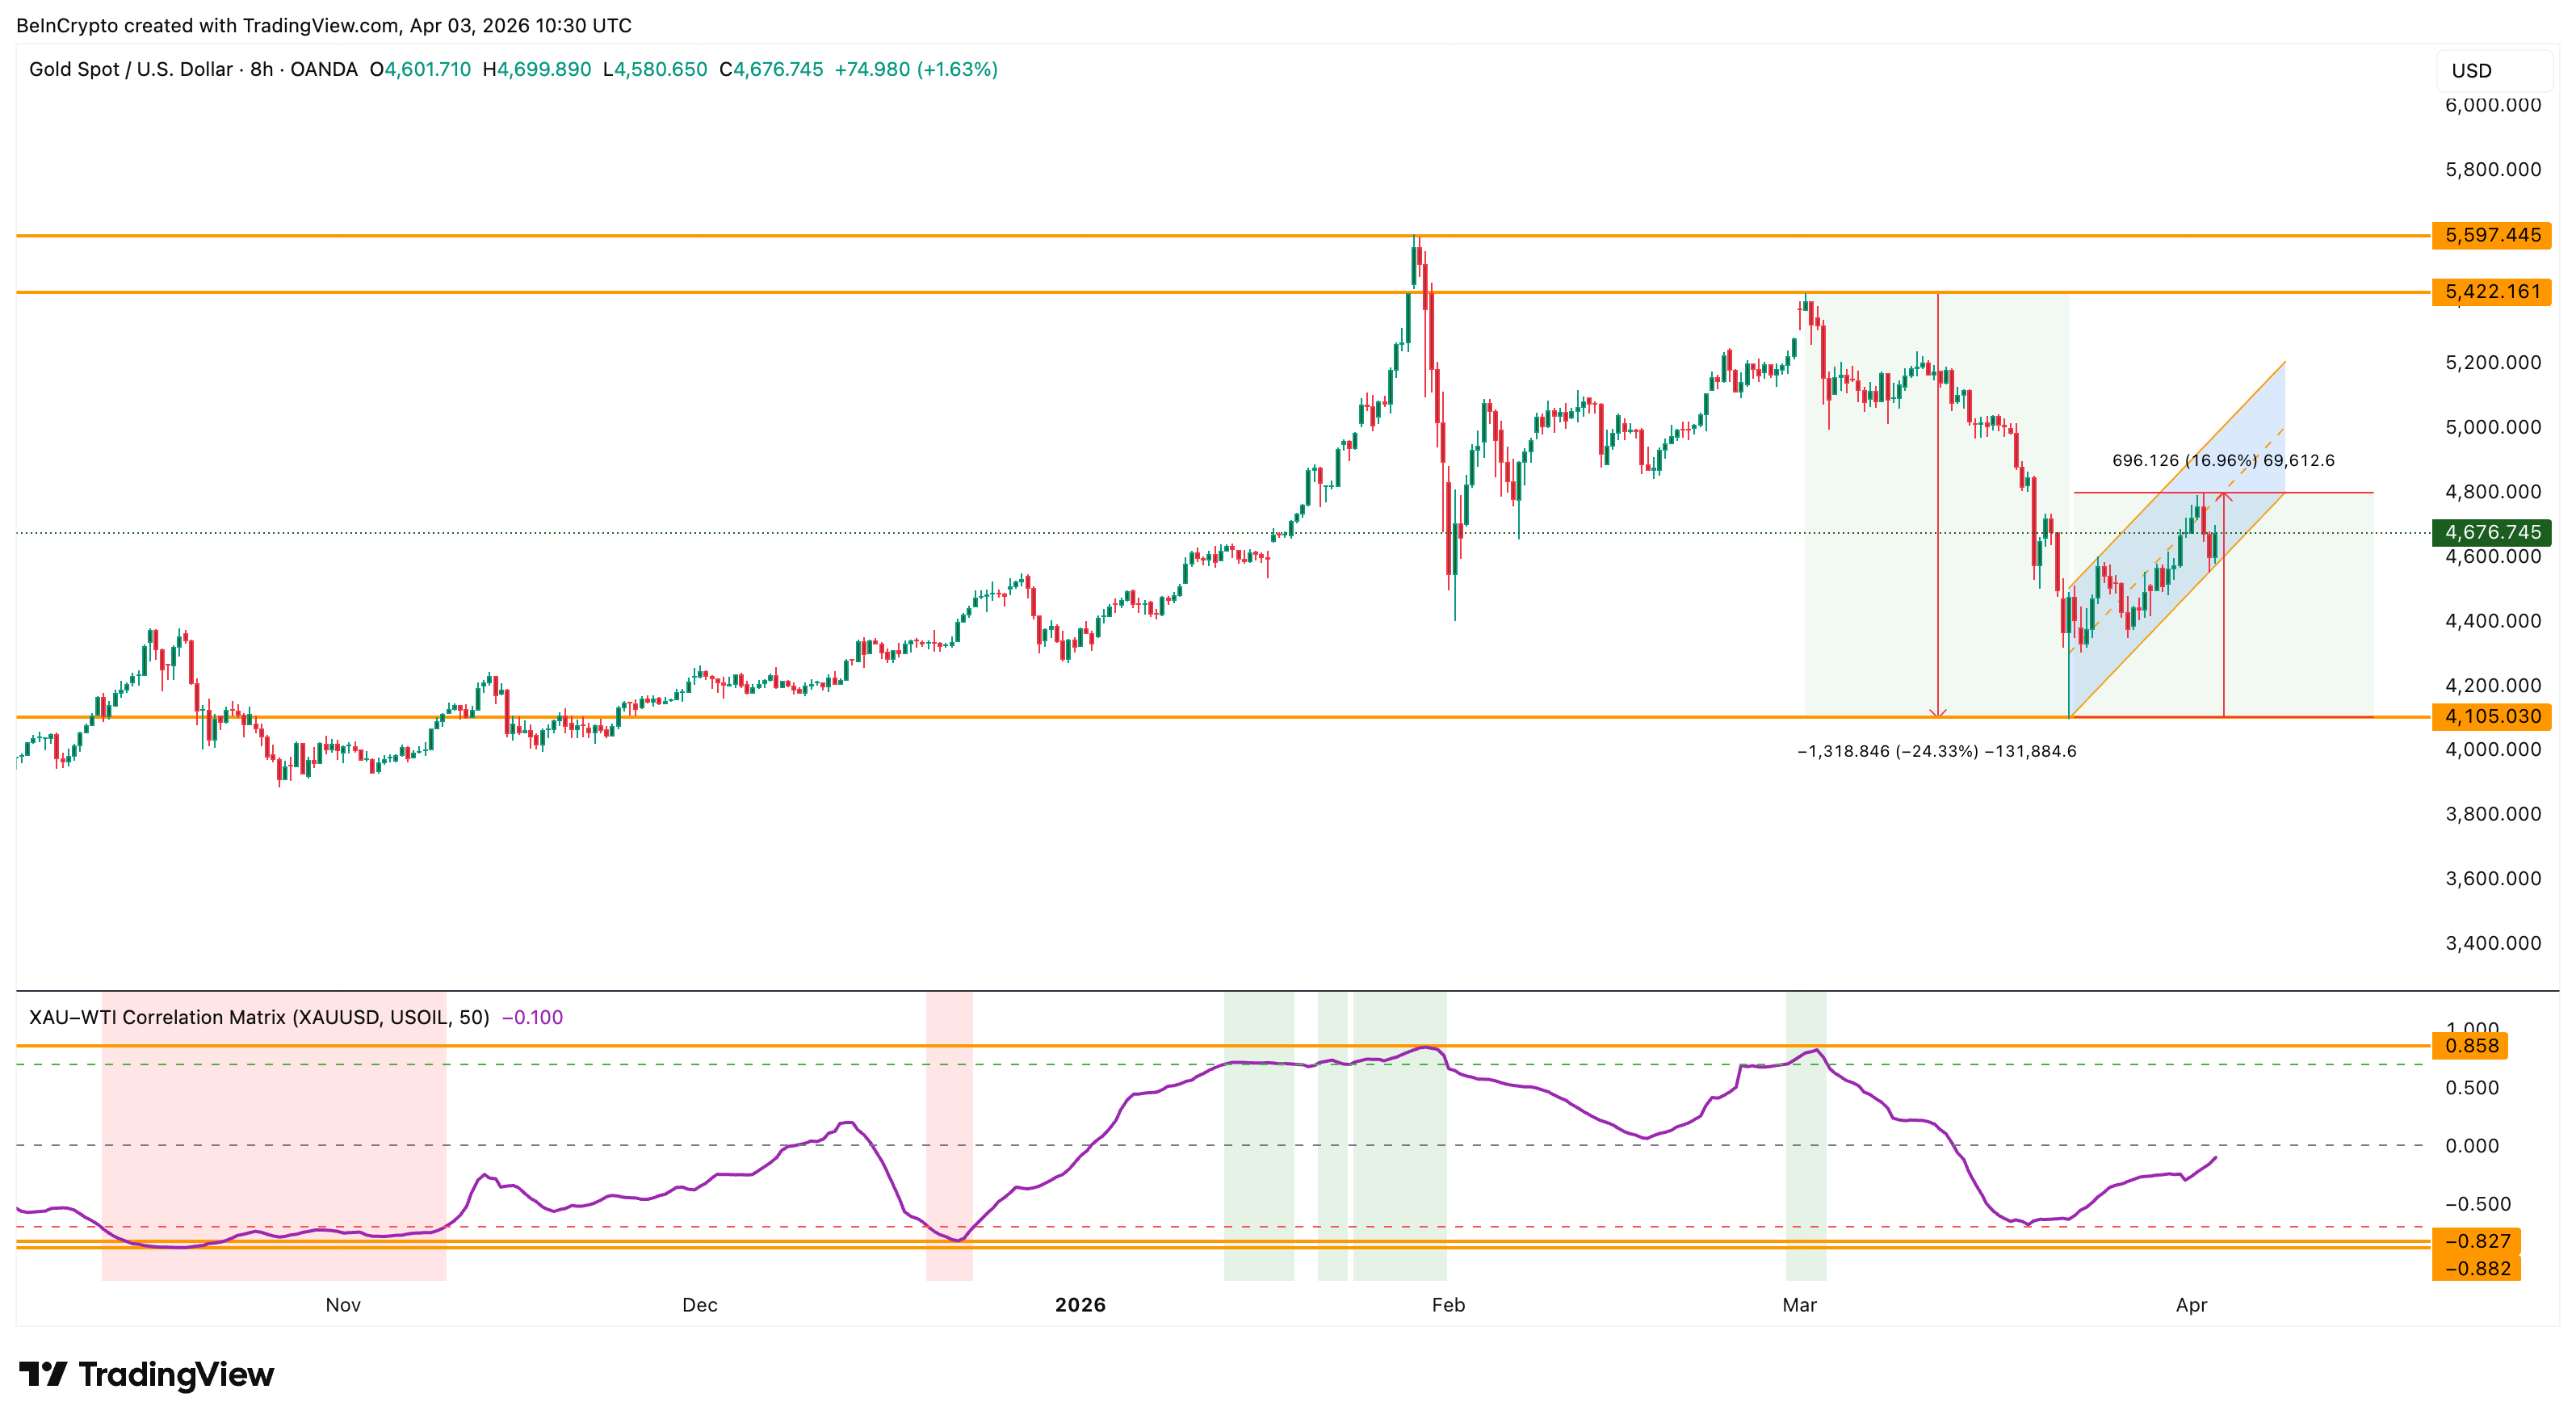
Gold (XAU/USD) price trades near $4,676 on April 3, up roughly 17% since touching a low of $4,105 on March 23. The rally looks convincing. However, a proprietary correlation metric, shifting options positioning, and a nuanced reading of the latest Commitment of Traders report suggest the current advance may be building on the wrong foundation.
Gold’s strongest rallies have historically begun after the metal decoupled from oil, not while both moved higher together. The 17% bounce is riding the same trade that preceded every correction this cycle, and a controlled dip that breaks that link could end up being more constructive than further upside.
Gold Is Rising but the Correlation That Matters Is Already Turning
Since March 23, gold price has been climbing inside an ascending channel on the 8-hour chart. The structure is not a bear flag, as the channel has extended beyond the typical duration, but it is also not confirmed bullish until the upper boundary breaks decisively.
The XAU-WTI Correlation Matrix, a BeInCrypto custom indicator that measures the 50-period rolling correlation between gold spot (OANDA:XAUUSD) and WTI crude oil (TVC:USOIL), currently reads -0.10. The reading has declined from the positive zone it occupied in March but seems to be rising again.
The pattern is consistent. In mid-October, the correlation dropped to around -0.88. and stayed negative through early November. That was when gold price launched its strongest rally. This shows that Gold performs best when it decouples from oil entirely, acting as an independent safe haven.
 Gold Price and XAU-WTI Correlation: TradingView
Every time the correlation peaked in positive territory, gold corrected. In late January, the reading hit approximately 0.85, and gold dropped over the following weeks. In early March, another positive peak aligned with the $5,422 high before the sell-off resumed.
The current -0.10 reading places the correlation in transition. The 17% bounce since March 23 happened during this transitional phase, which means it was partially driven by the same oil-linked sentiment rather than independent safe-haven demand.
This is why a controlled dip would be constructive. If gold price pulls back while oil continues to rise, the correlation would accelerate toward the -0.70 zone, exactly where gold has launched every sustained independent rally this cycle.
The rally does not need to continue to be bullish for gold. The correlation needs to finish resetting. Options traders have already begun reacting to the bounce, and their positioning reveals whether the current move has genuine conviction.
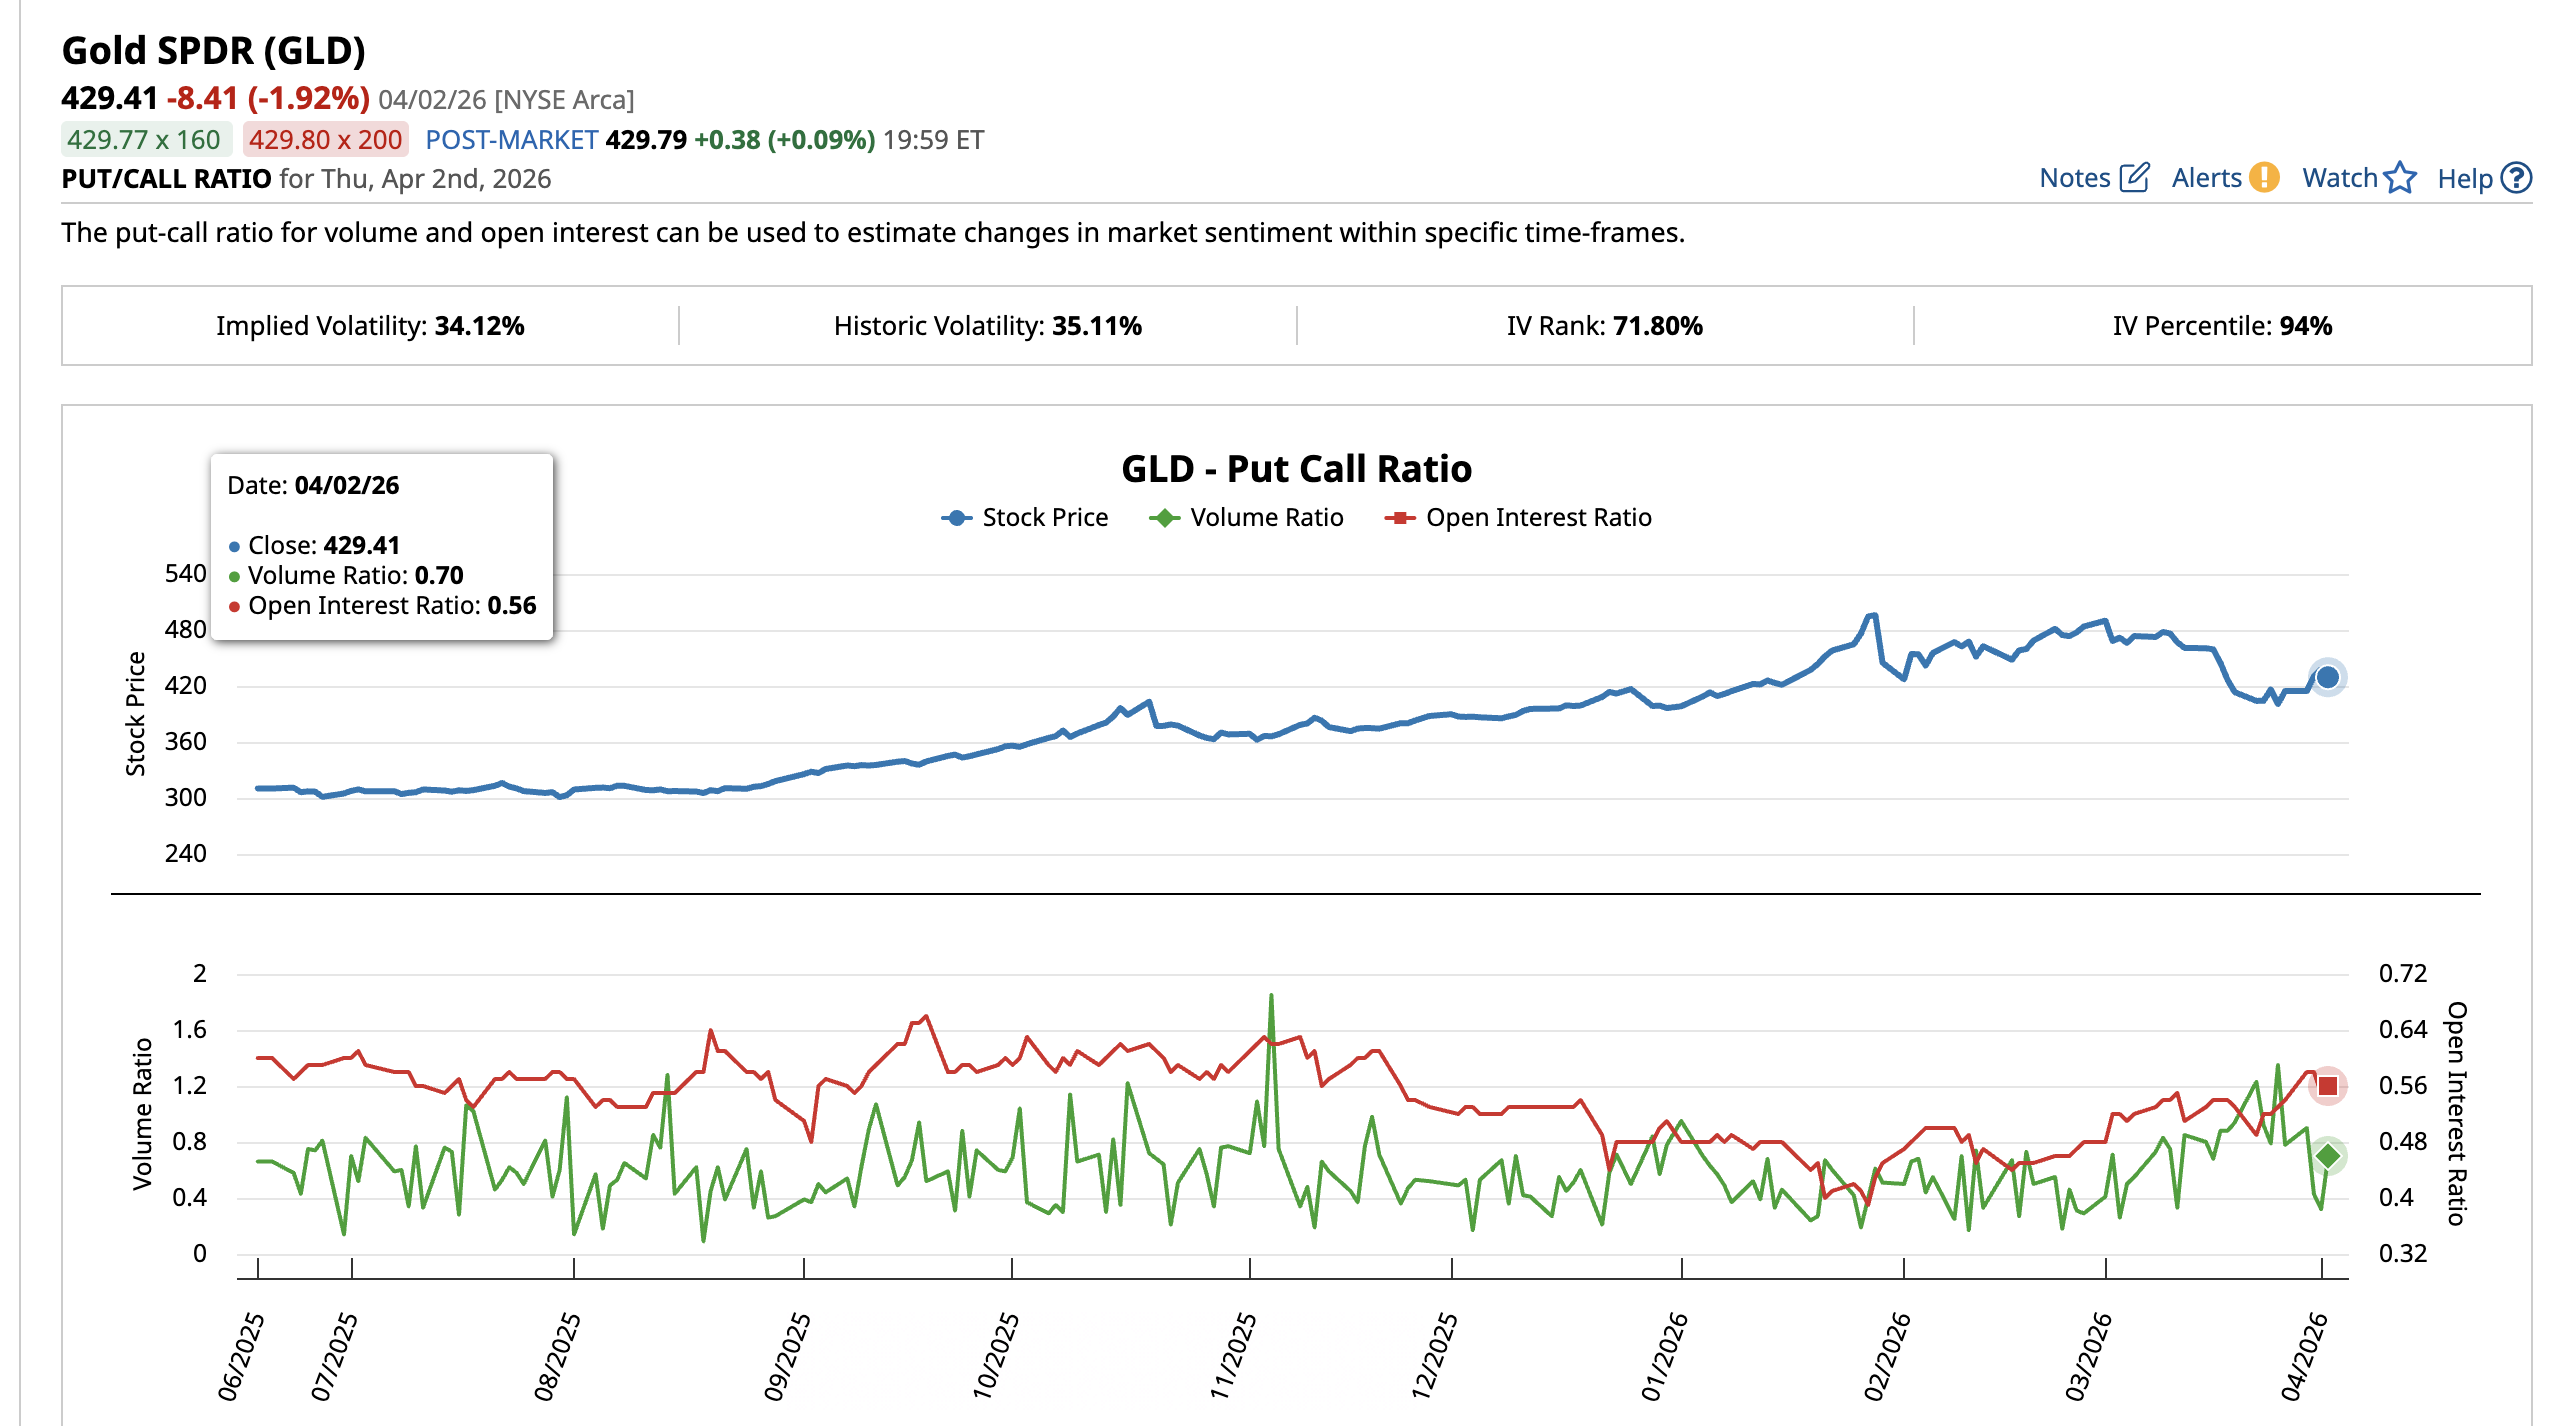
Bullish Bets Replaced Bearish Ones but the Foundation Is Reactive
The SPDR Gold Shares ETF (GLD) put-call ratio captures how options traders are positioning around gold price. On March 26, the put-call volume ratio stood at 1.35, meaning significantly more puts than calls were trading. Bearish sentiment dominated. The open interest ratio at the time was 0.53.
By April 2, the volume ratio had collapsed to 0.70 as call activity surged and put volume faded. The open interest ratio rose to 0.56, indicating new long positions were being opened. The bearish bets that dominated during the March sell-off have been replaced by fresh bullish exposure.
 Put-Call Ratio: Barchart
Traders likely responded to the 17% bounce by rotating from protective puts into directional calls. When bullish bets crowd in at the same time the oil correlation surges (current state), the newly opened long positions become vulnerable.
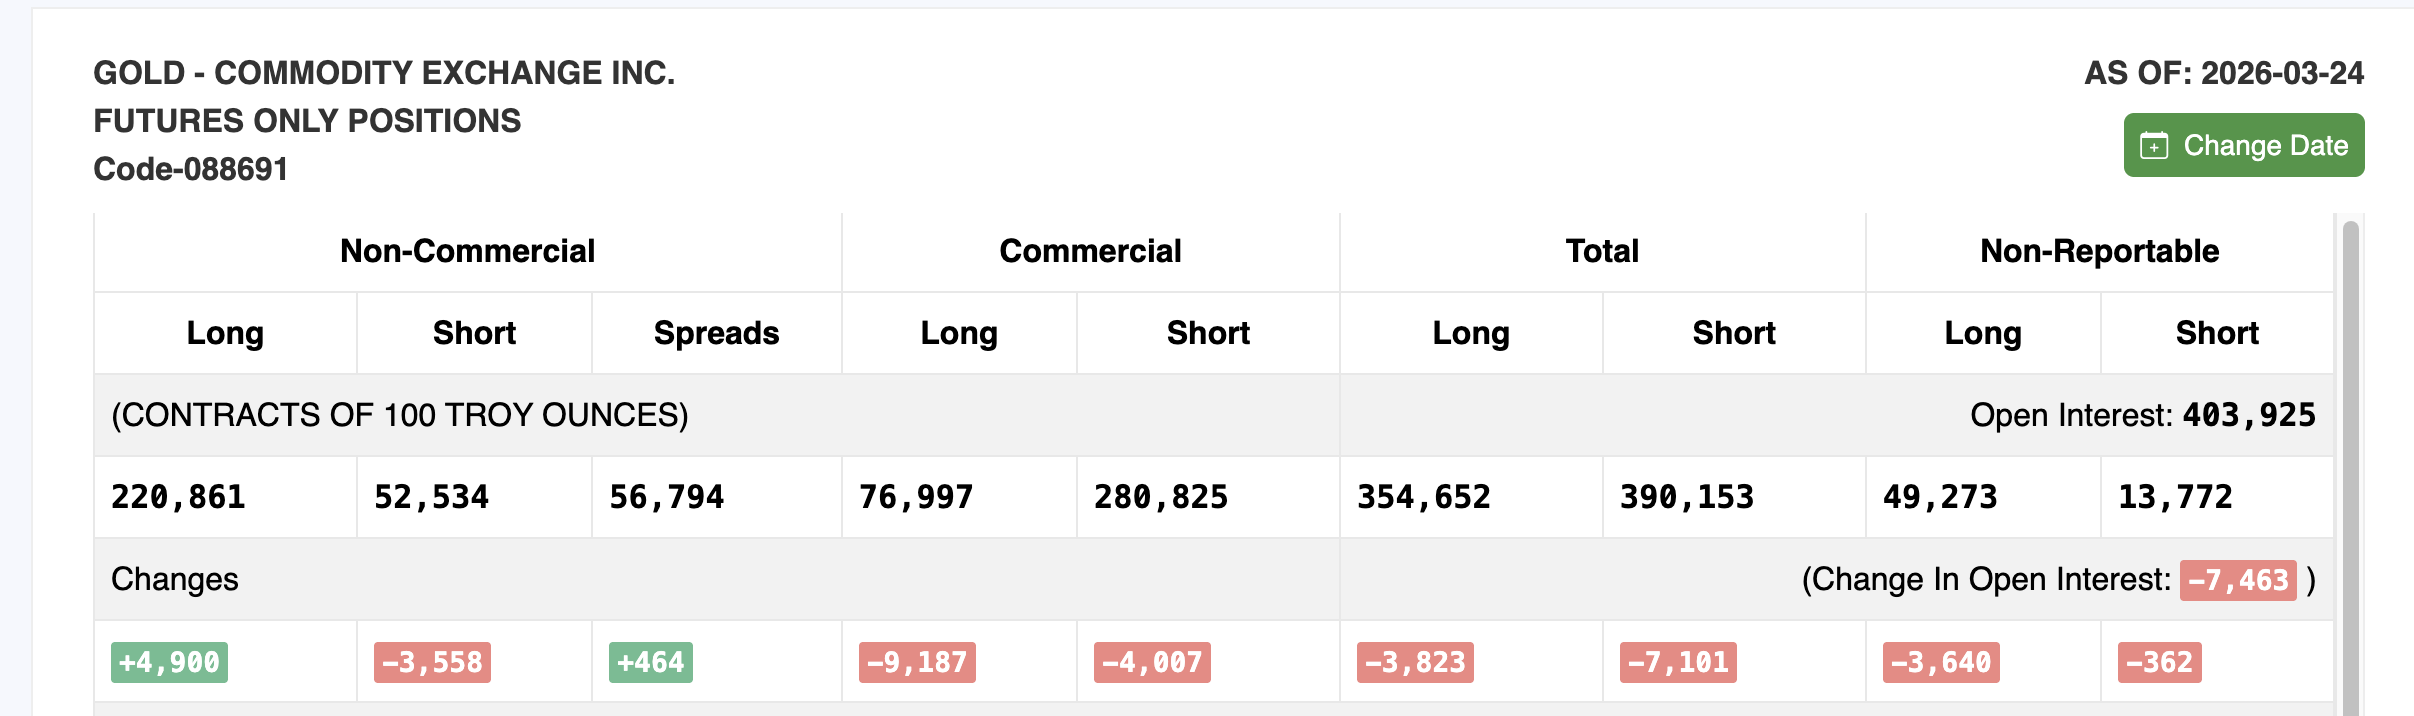
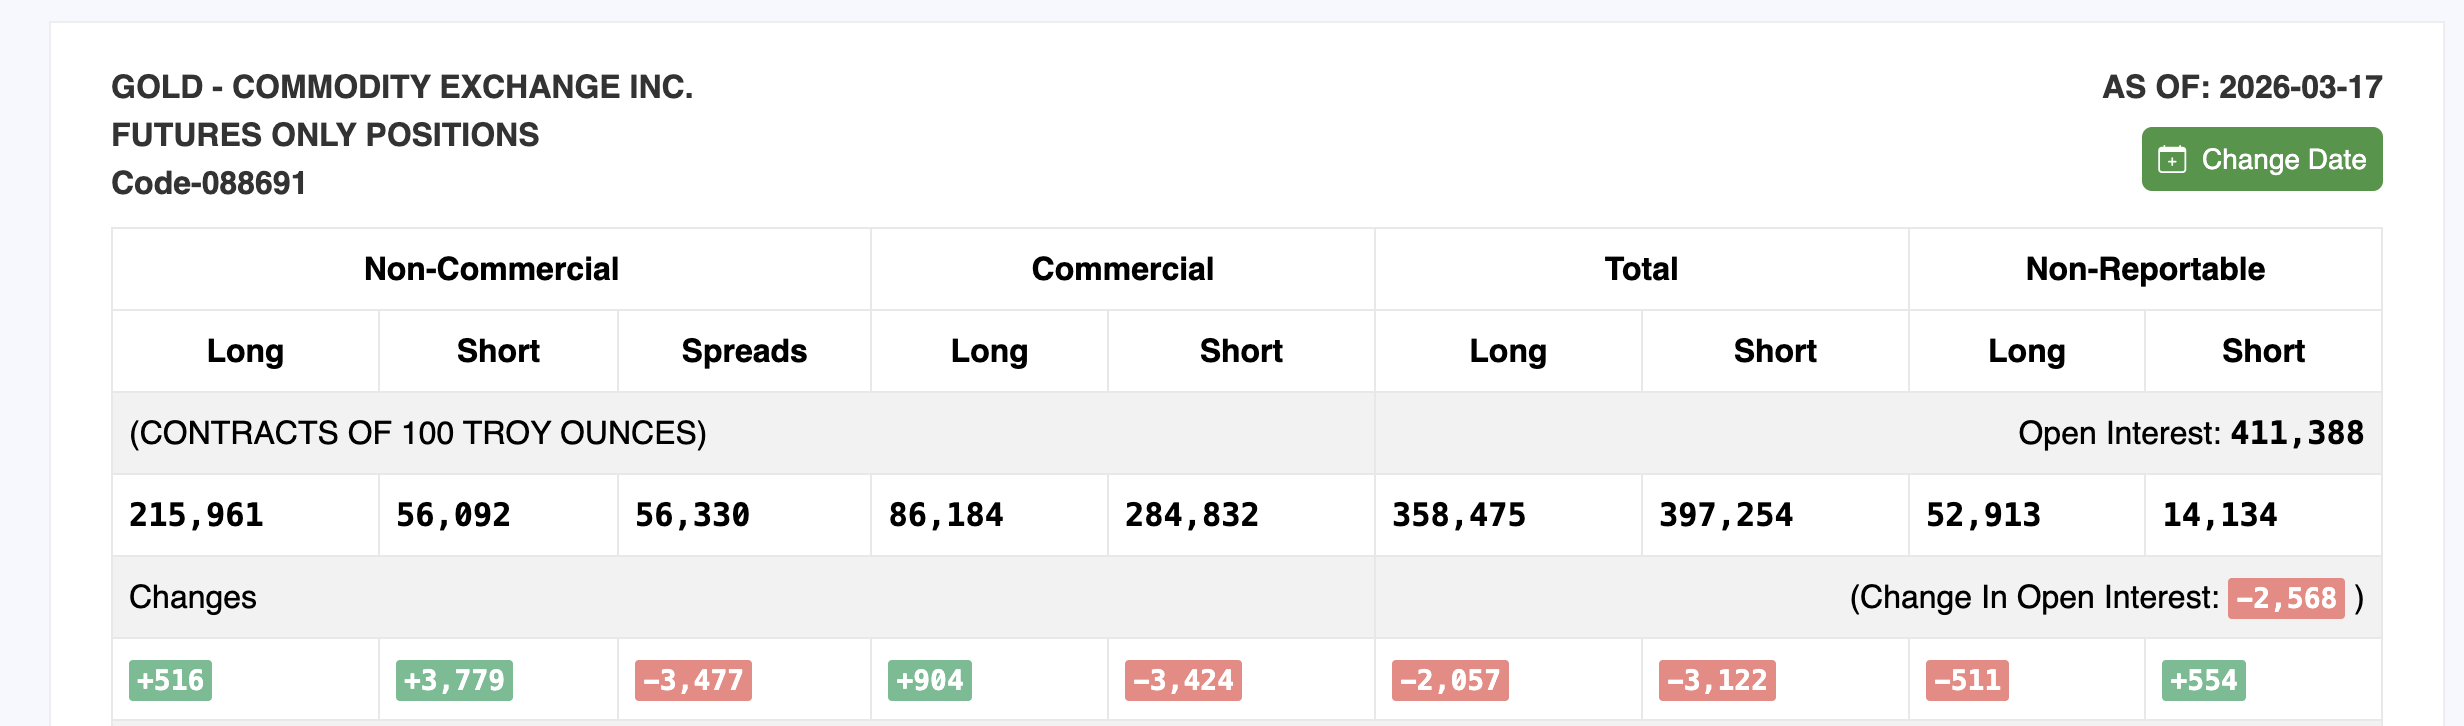
The Commitment of Traders (COT) report, published weekly by the Commodity Futures Trading Commission (CFTC), reinforces this reading. The March 24 report, the latest available, shows non-commercial (speculative) long positions increased by 4,900 contracts to 220,861. Short positions fell by 3,558 to 52,534. On the surface, this looks bullish.
 COT Report March 17: Tradingster
However, total open interest dropped by 7,463 contracts to 403,925 from the previous March 17 report. When longs increase but total open interest falls, it typically means the rally is being driven by short covering rather than fresh buying conviction.
 COT Report March 24: Tradingster
The shift between the two reports aligns with what the GLD put-call data shows. Bearish participants were caught by the 17% rally and scrambled to reposition. This dynamic can sustain a move temporarily but historically does not provide the foundation for a durable gold price advance. The price levels now determine the next path for gold.
Gold Price and the Correlation Paradox
The 8-hour chart with Fibonacci levels frames every critical gold price level. Gold currently sits at $4,676 within the ascending channel.
For the rally to extend, gold needs an 8-hour close above $4,802. Above that, $5,043 acts as the next major resistance. A move through $5,043 would bring $5,422, the March 1 high, back into focus.
However, if gold reaches $5,043 or higher before the correlation completes its reset into deep negative territory, the rally risks repeating the same pattern that preceded both prior corrections. A move higher while the correlation lingers near neutral rather than resetting below -0.70 would leave the advance on an incomplete foundation.
On the downside, $4,490 at the 0.236 Fib represents the first support. Below that, $4,297 at the 0.382 Fib and $4,141 at the 0.5 level come into play. The $4,105 floor from March 23 aligns closely with the 0.5 zone and represents the base of the 17% rally.
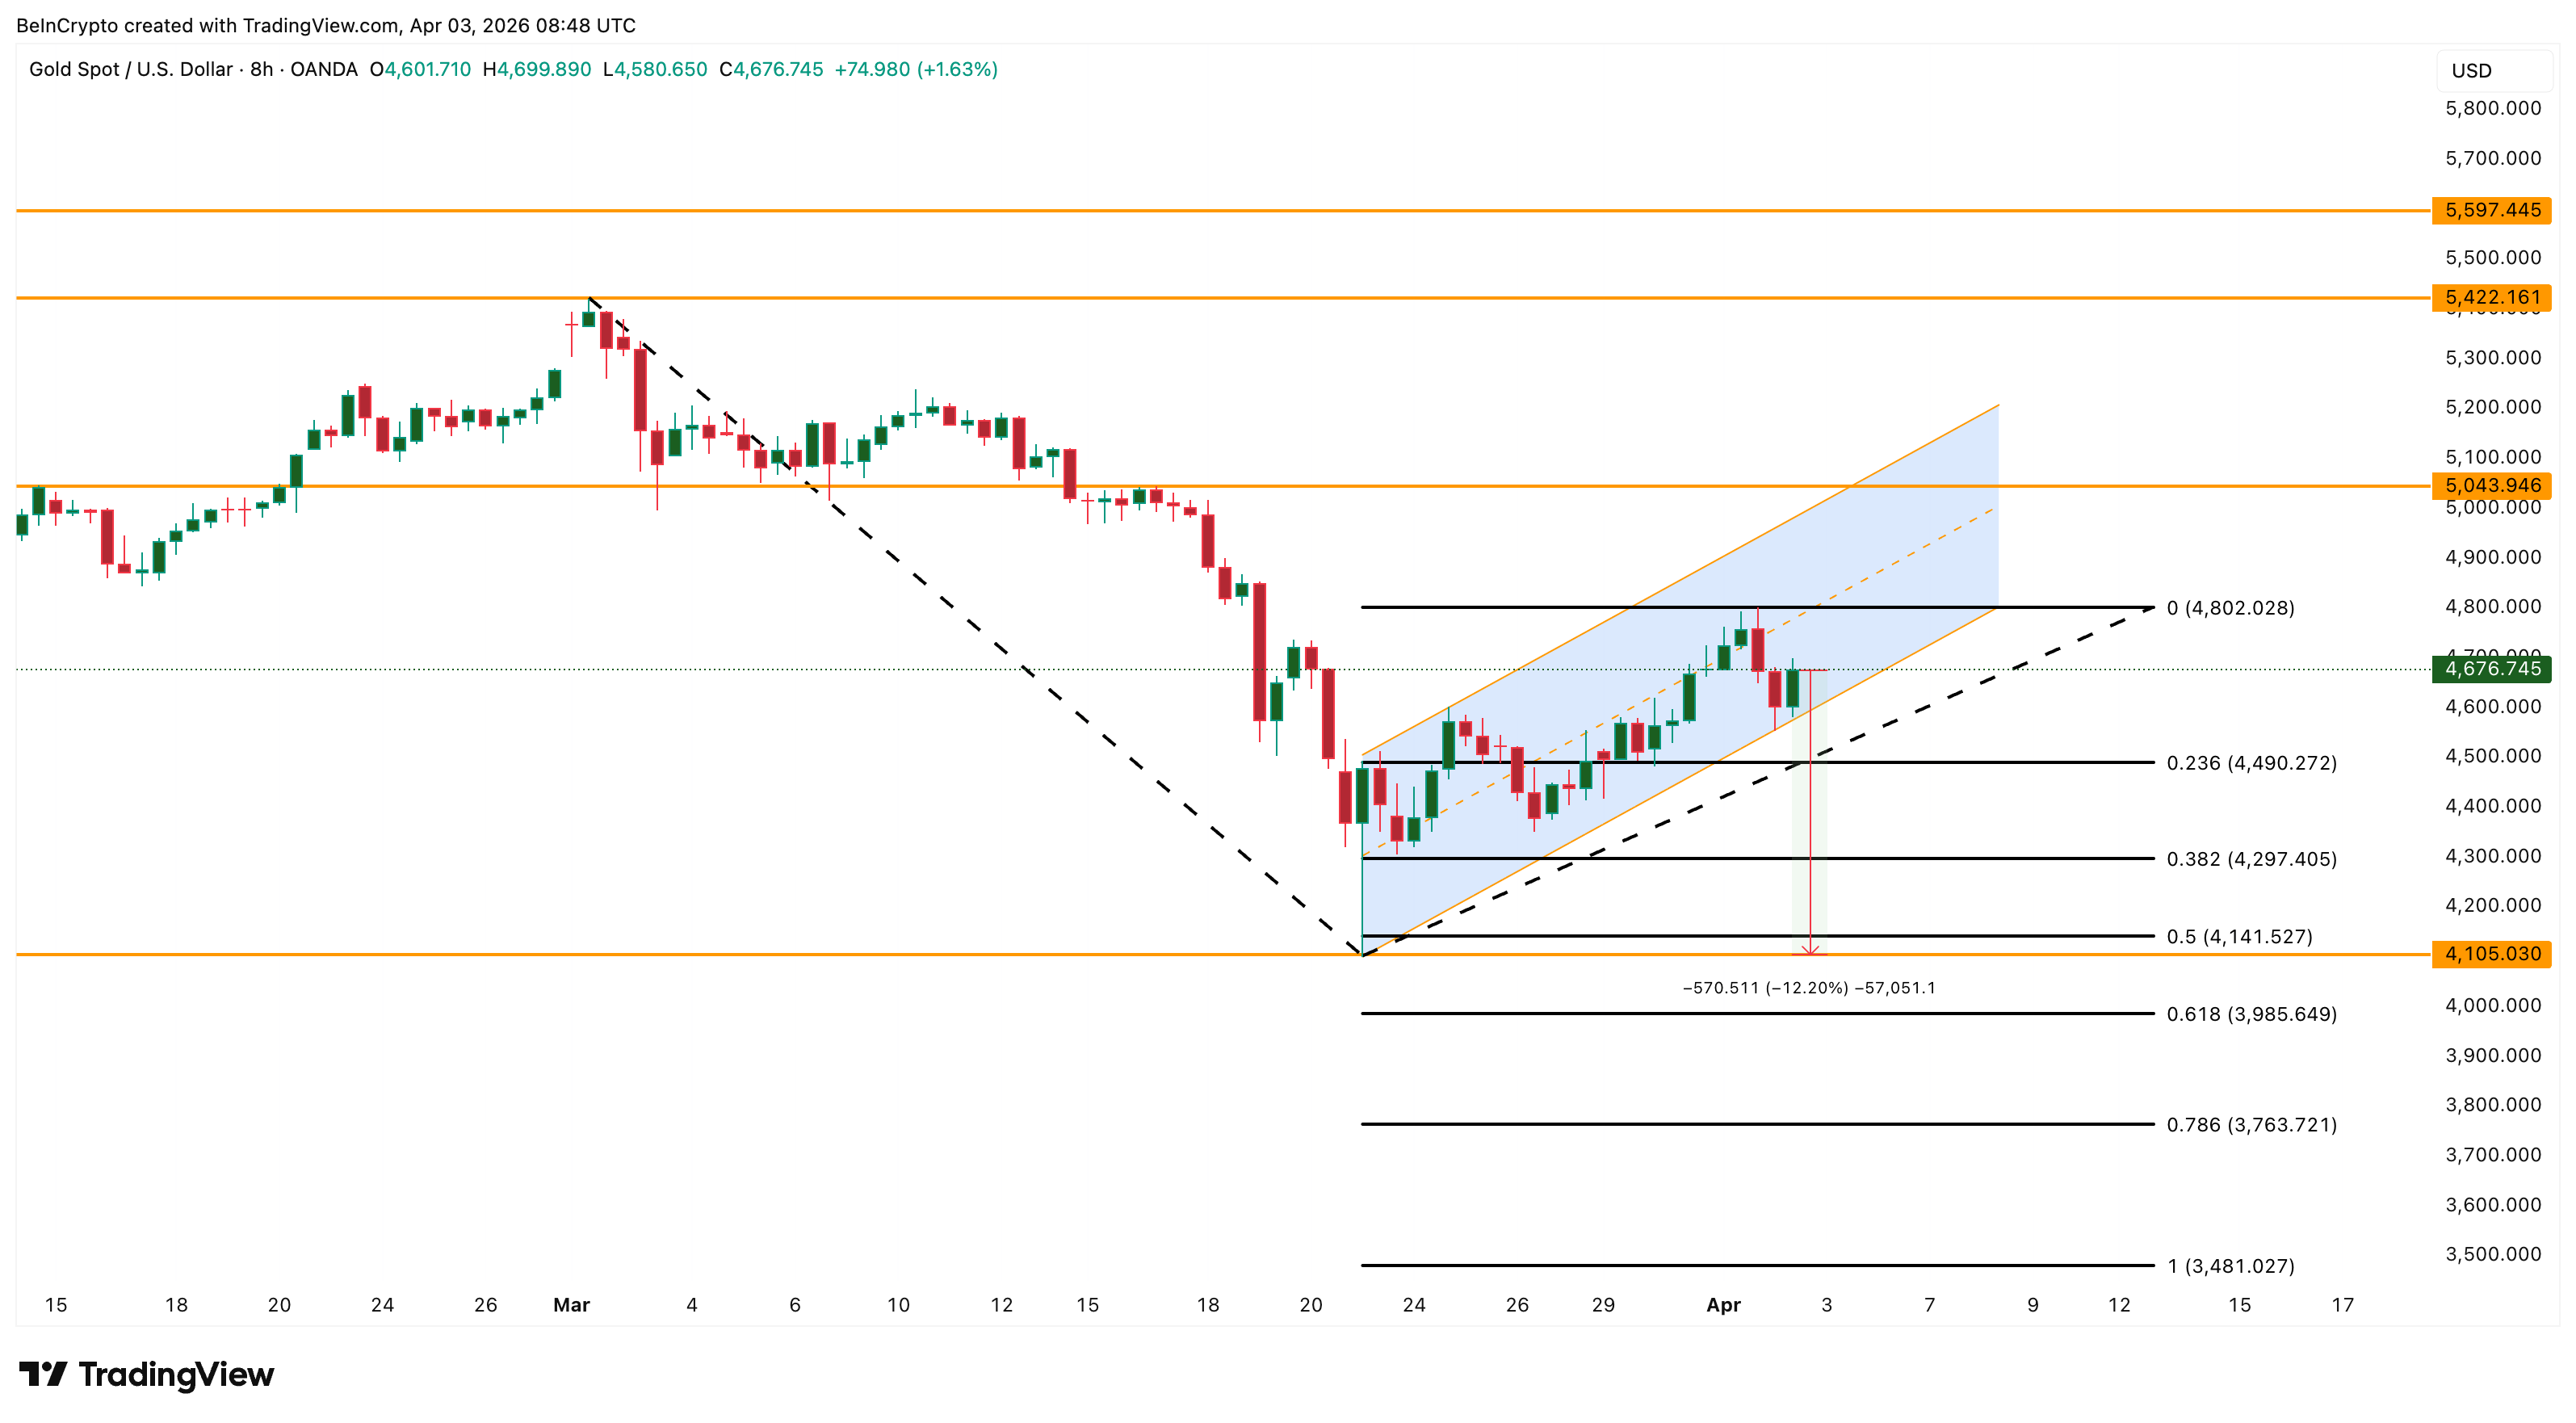 Gold Price Analysis: TradingView
Here is where the paradox resolves. A gold price pullback toward $4,105 while oil continues to rise would possibly push the correlation back toward negative territory.
A dip that breaks the oil correlation sets up a stronger foundation for the next sustained move, while a continued rally that keeps both assets moving together leaves gold in the same overheated zone that triggered every correction this cycle. An 8-hour close above $4,802 extends the channel rally but keeps the correlation risk alive, while a pullback toward $4,105 that breaks the oil link could paradoxically be the most bullish outcome for gold’s medium-term path.
The post Why a Gold Price Dip Could Be More Bullish Than Its Current 17% Rally appeared first on BeInCrypto.


 English (US) ·