
 1 month ago
47
1 month ago
47

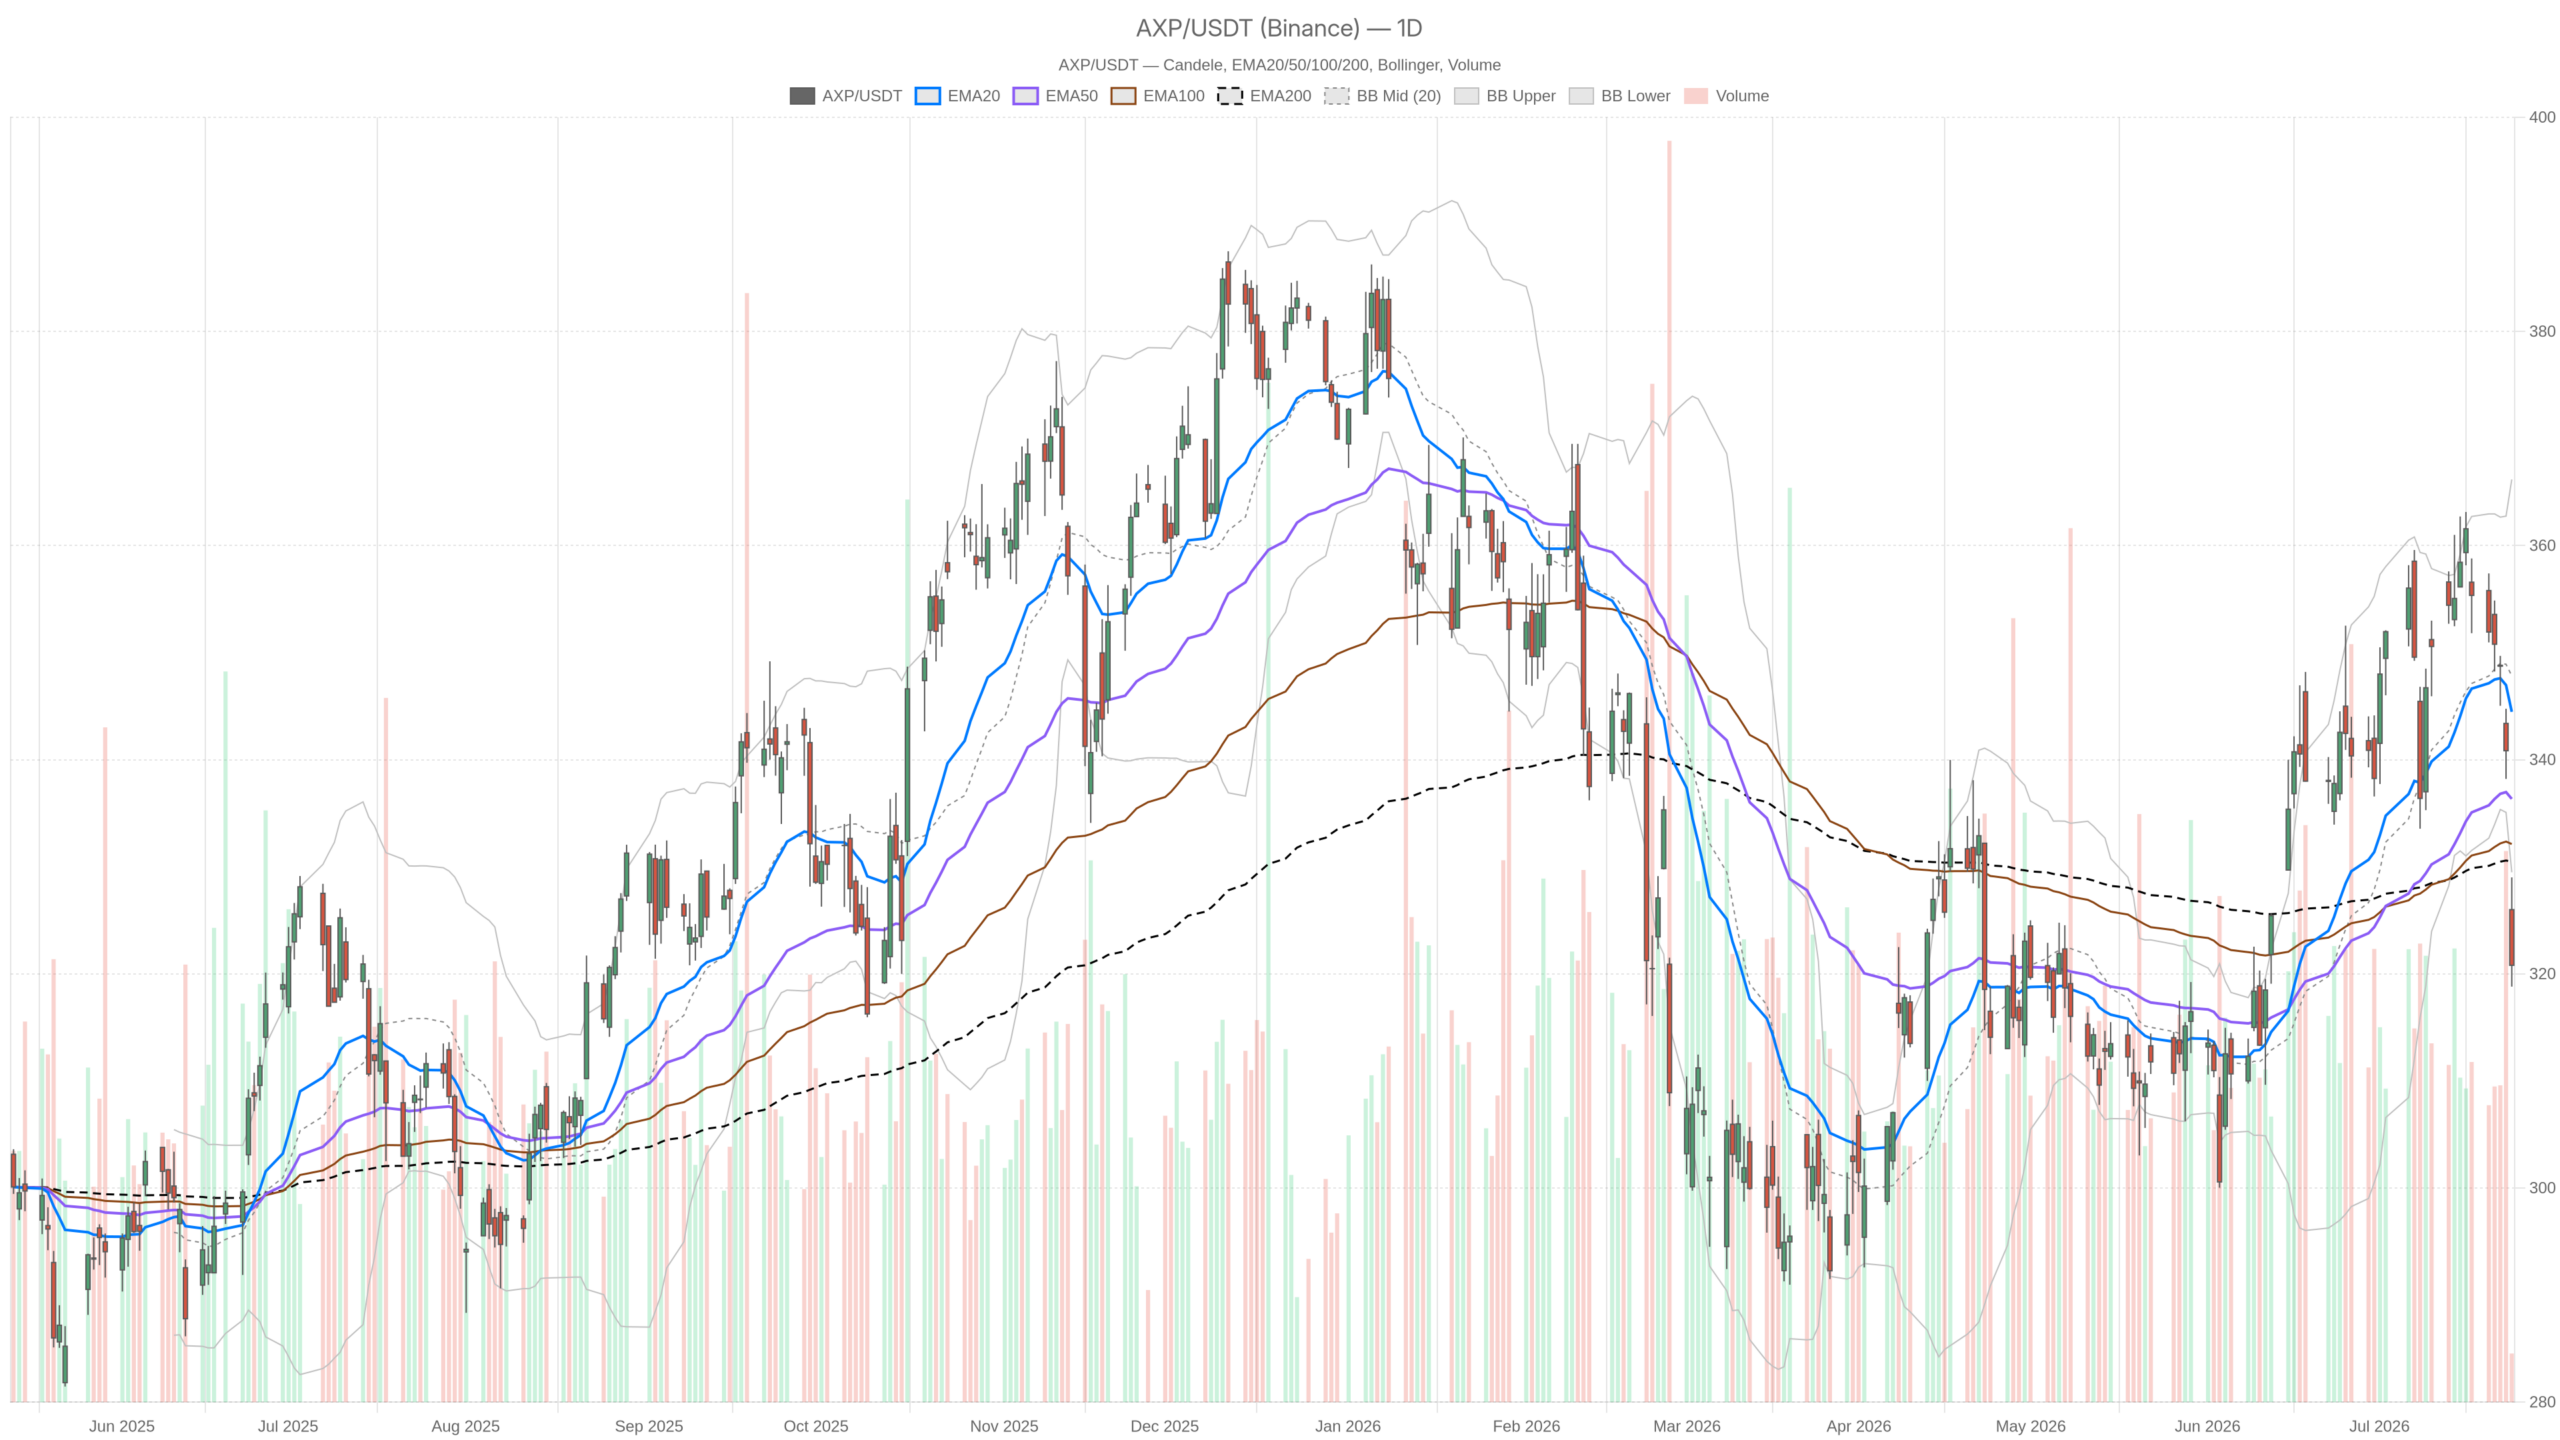 AXP — daily chart with candlesticks, EMA20/EMA50 and volume.
American Express Company Stock Faces Post-Earnings Pressure
American Express Company stock is under clear post-earnings pressure on July 24, 2026. A mixed Q2 report saw the revenue miss outweigh a solid earnings beat. AXP opened at $326, quickly reversed, and by mid-morning settled near $320.80 — reflecting where sentiment stands.
Key takeaways
- AXP Q2 profit rose 8% to $4.53 per share, beating analyst forecasts, but revenue fell slightly below market expectations.
- AXP closed at $320.80, below all three major daily moving averages — EMA20 at $344.47, EMA50 at $336.34, and EMA200 at $330.49.
- Daily RSI at 34.56 approaches oversold territory, while hourly RSI has collapsed to an extreme 12.93.
- The daily ATR of $9.71 signals elevated volatility, with intraday swings of nearly $10 now the baseline expectation.
- Key levels to watch: the $322.87 daily pivot as near-term resistance and S1 at $316.74 as the next support.
The fundamental picture is genuinely split. Q2 profit rose 8% to $4.53 per share, beating analyst forecasts. Higher card member spending, fewer delinquencies, and growing demand for premium products like the Platinum and Gold Card supported the bottom line. However, revenue came in slightly below market expectations. That shortfall was enough to send shares down more than 2% in premarket trading. The market is punishing the top-line miss harder than it is rewarding the earnings beat.
Daily Chart Confirms Bearish Structure Below All Key Levels
The daily chart confirms a bearish structure. AXP has closed below all three major moving averages, signaling trend deterioration across every meaningful horizon. Price at $320.80 sits well beneath the EMA20 at $344.47, EMA50 at $336.34, and the EMA200 at $330.49.
Moving Average Breakdown Signals Trend Deterioration
The EMA200 at $330.49 had been a critical long-term reference level. The close beneath it removes what was a structural floor for longer-term positioning. Notably, the daily Bollinger Band lower boundary sits at $329.49. AXP has already broken below that level. When price exits the lower band on the daily chart, it often signals extreme short-term stress. However, it does not automatically mean a floor is in place.
Momentum Indicators Reflect Persistent Selling
The daily RSI at 34.56 approaches oversold territory without yet triggering a confirmed reversal signal. It reflects persistent selling pressure rather than exhaustion. Meanwhile, the MACD histogram reads at -3.66. The MACD line at 2.31 has crossed below the signal line at 5.98. That bearish crossover confirms momentum is rotating to the downside.
The daily ATR of $9.71 underlines that this is a high-volatility session. Intraday swings of nearly $10 are now the baseline expectation. The daily pivot point sits at $322.87, with R1 at $326.94 and S1 at $316.74. AXP is trading below the pivot, reinforcing near-term bearish control. S1 at $316.74 becomes the next structural reference if selling continues.
Hourly Timeframe Shows Extreme Oversold Conditions
The hourly chart reinforces the bearish bias but introduces one key complication. The hourly RSI has collapsed to an extreme 12.93, reflecting deeply oversold conditions on an intraday basis. In isolation, this suggests a technical bounce is overdue. However, it does not constitute a reversal signal on its own.
Hourly MACD reinforces the bearish case. The line at -4.94 sits well below the signal at -3.30, producing a histogram of -1.64. Momentum on the hourly is still declining, not stabilizing. At the same time, price trades below the hourly EMA20 at $343.59, EMA50 at $348.56, and EMA200 at $343.24. This is a complete bearish stack with no moving average providing near-term support. The hourly Bollinger lower band at $331.14 has also been breached, consistent with the daily breakdown.
Overall, the 1H timeframe confirms the daily bearish bias. The extreme RSI reading introduces the possibility of a mechanical relief bounce. Still, the structural evidence does not yet support a meaningful recovery.
15-Minute Chart Flags Explicit Bearish Regime
The 15-minute chart carries the only explicitly bearish regime flag across all timeframes. Price closed at $321.31 as of 10:15 AM, fractionally above the session low. All three short-term EMAs are stacked bearishly: EMA20 at $335.01, EMA50 at $340.87, and EMA200 at $348.30.
In this context, the 15m MACD line at -5.19 versus a signal at -2.95 confirms momentum remains heavily negative. The 15m RSI at 16.66 echoes the hourly extreme. A small intraday bounce from $319.43 to $321.31 may reflect short-term technical relief rather than genuine demand. The 15m Bollinger lower band at $320.89 is essentially being tested right now. For short-term traders, this is execution context — not a directional call. The R1 at $322.13 and S1 at $319.96 define the immediate micro range.
Bullish Scenario — What Must Change for Recovery
A credible bullish recovery would require more than a technical bounce. AXP would need to reclaim the EMA200 at $330.49 on a closing basis. That level now acts as resistance, not support. A sustained return above $329.49 — the daily Bollinger lower band — would be a necessary first step toward stabilization.
On the fundamental side, the case for bulls remains intact in its core elements. An 8% profit increase, improving credit quality metrics, and accelerating premium card adoption all support the long-term business narrative. If the market reassesses the revenue miss as manageable relative to earnings quality, a re-rating toward fair value is plausible.
Daily RSI near 34 means there is room for a technical recovery without becoming overbought. A recovery back toward the $336–$344 range — where the EMA50 and EMA20 cluster — would be the bullish medium-term target zone. However, reclaiming that zone would require a significant shift in current sentiment.
Bearish Scenario — The Path of Least Resistance
In contrast, the bearish scenario is currently the path of least resistance. AXP has broken below every major daily moving average. The EMA200 — a level many institutional participants treat as a line in the sand — is now overhead resistance at $330.49.
A failure to reclaim the daily pivot at $322.87 by the close would be a negative signal. Below the current level, the daily S1 at $316.74 is the next logical support reference. Beyond that, the Bollinger structure on the daily offers no obvious floor. The midband sits at $347.83 — far above the current market. This leaves a wide zone without structural support.
The revenue shortfall remains the fundamental risk. If investors interpret it as a sign that consumer spending momentum is softening, the selling could extend beyond a single session. The profit beat may not offset that concern. Any broader market weakness would amplify the downside risk, given AXP’s elevated daily ATR.
Positioning and Volatility Outlook
Overall, American Express Company stock is navigating a difficult post-earnings session. The daily and hourly structures are unambiguously bearish. Yet extreme RSI readings across the 1H and 15m timeframes signal that the immediate selling velocity cannot be sustained indefinitely.
A short-term relief bounce is possible. However, it would need to prove itself against significant overhead resistance before changing the medium-term bias. With daily ATR near $9.71, volatility will remain elevated. Traders should treat current levels with caution. The $322.87 pivot and $330.49 EMA200 are the two most important levels to monitor for any directional resolution.
FAQ
What were AXP’s Q2 earnings results?
American Express reported Q2 profit of $4.53 per share, an 8% increase year-over-year that beat analyst forecasts. Revenue, however, came in slightly below market expectations, triggering the post-earnings sell-off.
What are the key support levels for American Express Company stock right now?
The most immediate support is the daily S1 at $316.74. Below that, the daily Bollinger Band structure offers no obvious floor until the midband at $347.83 — which is far above current levels and acts as a distant reference rather than near-term support.
Is AXP stock oversold after the post-earnings drop?
On an intraday basis, yes. The hourly RSI has collapsed to 12.93 and the 15-minute RSI sits at 16.66 — both extreme oversold readings. However, the daily RSI at 34.56 has not yet reached traditional oversold territory, and momentum indicators continue to point lower.
What would signal a bullish reversal for AXP?
A closing reclaim of the EMA200 at $330.49 would be the first meaningful bullish signal. A sustained return above the daily Bollinger lower band at $329.49 would also be necessary. Beyond that, recovery toward the $336–$344 range would shift the medium-term bias.
Disclaimer: This article is for informational purposes only and does not constitute financial advice, an investment recommendation, or a solicitation to buy or sell any financial instrument or cryptocurrency. The analysis provided is not indicative of future results. Investing in crypto assets and financial markets carries a high risk of capital loss. Always do your own research (DYOR) and consult a qualified financial advisor before making any decision.
Article produced with the assistance of artificial intelligence and reviewed by the editorial team.






 English (US) ·