
 2 hours ago
17
2 hours ago
17

The post Will SUI and Pyth Network Witness 2x Surge This Uptober? appeared first on Coinpedia Fintech News
As the Bitcoin price stabilizes above the $66,000 mark, the altcoins are making a comeback. The market, excluding Bitcoin and Ethereum, has reclaimed the $600 billion mark and has increased by 7.19% from its 7-day low at $574.81 billion.
Amid the recovering altcoin market, SUI and Pyth Network are rising to reclaim their top ranks in the performance list. With a breakout and a trend-reversal rally, will SUI and Pyth Network lead the October rally?
Top Performing Altcoins Tokens To Buy:
Pyth Network (PYTH)
With a market cap of $1.24 billion, the PYTH token currently trades at $0.3448. Over the past seven days, it has increased by 13.91% and teases a rounding-bottom reversal. The neckline of the rounding-bottom reversal coincides with the 23.60% Fibonacci level at $0.4489.
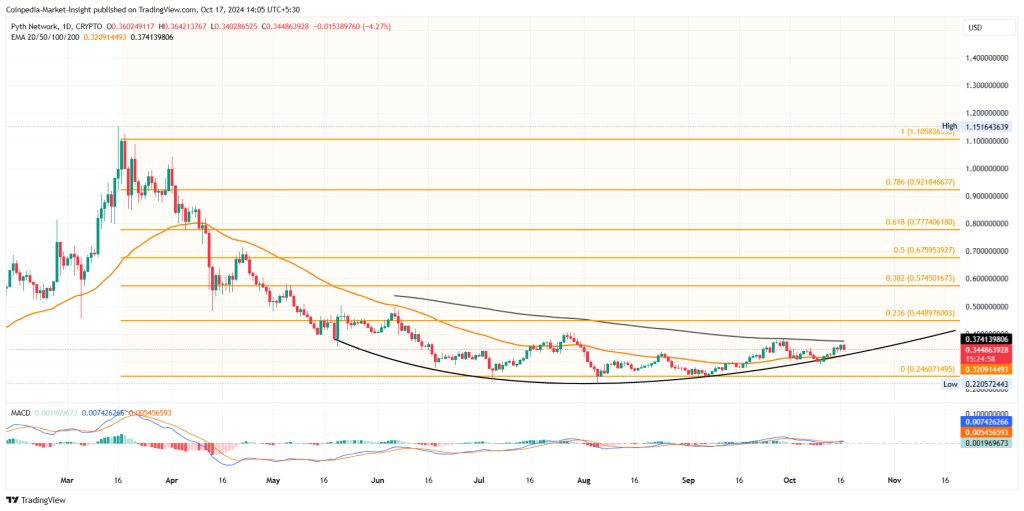
Currently, the altcoin shows a bull cycle, struggling to surpass the 200-day EMA at $0.3741. With an intraday pullback of 4.27%, the altcoin consolidates above the 50-day EMA. The MACD and signal lines have given a bullish crossover, supporting the bullish trend continuation.
The breakout of the 200-day EMA will signal a potential surge to reach the 23.60% Fibonacci level. In the long term, the trend-reversal rally amid a broader market recovery will likely reach the 50% Fibonacci level at $0.67959 by the end of next week.
Will the altcoin be ready for surge this October? Find out now in Pyth Network price prediction for 2024 to 2030.
SUI (SUI)
With a rounding bottom reversal, the SUI crypto price action reveals a bullish breakout of the $2 mark. The psychological mark acted as a neckline of the bullish pattern, teasing a massive upside potential for the altcoin.
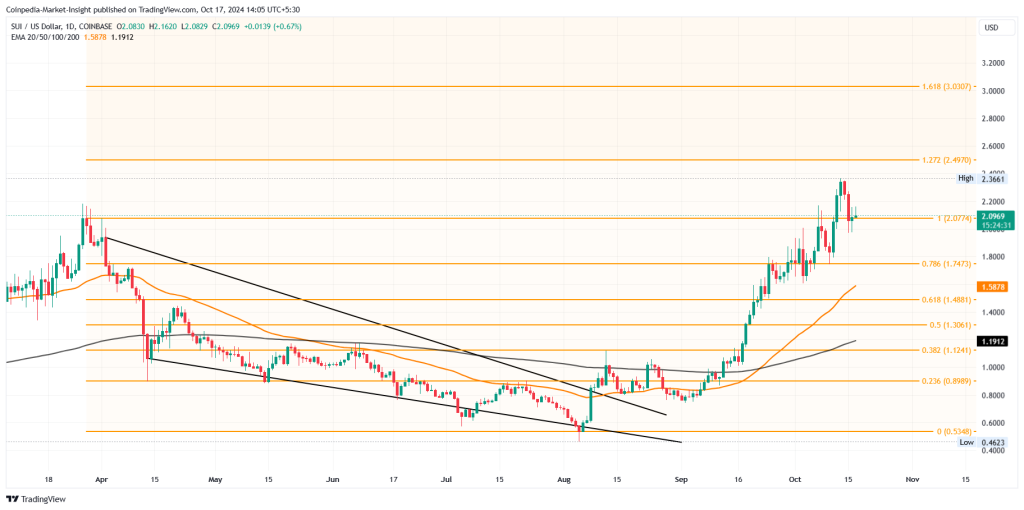
However, the minor pullback during the start of this week acts as a retest of the bullish breakout. Currently, the daily chart reveals a potential morning star pattern forming as a post-retest reversal, increasing the chances of a bullish trend.
However, the uncertain movement in the MACD and signal lines reflect increased volatility. Based on the Fibonacci levels, if the uptrend continues, the 1.272 and 1.618 Fibonacci levels at $3 and $4.80 are the next potential price targets for the altcoin.


 English (US) ·