
 4 hours ago
13
4 hours ago
13
As of August 8, 2026, traders watching XRP crypto are seeing a grinding market that frustrates more than any violent selloff. Price sits at $1.02, pinned to the daily Bollinger lower band, with a wall of declining moving averages overhead.
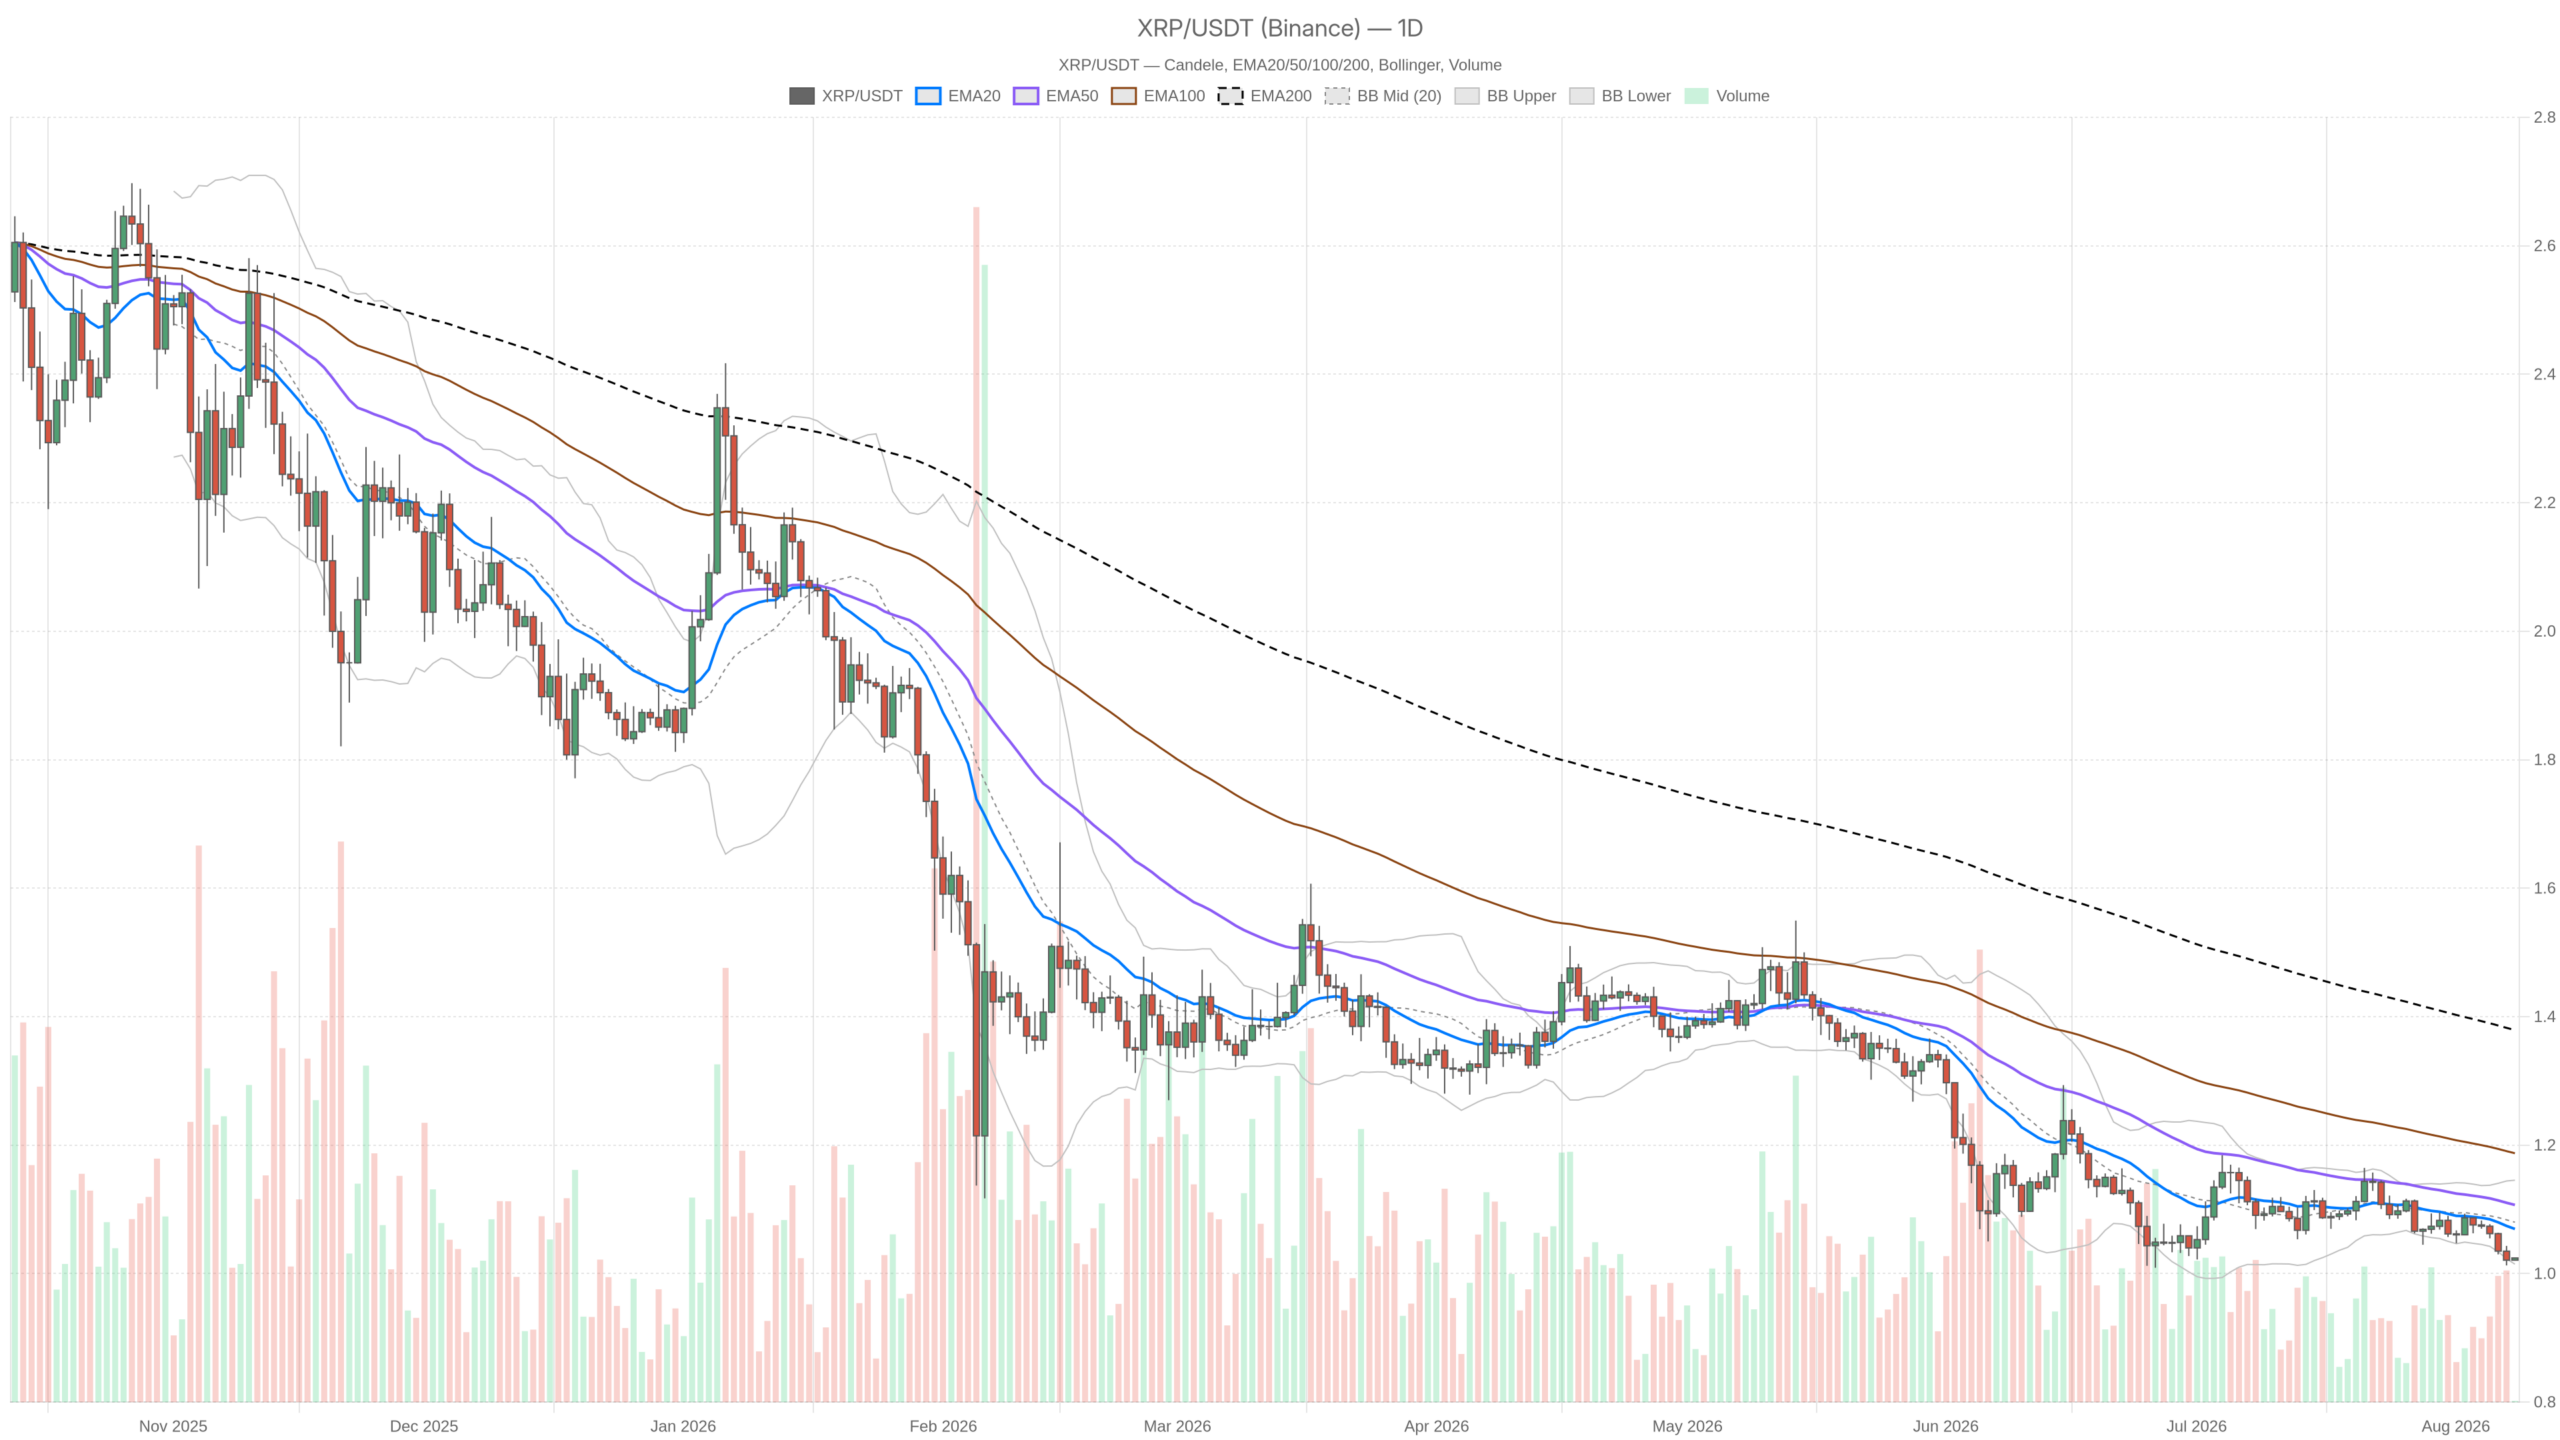 XRP/USDT — daily chart with candlesticks, EMA20/EMA50 and volume.
Key takeaways
- XRP is pinned at $1.02 directly on the daily Bollinger lower band at $1.01, with the daily pivot offering overlapping support.
- The daily EMA stack is bearish: 20-day at $1.07, 50-day at $1.11, and 200-day at $1.38 — all sloping downward with price beneath them.
- Daily RSI at 35.85 is weak but not oversold, while MACD remains negative, confirming persistent low-intensity selling pressure.
- The Fear & Greed Index reads 30, firmly in Fear territory, despite total crypto market cap stabilising around $2.29 trillion.
- Key levels: $1.01 must hold to avoid a breakdown; reclaiming $1.06 on the hourly and $1.08 on the daily would be the first credible signs of repair.
Daily chart confirms a bearish bias
The daily chart shows a textbook downtrend with price below all three declining EMAs, confirming sellers are in full control. The 20-day EMA at $1.07 trades roughly five cents under the 50-day at $1.11, meaning any rally into the $1.07–$1.11 pocket is likely to be treated as a supply zone rather than a breakout opportunity.
Daily RSI at 35.85 tells a nuanced story. It is weak and firmly in the lower half of the range, yet it is not screaming oversold. No obvious momentum exhaustion signature exists here, which implies the market has room to bleed lower without any technical alarm bells ringing. Traders waiting for a mechanical mean-reversion trigger are early.
MACD backs that assessment. The line at -0.02 sits below its signal at -0.01, with the histogram at -0.01 — negative but shallow. Read it as persistent, low-intensity selling pressure rather than an aggressive downside impulse. Downtrends that look like this tend to be attritional: no fireworks, just a steady drip of lower highs.
The Bollinger structure is the most revealing piece. The daily midline sits at $1.08, the upper band at $1.15, and the lower at $1.01. Price hugging the lower band while the midline remains six cents overhead is the signature of a trend-riding move, not a snapback setup. Until XRP reclaims that $1.08 midline, every bounce is statistically just a repricing within a downtrend. Losing $1.01 on a closing basis, however, would open the band lower and invite trend continuation.
Daily ATR at $0.03 is the quiet detail most traders overlook. Three cents of average daily range on a $1.02 asset means realised volatility has compressed hard. Compressed volatility inside a bearish structure is a coiled spring — and springs do not care which direction they release in.
Hourly timeframe shows weakening bearish momentum
The hourly chart remains bearish but with less conviction, as momentum indicators have flattened near neutral levels. The EMA sequence agrees with the daily picture: 20 at $1.03, 50 at $1.04, 200 at $1.06, with price at $1.02 below all three. Those levels form the immediate resistance ladder, and the $1.06 hourly 200-EMA is the first genuinely meaningful reclaim level for anyone arguing the trend has changed.
That said, the hourly is not as heavy as the daily. RSI at 44.89 is close to neutral, and MACD has flattened to zero across line, signal and histogram. Momentum on this timeframe has gone flat — not bullish, simply spent. The hourly Bollinger range is razor-thin, spanning from $1.01 to $1.04 around a $1.03 midline, with ATR at just $0.01. That describes a market with almost no immediate energy, sitting on support, waiting for someone to make a decision.
Here is the tension worth naming: the daily says trend, the hourly says balance. When a lower timeframe stops confirming the higher timeframe’s aggression, you either get a pause that resolves in the trend’s direction, or you get a countertrend squeeze that traps late shorts. Neither outcome is decided yet.
15-minute chart offers execution context only
The 15-minute chart is neutral and offers no directional edge, serving only to define intraday battle lines. Price, the 20-EMA and the 50-EMA are all stacked at $1.02, RSI is 52.54 — dead centre — and the Bollinger band spans a single cent between $1.02 and $1.03. The 200-EMA at $1.04 remains overhead. Above the $1.02–$1.03 zone, intraday buyers have a foothold. Below it, they do not.
Bullish case depends on holding $1.01 support
The bullish scenario requires holding the $1.01–$1.02 shelf, reclaiming $1.06, and closing above the $1.08 daily Bollinger midline. Step one is defending the overlapping daily lower band and pivot support — the only factor genuinely working in bulls’ favour right now. Step two is reclaiming the hourly EMA cluster and closing back above $1.06.
Step three, the one that actually changes the character of the XRP crypto trend, is a daily close above the $1.08 Bollinger midline and then the $1.07–$1.11 EMA pocket. With daily RSI at 35.85 and MACD only mildly negative, there is technical room for that kind of recovery without anything breaking.
What invalidates the bullish case: a daily close beneath $1.01. That would take out the lower band and pivot support in one move and confirm that compressed volatility resolved downward. A rejection at $1.07 that leaves the daily EMA stack untouched would also signal that nothing has actually changed — just another lower high.
Bearish case remains the path of least resistance
The bearish path requires no dramatic shift — just continued price action below declining EMAs with negative MACD and fearful sentiment. Price beneath all three daily EMAs, RSI stuck in the mid-30s, and a Fear reading of 30 describe a market where sellers control the structure and buyers are not stepping up with size.
If $1.01 gives way, the compressed $0.03 daily ATR is likely to expand. Expanding volatility inside a downtrend rarely favours longs. What invalidates this path is a decisive reclaim of $1.06 on the hourly followed by acceptance above the $1.08 daily midline. That would flip the EMA relationship from resistance to potential support and force short-side positioning to reconsider.
Positioning requires patience in a compressed market
With a bearish structure, flat short-term momentum, compressed volatility and fearful sentiment, forcing a directional view is precisely where traders lose money. Chasing a breakdown at $1.02 with a $0.01 hourly ATR is buying volatility at the wrong price. Meanwhile, buying the dip because RSI “looks low” ignores the fact that 35.85 is not an extreme and that price remains nowhere near the 200-day EMA at $1.38.
Broader context adds a layer of caution. Bitcoin dominance at 56.77% with XRP accounting for roughly 2.79% of total market capitalisation tells you capital is not rotating aggressively into large-cap altcoins. On-chain activity gives a similarly mixed picture: DefiLlama data shows leading DEX fee generation cooling on a daily basis — Uniswap V3 down 4.86%, Uniswap V4 down 5.18%, Fluid DEX down 24.3% — even where 7-day and 30-day trends diverge sharply. Risk appetite is present but selective, and it is not currently pointed at XRP.
The levels that matter are unusually tight and therefore unusually useful: $1.01 as the line that defines whether this is a base or a pause, $1.06 as the first credible sign of repair, and $1.08 as the level that would genuinely challenge the bearish thesis. Until one of those breaks with a close behind it, the market is telling you it does not know either — and there is no rule that says you must guess before it does.
FAQ
What is the key support level for XRP right now?
The critical support sits at $1.01, where the daily Bollinger lower band and daily pivot overlap. A daily close below this level would confirm a bearish breakdown and likely trigger an expansion of the compressed $0.03 daily ATR to the downside.
What needs to happen for XRP to turn bullish?
XRP must hold the $1.01–$1.02 shelf first, then reclaim the hourly EMA cluster above $1.06, and finally close above the $1.08 daily Bollinger midline. Only that sequence would genuinely challenge the bearish structure and flip the EMA relationship from resistance to potential support.
Why is XRP underperforming the broader crypto market?
While total crypto market capitalisation sits at $2.29 trillion with a modest 0.60% gain, XRP remains pinned below its declining moving averages. Bitcoin dominance at 56.77% and XRP’s 2.79% market share suggest capital is not rotating into this asset, and on-chain DEX activity shows cooling risk appetite.
Is the Fear & Greed Index affecting XRP’s price action?
The Fear & Greed Index at 30 reflects the same fearful sentiment already priced into the technical structure. It confirms that buyers are hesitant to step in with conviction, which aligns with the persistent selling pressure visible across the daily EMAs and MACD.
Disclaimer: This article is for informational purposes only and does not constitute financial advice, an investment recommendation, or a solicitation to buy or sell any financial instrument or cryptocurrency. The analysis provided is not indicative of future results. Investing in crypto assets and financial markets carries a high risk of capital loss. Always do your own research (DYOR) and consult a qualified financial advisor before making any decision.
Article produced with the assistance of artificial intelligence and reviewed by the editorial team.




 English (US) ·