
 1 month ago
16
1 month ago
16
Key Takeaways
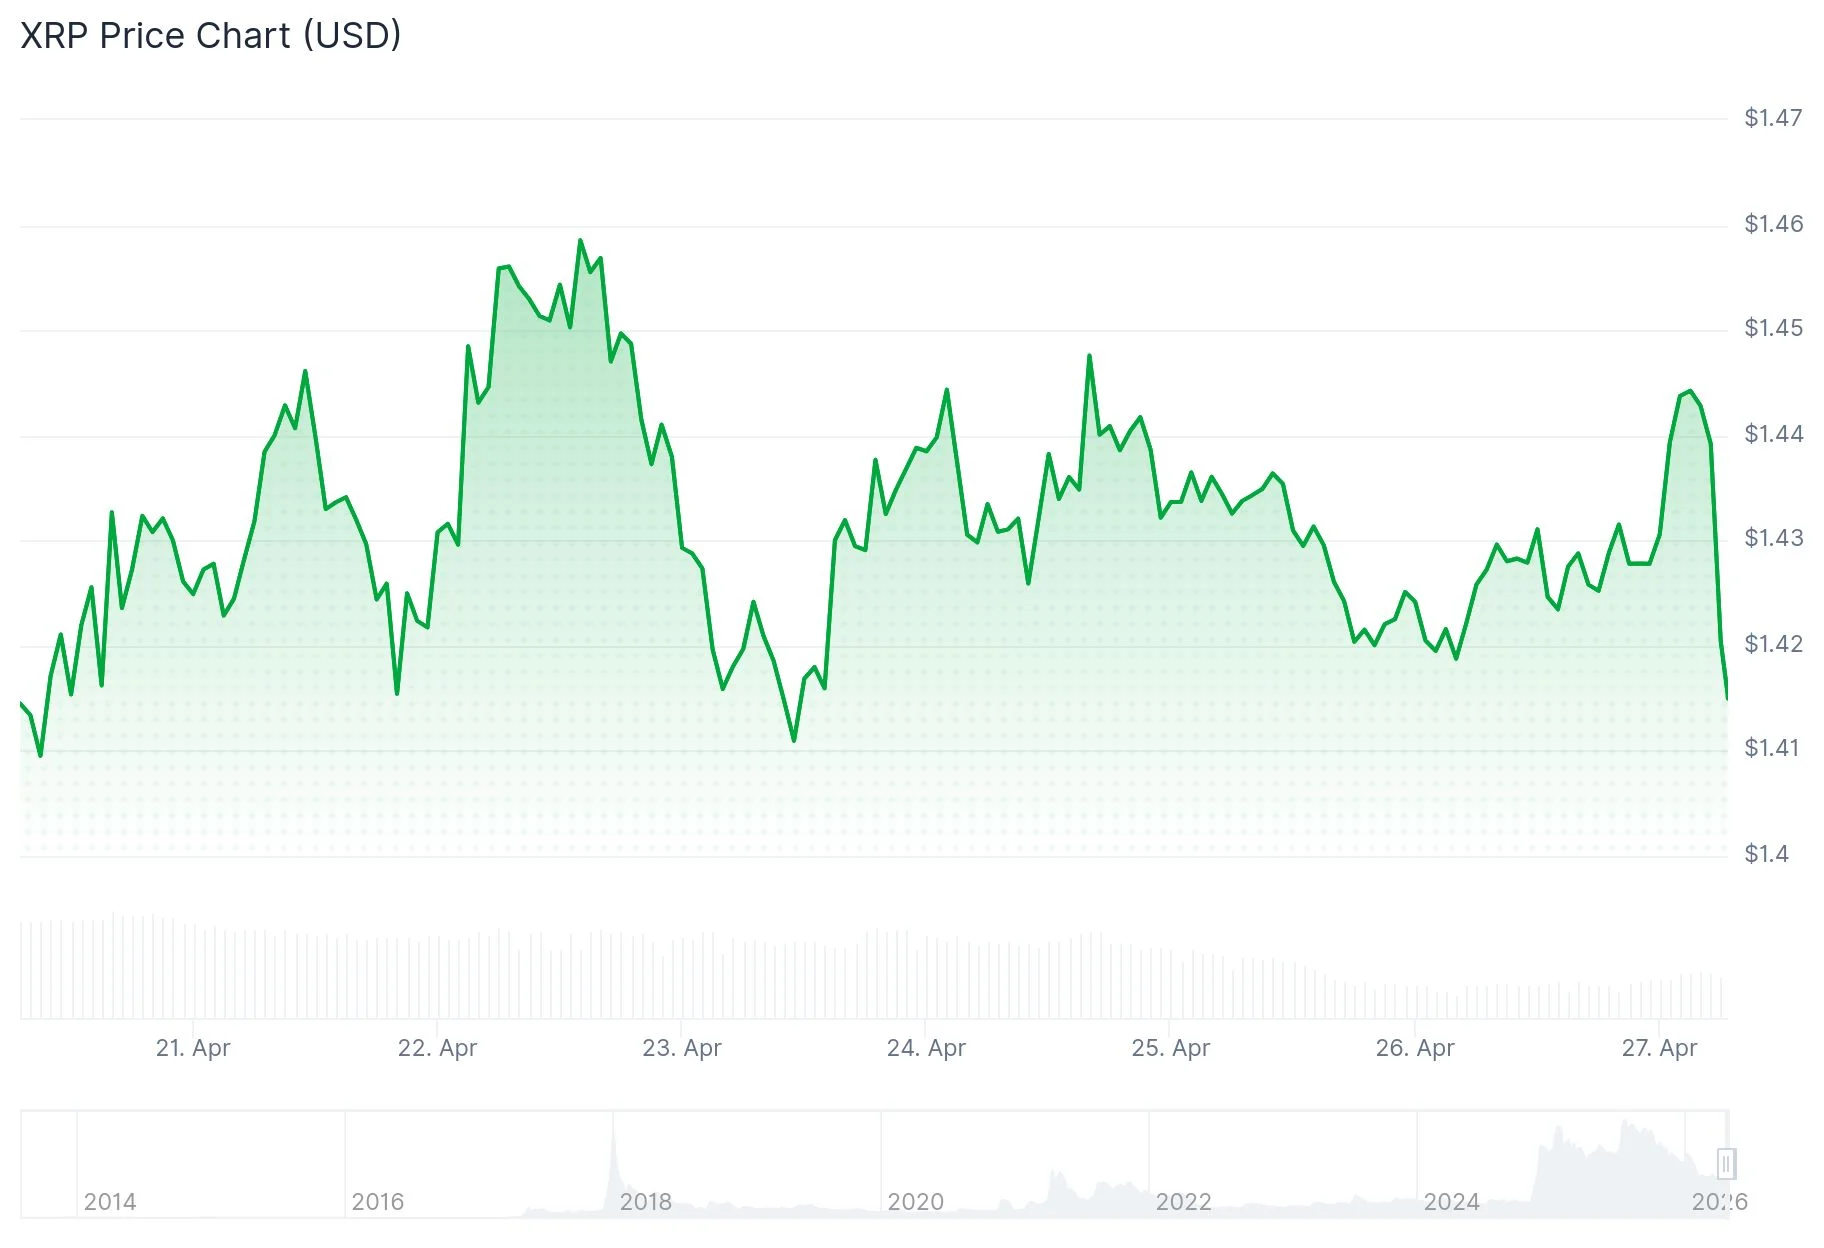
- XRP maintains position at $1.42 with market capitalization of $87.93 billion and 24-hour trading volume of $1.09 billion
- Current consolidation pattern near 20-day and 50-day exponential moving averages indicates compression formation
- Relative Strength Index hovers around 54–55 zone, indicating neutral momentum with bullish undertones
- Breaking through $1.45–$1.50 resistance zone could trigger rally toward $3.00 target
- Failure to hold $1.10 support level may result in decline toward $0.90
XRP maintains its position at $1.42, demonstrating minimal price fluctuation throughout the recent trading period. The 24-hour trading volume registered $1.09 billion, reflecting a modest 4% decrease.
 XRP Price
With a market capitalization steady at $87.93 billion, the digital asset shows characteristics of quiet accumulation rather than aggressive market participation on either side.
Market analyst EGRAG CRYPTO highlighted an interesting shift among traders—moving from traditional candlestick analysis to line chart visualization. This adjustment helps eliminate market noise and provides a clearer view of the broader trend structure.
#XRP – Monthly EMA + Wave 3⃣ Setup:
1⃣ EMA Signal: Holding 50 EMA (Monthly)Last cycle wicked to 100 EMA → final buy zone
 Now: selling pressure fading, structure stronger
2⃣ Key Hypothesis:No deep repeat this time50 EMA = basePossible shallow wick to 100 EMA… pic.twitter.com/pcBunmg1Rn
— EGRAG CRYPTO (@egragcrypto) April 25, 2026
EGRAG CRYPTO’s analysis identifies a compression formation developing in XRP’s price action—characterized by declining highs converging into a well-defined support area. Such configurations often precede significant directional movements as they represent accumulation phases.
The monthly timeframe shows the 50 exponential moving average providing current support. EGRAG CRYPTO also noted the possibility of a brief dip toward the 100 EMA before any substantial expansion phase materializes.
Near-Term Technical Analysis
Analyzing the hourly timeframe reveals XRP reached $1.4471 before experiencing a minor retracement. Price action continues to respect the 100-hourly Simple Moving Average, while a bullish trend line provides support around the $1.4320 level.
Multiple short-duration EMAs—including the 10, 20, 30, and 50 period averages—remain positioned beneath current pricing while generating buy indications. This configuration suggests participants are actively purchasing during minor pullbacks.
Primary resistance emerges at $1.45. Successfully clearing this threshold could enable progression toward $1.4650, subsequently $1.4840, and ultimately $1.50. The next significant barrier beyond these levels stands at $1.5150.
Regarding downside scenarios, immediate support establishes at $1.44, with additional backing at $1.4320. Closing below $1.4320 would likely activate support zones at $1.4050 and $1.40.
Technical Indicators and Critical Levels
The Relative Strength Index registers near 54–55, positioned above the neutral threshold following its recovery from February’s oversold conditions. The MACD indicator generated a modest buy signal, though technical analysts suggest it lacks sufficient strength to validate an imminent breakout.
Additional momentum indicators including the stochastic RSI and commodity channel index remain positioned in neutral territory. This equilibrium among technical tools suggests the market is awaiting a catalyst.
The primary pivot point establishes near $1.41. First resistance appears at $1.51, with subsequent levels identified at $1.72 and $2.04. Support beneath current levels begins at $1.22, extending to deeper zones at $1.10 and $0.90.
XRP currently trades just above the $1.41–$1.43 pivot range, which technical analysts identify as the critical zone that will determine the asset’s next directional movement.
The post XRP Enters Compression Zone as Analysts Forecast Major Breakout Potential appeared first on Blockonomi.


 English (US) ·