
 6 months ago
27
6 months ago
27
The broader market downturn since the beginning of February has affected XRP’s price. The fourth largest crypto by market capitalization has lost 10% of its value over the past week and now trades at $2.30.
This decline has intensified bearish sentiment, leading XRP futures traders to increase their short positions against any potential recovery.
XRP Faces Strong Selling Pressure as Bearish Sentiment Deepens
XRP’s persistent price dip has strengthened the bearish bias against it by its future traders. On-chain data reflects the pessimism as XRP’s long/short ratio indicates that more traders are betting on further downside rather than a rebound this week. As of this writing, this ratio stands at 0.99.
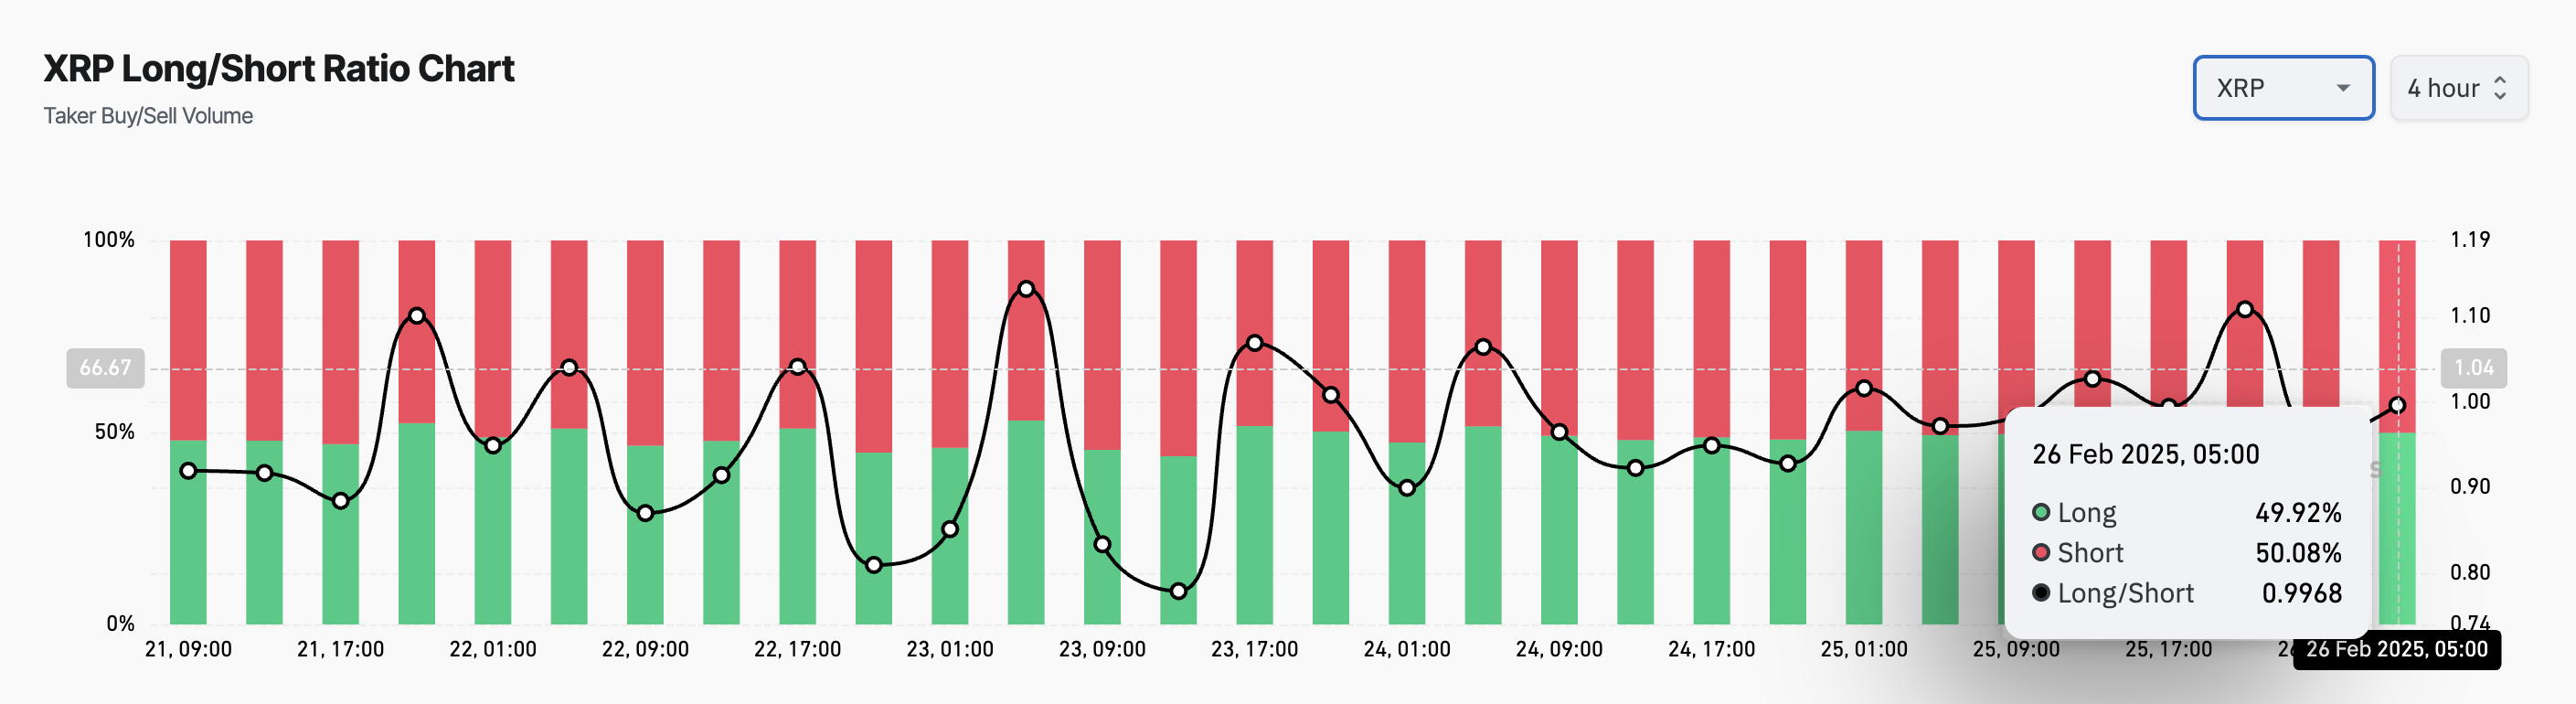 XRP Long/Short Ratio. Source: Coinglass
An asset’s long/short ratio compares the number of long positions (bets that the price will rise) to short positions (bets that the price will fall) in the market. When the ratio is above 1, there are more long than short positions, indicating that more traders are betting on a price increase.
Converesly, as in XRP’s case, a ratio below one suggests that traders are largely betting on a price decline. This signals a strong bearish sentiment in the market, reinforcing the likelihood of further downside.
In addition, XRP’s negative weighted sentiment confirms this bearish bias. At press time, this metric is below zero at -0.66.
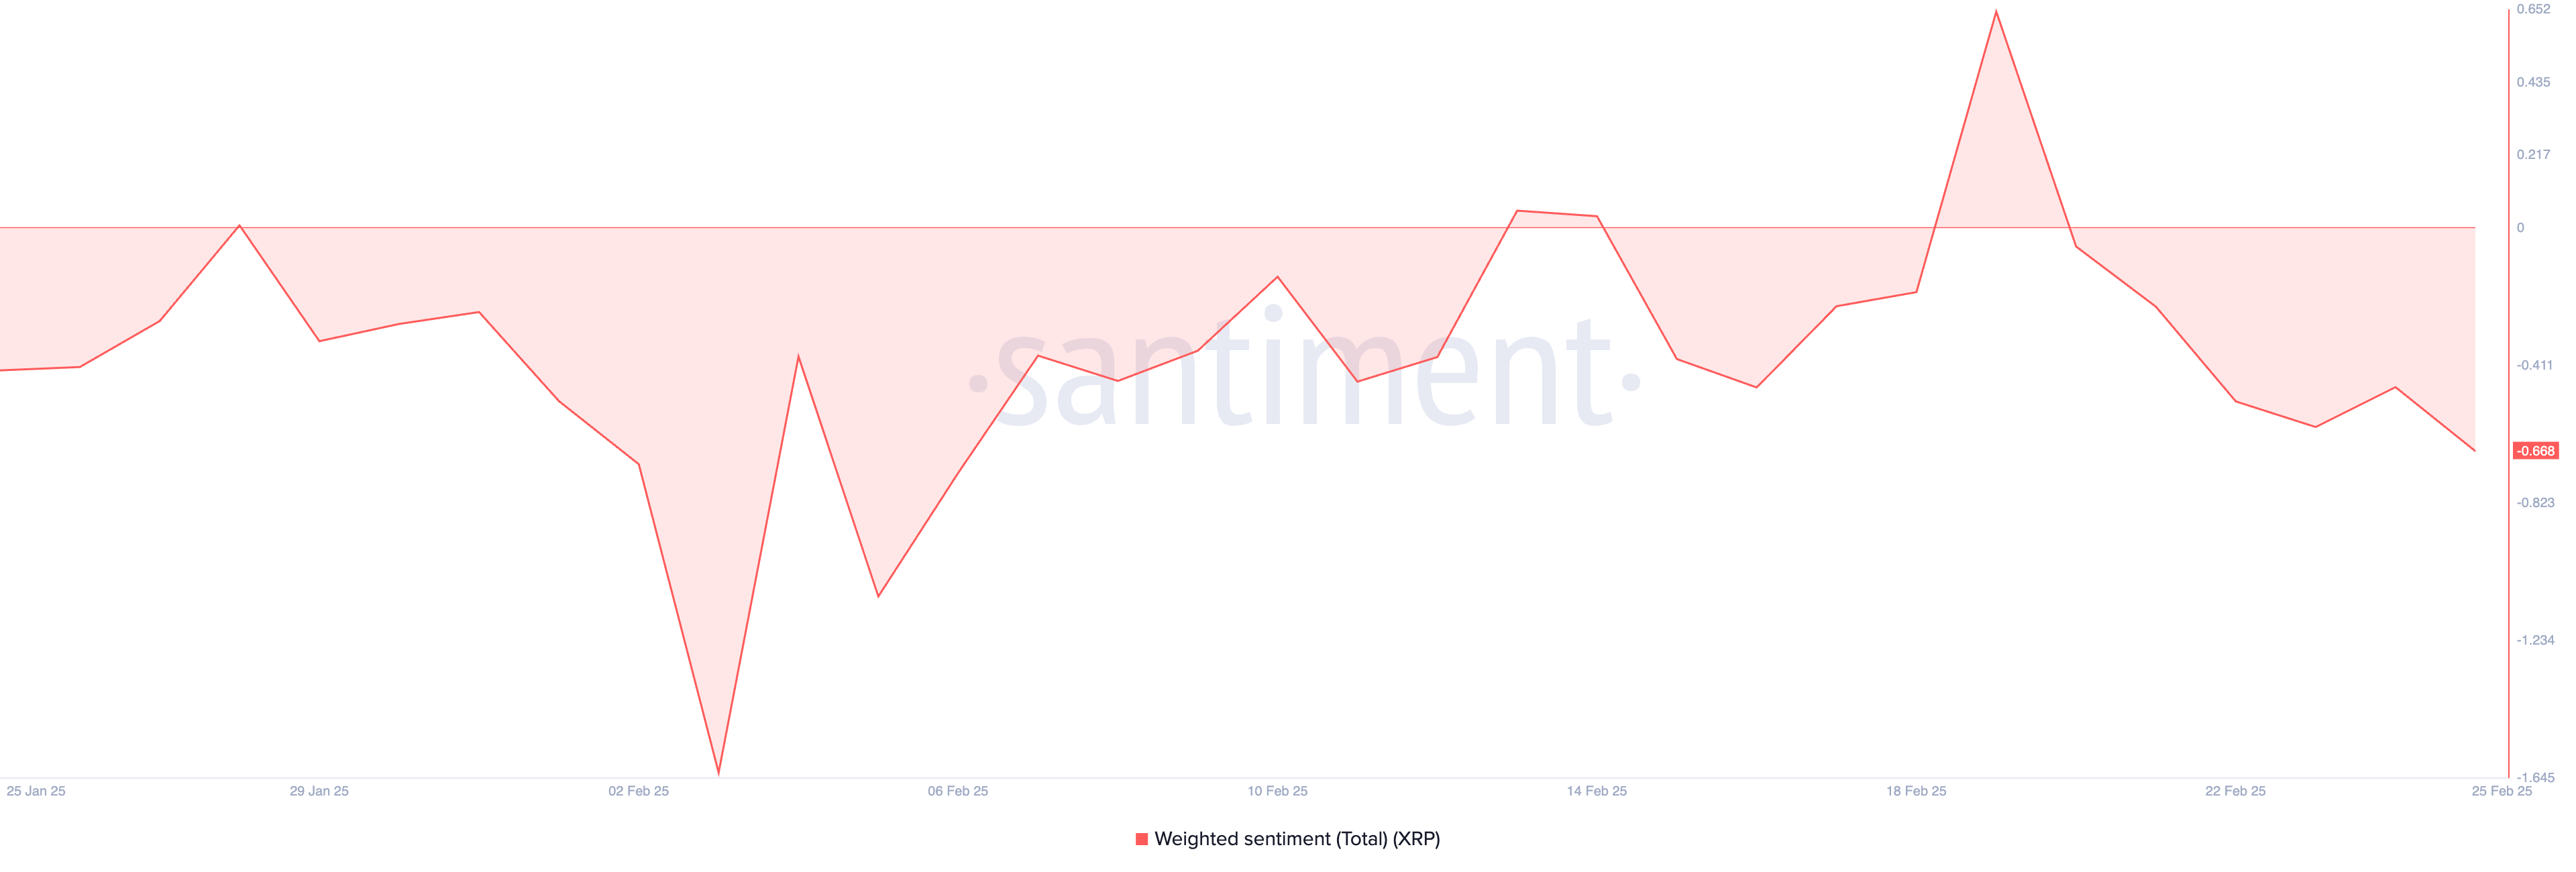 XRP Weighted Sentiment. Source: Santiment
An asset’s weighted sentiment measures its overall positive or negative bias, considering both the volume of social media mentions and the sentiment expressed in those mentions. When it is negative, as in the case of XRP, it is a bearish signal.
It suggests that XRP investors are increasingly skeptical about its near-term outlook, prompting them to trade less and worsening the price dip.
XRP Teeters on Key Support
Since reaching an all-time high of $3.40 on January 16, XRP has traded within a descending triangle. This bearish pattern is formed when an asset’s price creates lower highs while maintaining a strong support level, resulting in a downward-sloping trendline that converges with a horizontal base.
The pattern indicates that sellers are gaining control, and a breakdown below support could lead to further declines. At press time, XRP trades at $2.30, slightly above this support formed at $2.27.
If this line breaks, XRP’s price could drop to $2.13. If selling pressure gains momentum at this level, the token’s value could further dip toward $1.47.
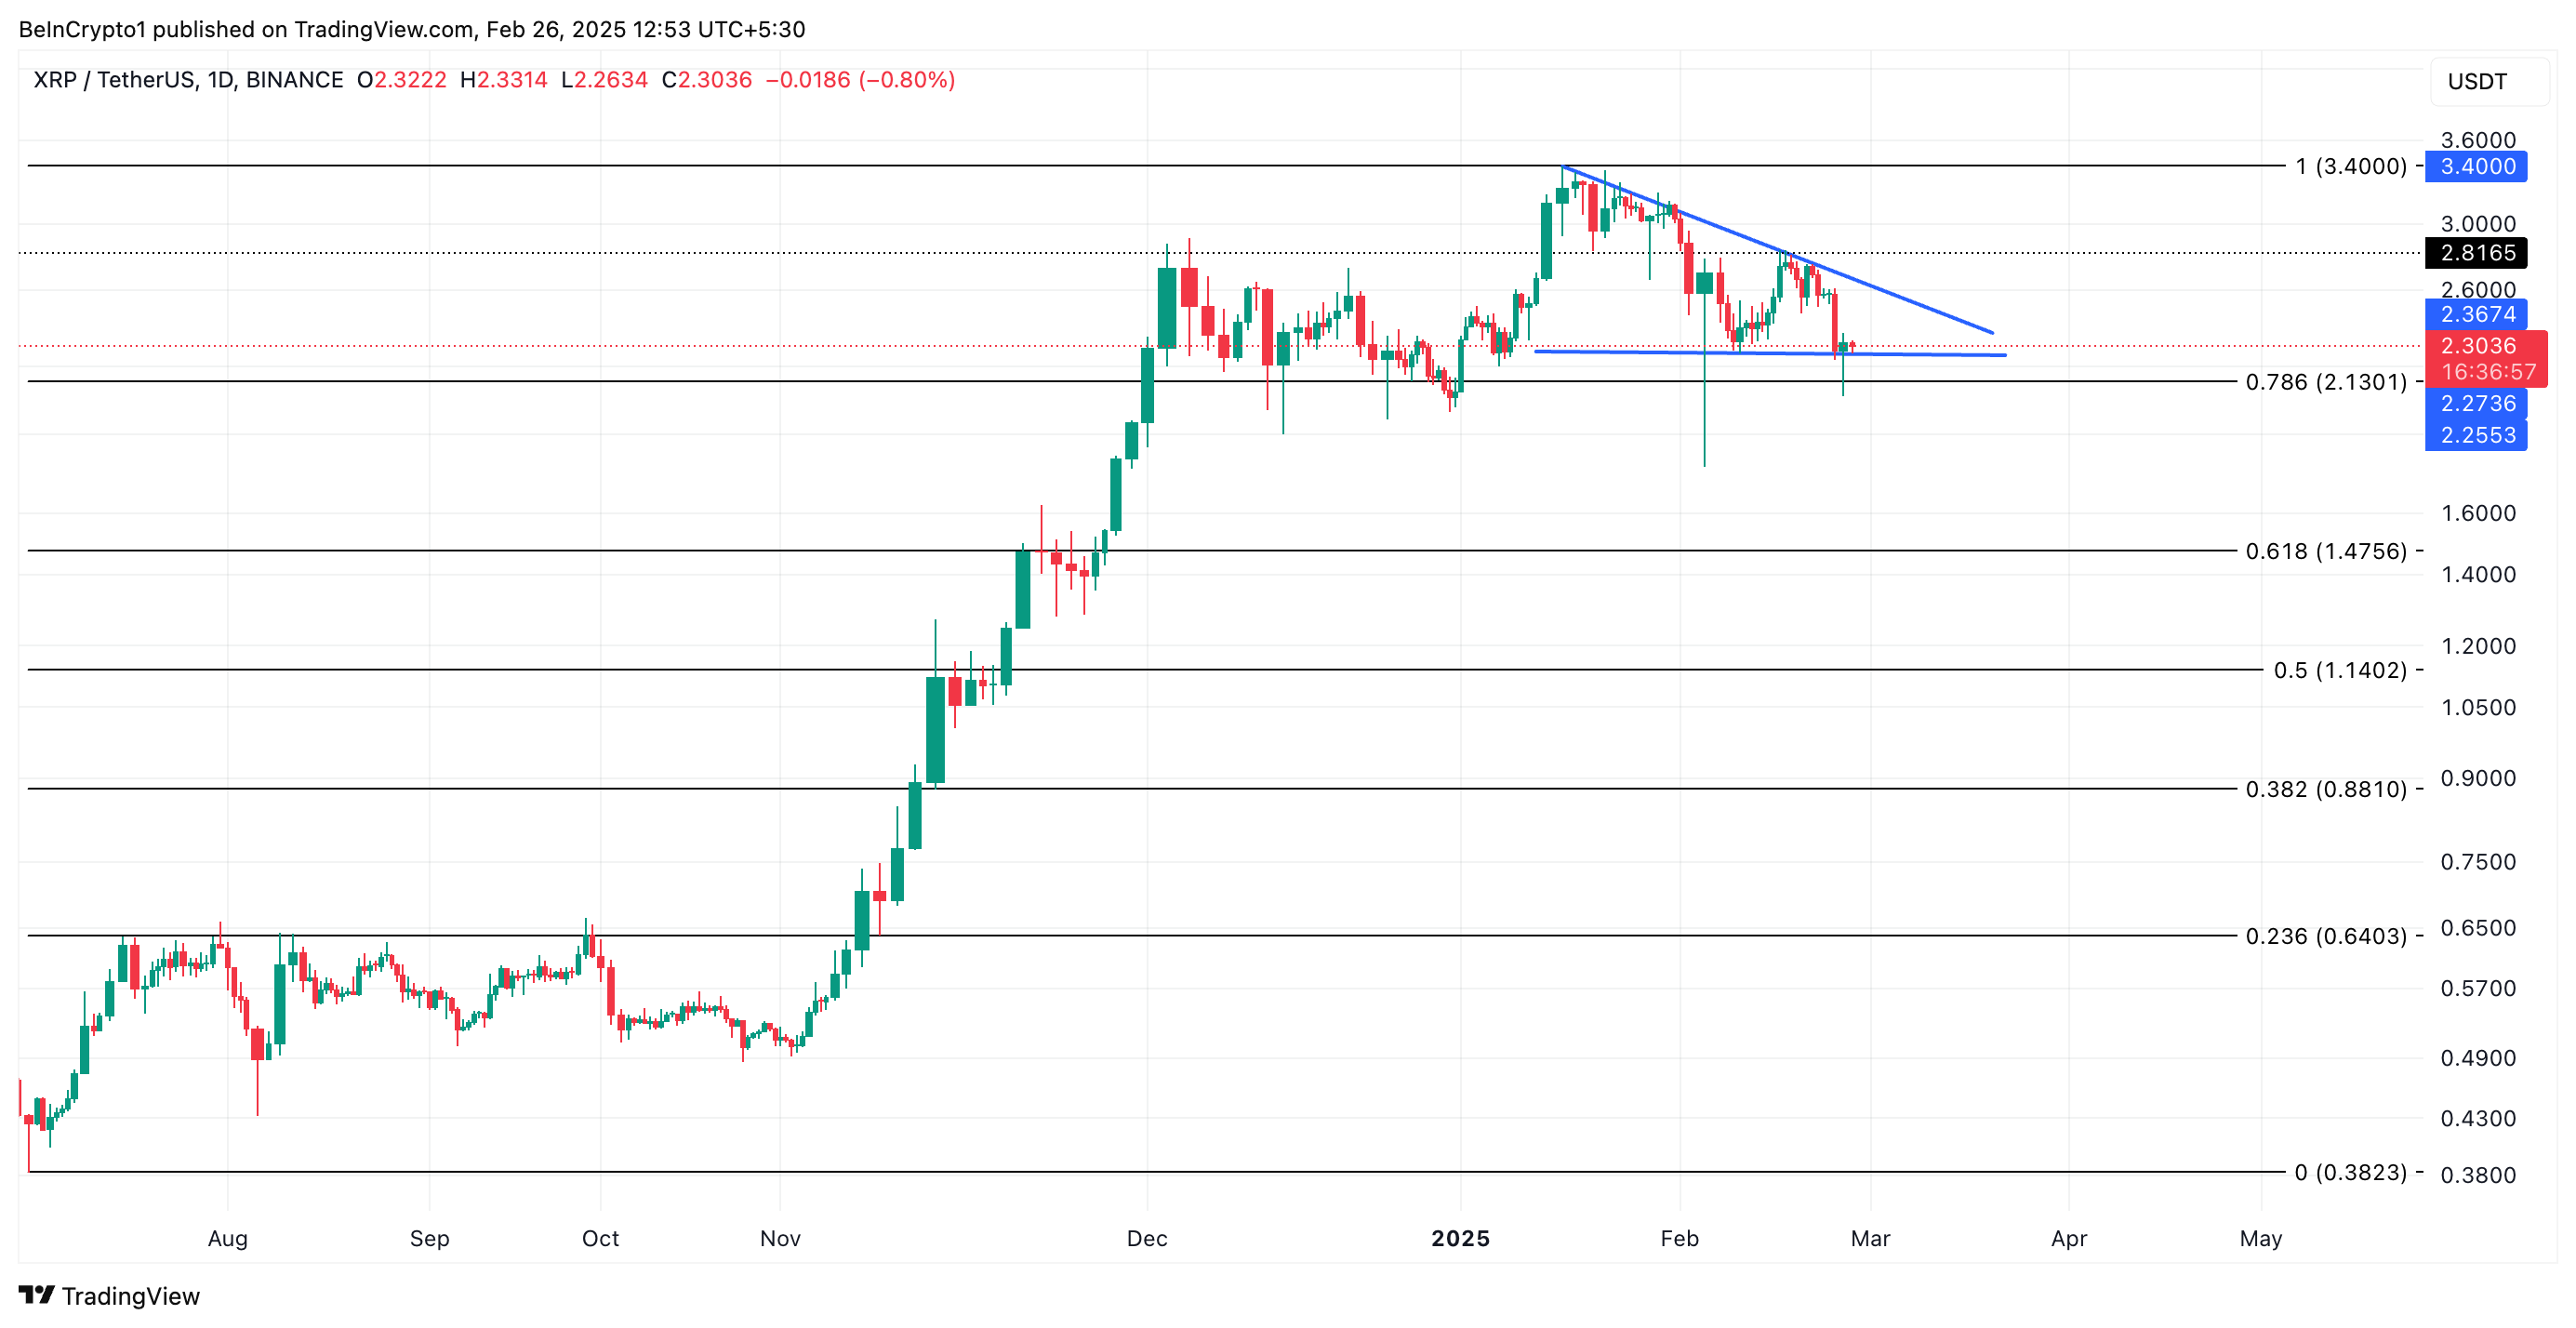 XRP Price Analysis. Source: TradingView
On the flip side, if market sentiment becomes bullish, it would drive up XRP’s demand and could cause its price to break above the descending triangle to reach $2.81.
The post XRP Futures Traders Bet Against Recovery Amid 10% Weekly Price Slump appeared first on BeInCrypto.


 English (US) ·