
 8 months ago
68
8 months ago
68
On-chain data shows the XRP whales have participated in a large amount of net buying recently, a sign that could be bullish for the asset’s price.
XRP Whales Have Gone On An Accumulation Spree Over Last 48 Hours
As explained by analyst Ali Martinez in a new post on X, the XRP whales have increased their holdings recently. The indicator of relevance here is the “Supply Distribution” from the on-chain analytics firm Santiment, which tells us about the amount of supply that any given wallet group is holding right now.
The addresses or investors are divided into these cohorts based on the number of coins that they are carrying in their balance. Wallets with 5 tokens, for instance, go into the 1 to 10 coins group.
In the context of the current topic, the coin range of interest is 10 million to 100 million. At the current exchange rate of the asset, the lower bound converts to $26.5 million and the upper one to $265 million.
The investors falling inside this range are popularly known as the whales. Thanks to their massive holdings, the members of this cohort can carry a degree of influence in the market, which makes their movements worth keeping an eye on.
Now, here is the chart shared by the analyst, that shows the trend in the Supply Distribution of the XRP whales over the last few days:
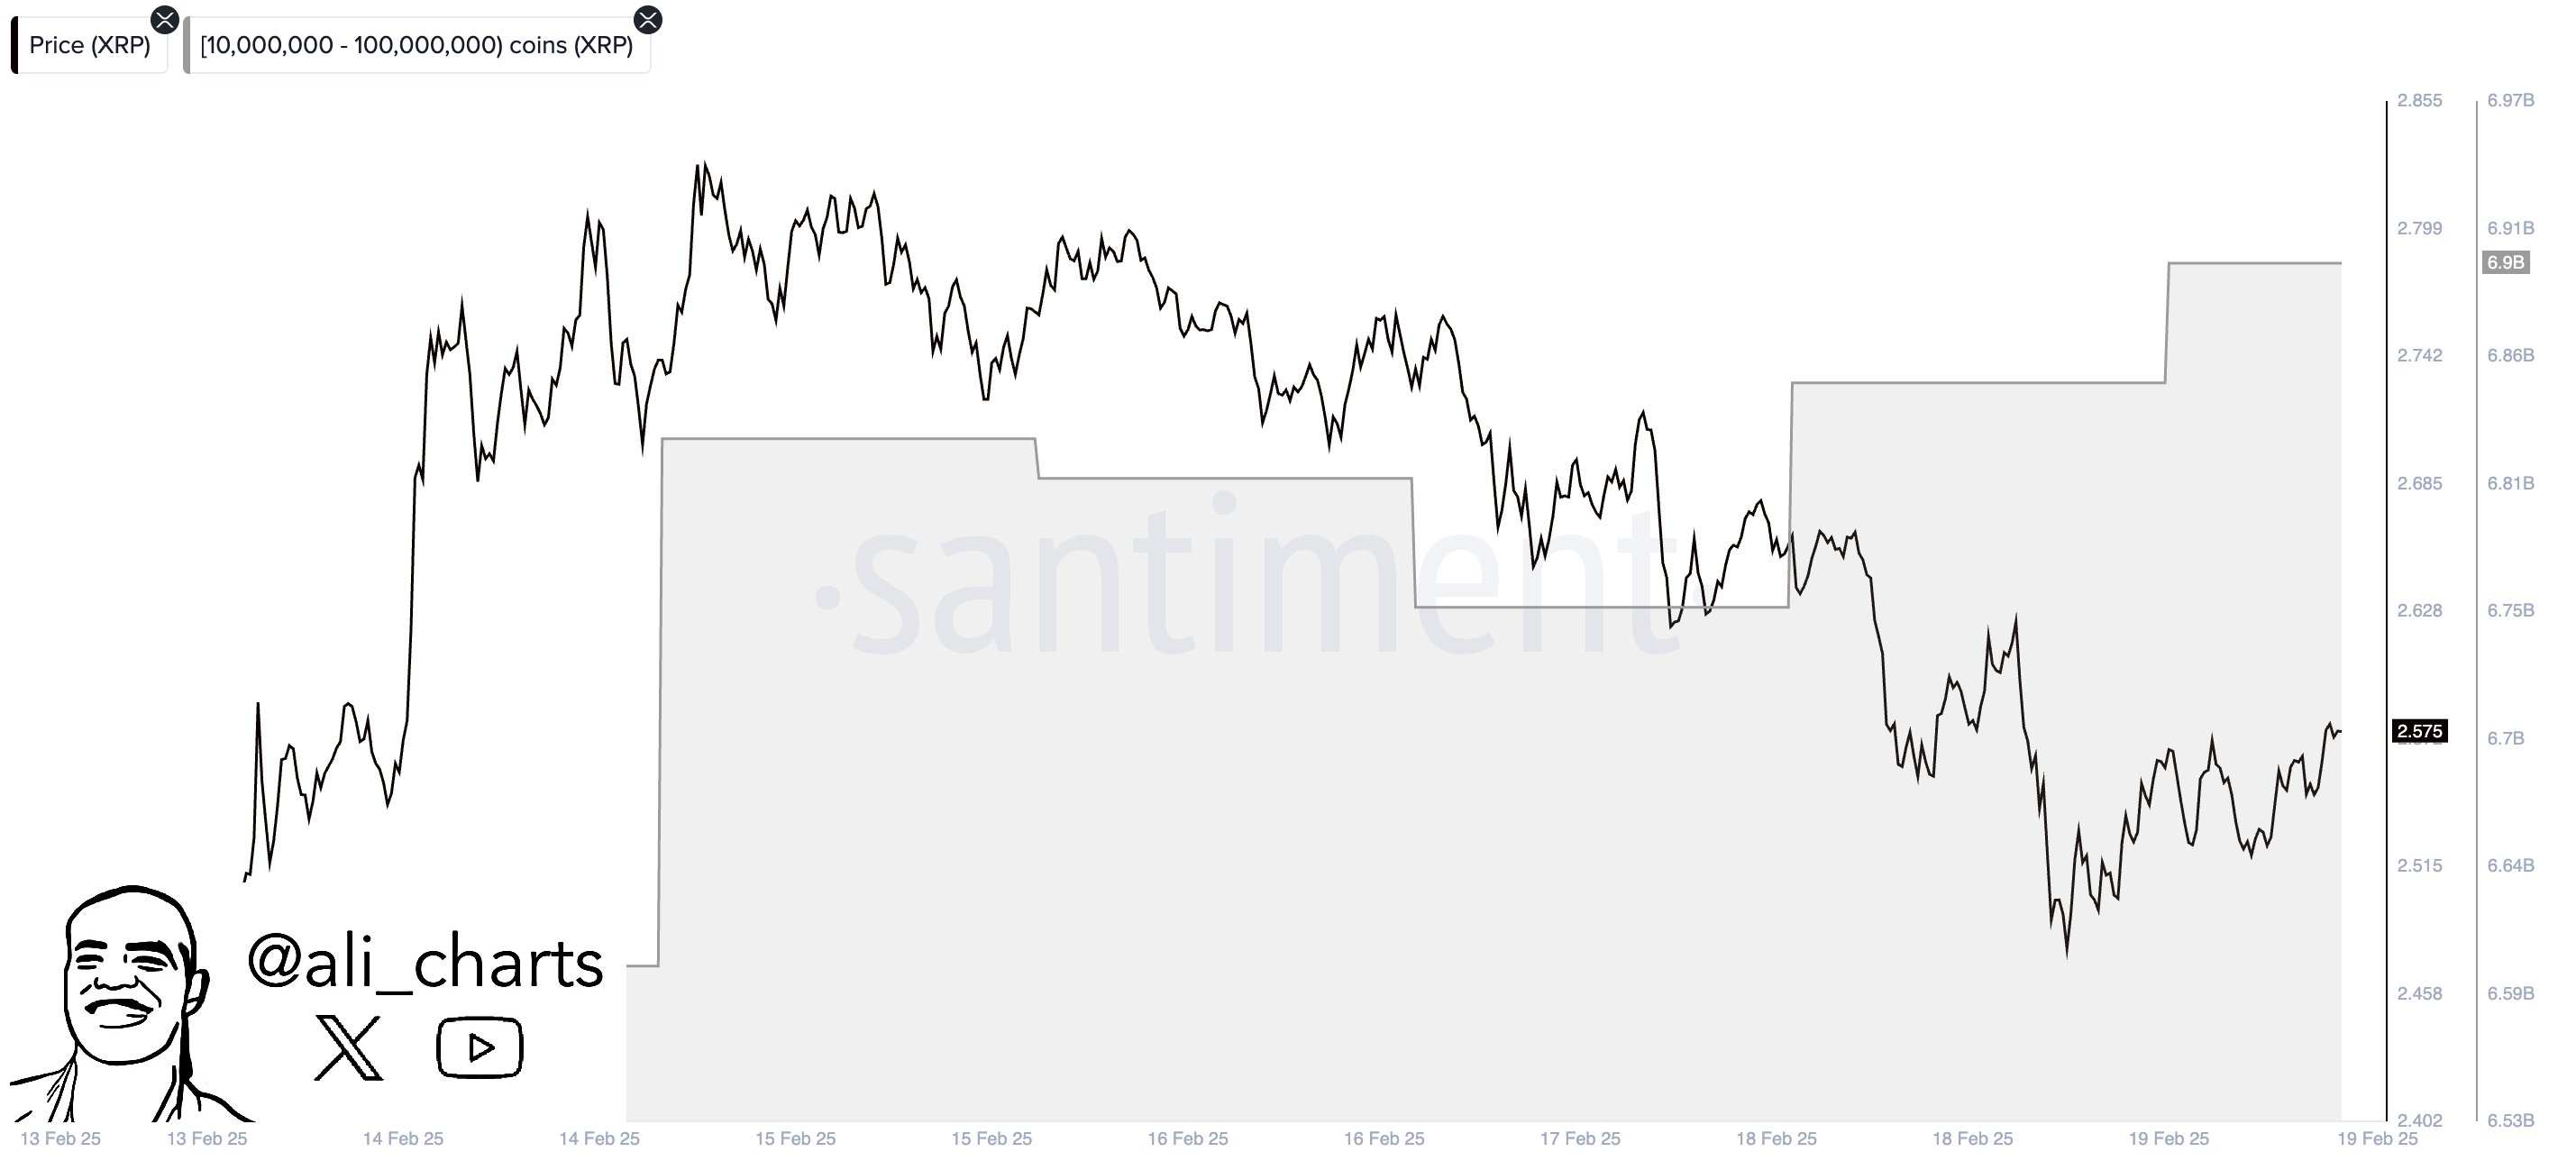
As displayed in the above graph, the XRP whales have seen their supply rise recently, which suggests these humongous entities have been participating in net accumulation.
In total, these investors have added 150 million tokens of the cryptocurrency (worth around $400 million) to their holdings during the last couple of days. This buying from the whales has come as the asset’s price has been going downhill, so it would seem the group believes the dip to be only a temporary one.
XRP Touches $2.68 Following Escape From Ascending Triangle
In another X post, Martinez had pointed out that XRP had been attempting a break out of a potential Ascending Triangle. It would appear that the pattern has held, as the coin’s price has surged since then.
The “Ascending Triangle” is a formation from technical analysis (TA) that appears when an asset’s price witnesses consolidation towards the upside in a channel enclosed by an upper level parallel to the time-axis and a lower one slopped upwards.
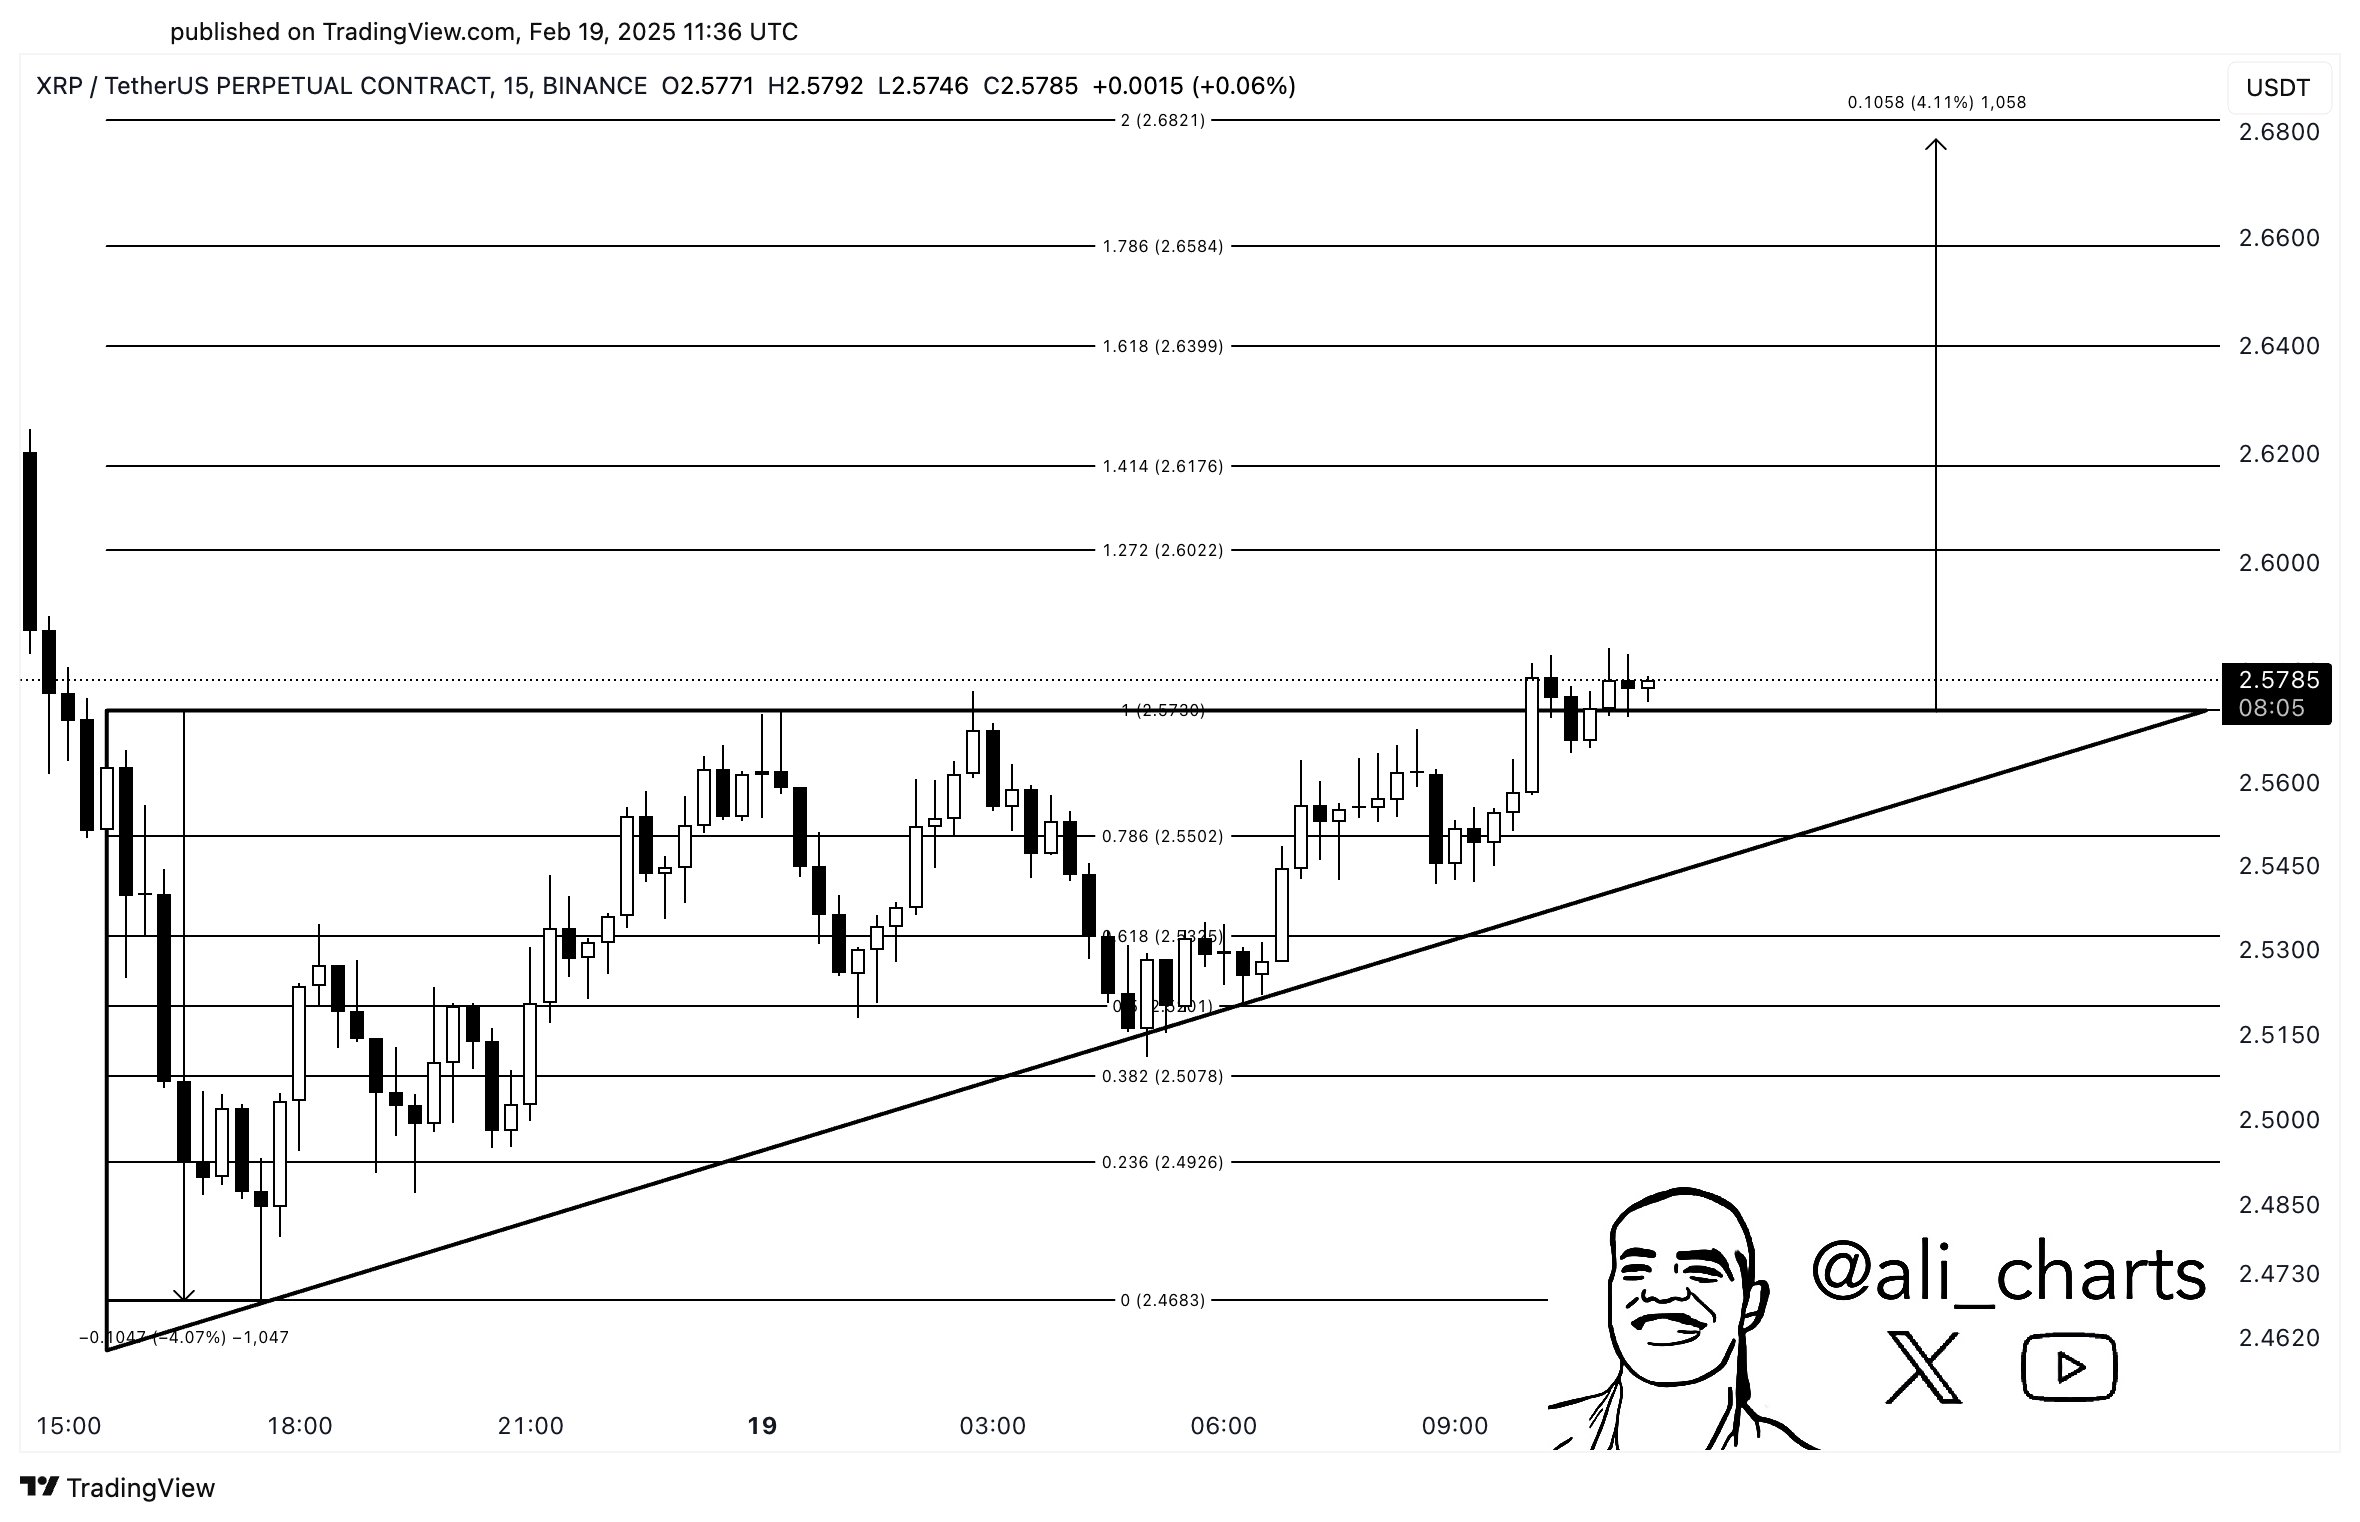
In the post, the analyst had noted, “XRP looks to be breaking out of an ascending triangle on the lower time frames, setting up a potential 4% move toward $2.68!” And indeed, as the latest price chart shows, the coin’s value has jumped following the breakout.


 English (US) ·