Ripple (XRP) has recently experienced a surge in value over the past week, similar to other altcoins. However, it faced a slight dip in the past 24 hours, a setback that, according to the XRP liquidation heatmap, appears to be temporary.
Currently priced at $0.58, XRP’s recent decline is likely a short-term pause. Here’s why this stagnation might soon reverse.
Indicators Bullish for the Ripple Native Token
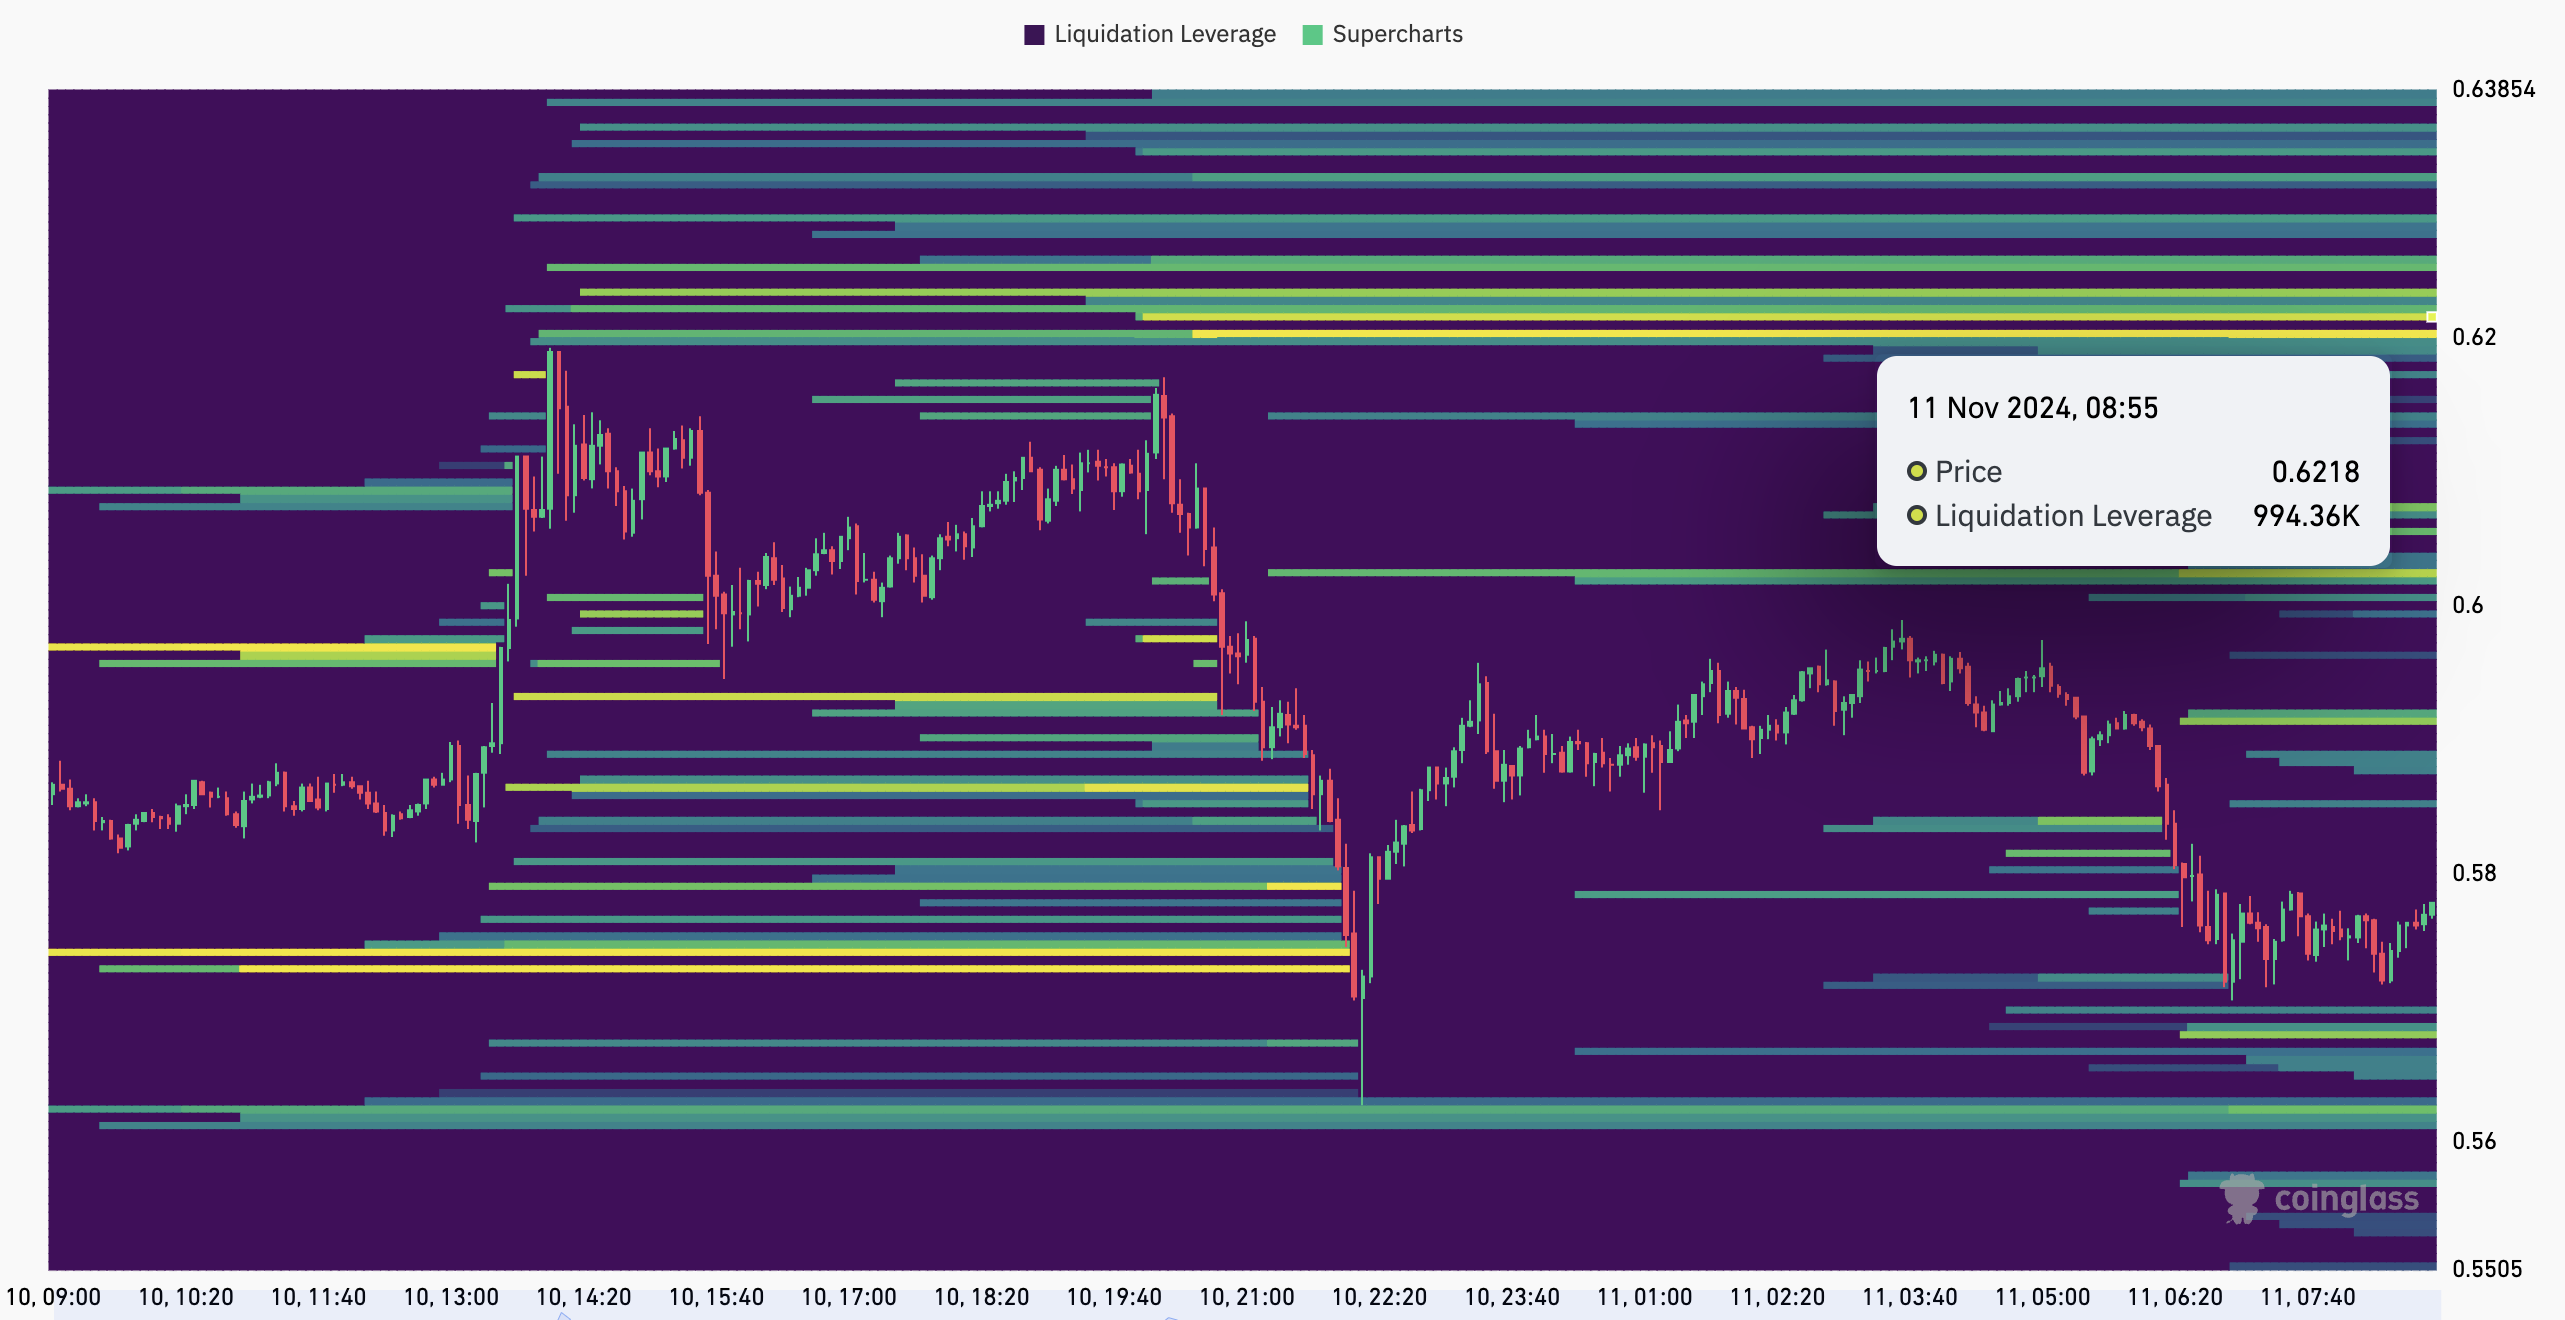
According to Coinglass, XRP has several price levels and a lot of liquidity, but the most notable one is around $0.62. As seen below, the XRP liquidation heatmap color has changed from purple to a clear yellow at that level.
For those unfamiliar, the liquidation heatmap predicts price levels where large-scale liquidations might occur. It also helps traders to identify areas of high liquidity. In most cases, the higher the liquidity, the higher the chances of a price move to that region.
In XRP’s case, a high concentration of liquidity appeared around $0.57 on November 10. But since the altcoin has beaten that region, it means that the next level to reach is the next major one, which is at $0.62.
 XRP Liquidation Heatmap. Source: Coinglass
Further, the Spot Inflow/Outflow metric, which monitors token movement to and from exchanges, is another indicator suggesting a bullish outlook.
When large quantities of tokens flow into exchanges, it can signal an intent to sell, increasing downward price pressure. However, in this case, approximately $5 million worth of XRP has exited exchanges within the last 24 hours.
This outflow suggests that most XRP holders are choosing to hold rather than sell, reflecting a bullish sentiment as investors exhibit confidence in the token’s potential for further gains.
 XRP Spot Inflow/Outflow. Source: Coinglass
XRP Price Prediction: Rally Paused, Not Overruled
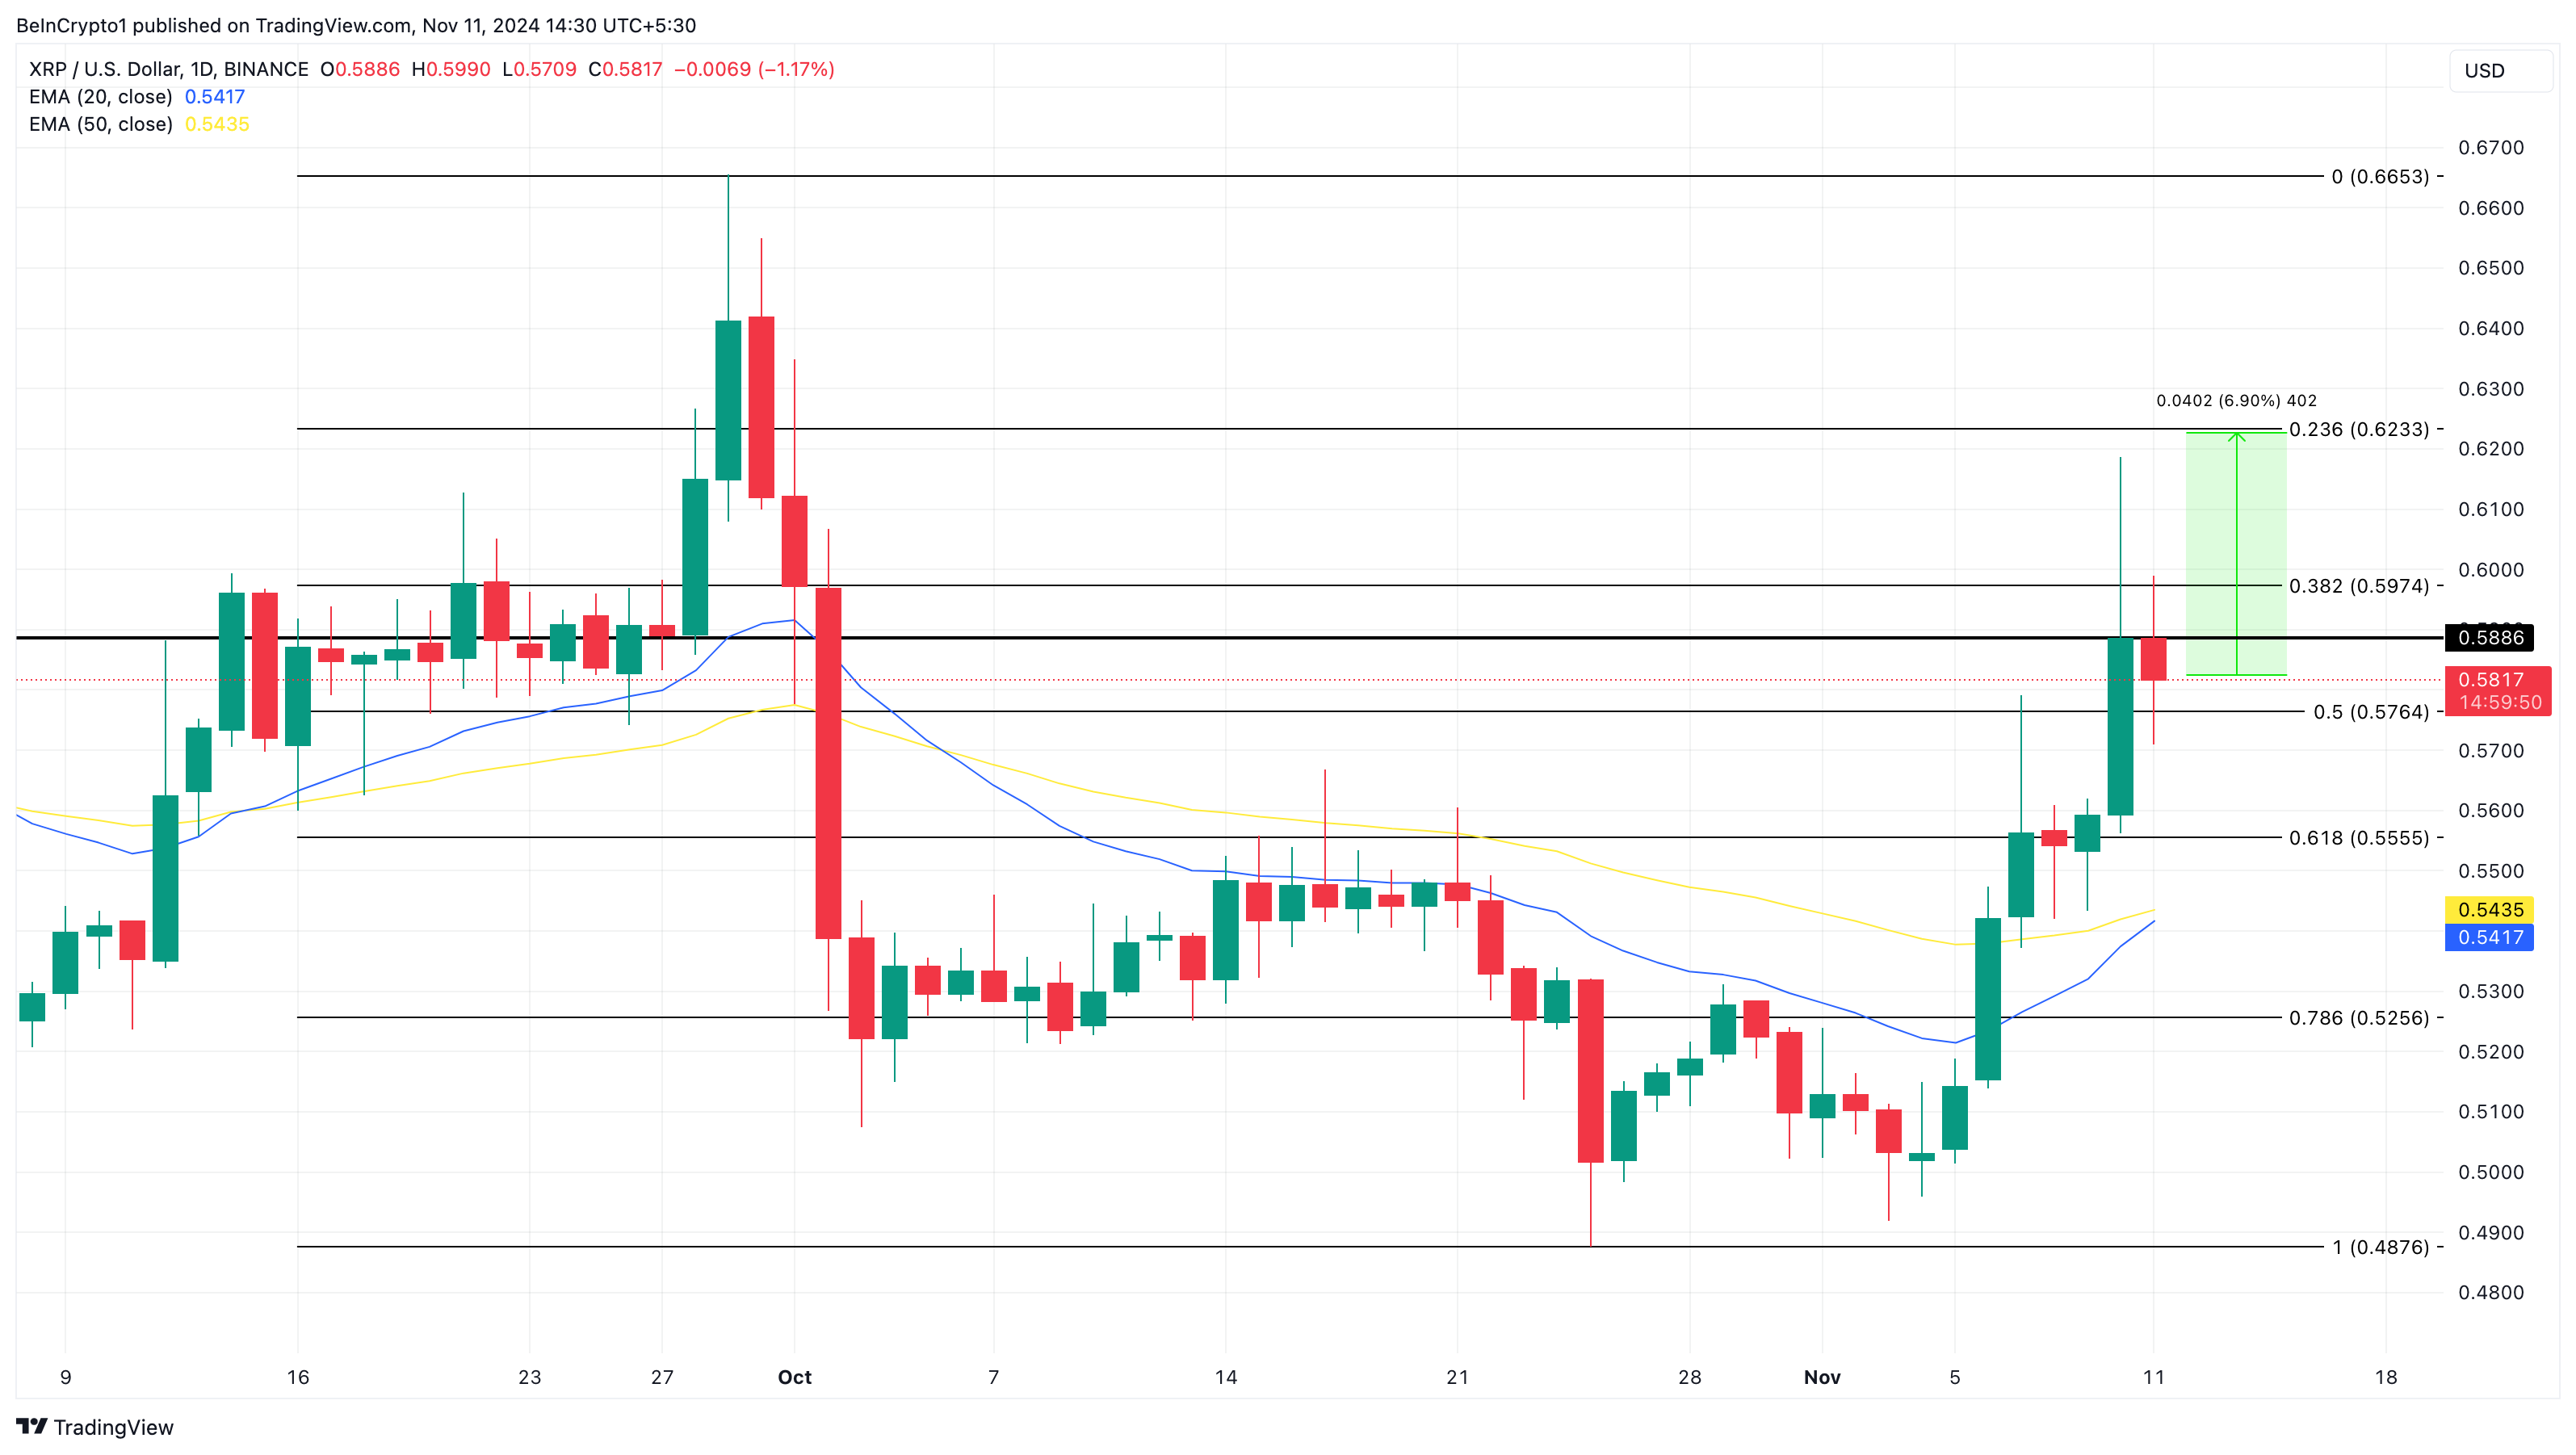
From a technical standpoint, XRP’s price moving above the 20- and 50-day Exponential Moving Averages (EMAs) indicates potential bullish momentum. These EMAs often serve as support and resistance levels, and a price rise above them indicates a bullish trend.
If XRP’s price was below them, then the trend would have been bearish. Therefore, the current reading suggests that XRP could be set up for a further upswing. If that remains the case and buying pressure grows, the altcoin’s value might rise by another 7% to $0.62.
 XRP Daily Analysis. Source: TradingView
 Interestingly, this position is also where the crucial 23.6% Fibonacci level lies. However, if the liquidation heatmap shows a movement of liquidity to a lower area, then the altcoin value might sink. In that scenario, XRP’s price might drop to the 61.8% Fibonacci level at $0.55.
The post XRP Liquidation Heatmap Hints at Quick Surge to $0.62 appeared first on BeInCrypto.

 3 months ago
51


 English (US) ·