
 1 month ago
18
1 month ago
18
XRP price started a fresh rally above the $0.6400 resistance. The bulls are now active above $0.680 and might aim for a move toward $0.800 or even $0.850.
- XRP started a fresh increase above the $0.640 resistance level.
- The price is now trading above $0.670 and the 100 simple moving average (4 hours).
- There is a key bullish trend line forming with support near $0.660 on the 4-hour chart of the XRP/USD pair (data source from Kraken).
- The pair could start a fresh rally if there is a close above the $0.720 resistance zone.
XRP Price Jumps Over 15%
In the past few days, XRP price climbed higher from the $0.530 zone. There was a move above the $0.580 and $0.600 resistance levels. Yesterday, it pumped over 15%, cleared the $0.650 resistance, and outperformed both Ethereum and Bitcoin.
A high was formed at $0.7442 and the price is now consolidating gains. There was a minor decline below the $0.720 level. The price dipped below the 23.6% Fib retracement level of the upward move from the $0.530 swing low to the $0.7442 high.
Ripple’s token price is now trading above $0.660 and the 100 simple moving average (4 hours). There is also a key bullish trend line forming with support near $0.660 on the 4-hour chart of the XRP/USD pair.
On the upside, immediate resistance is near the $0.720 zone. The first key resistance is near $0.7440, above which the price could rise toward the $0.7850 resistance. A close above the $0.7850 resistance zone could spark a strong increase.
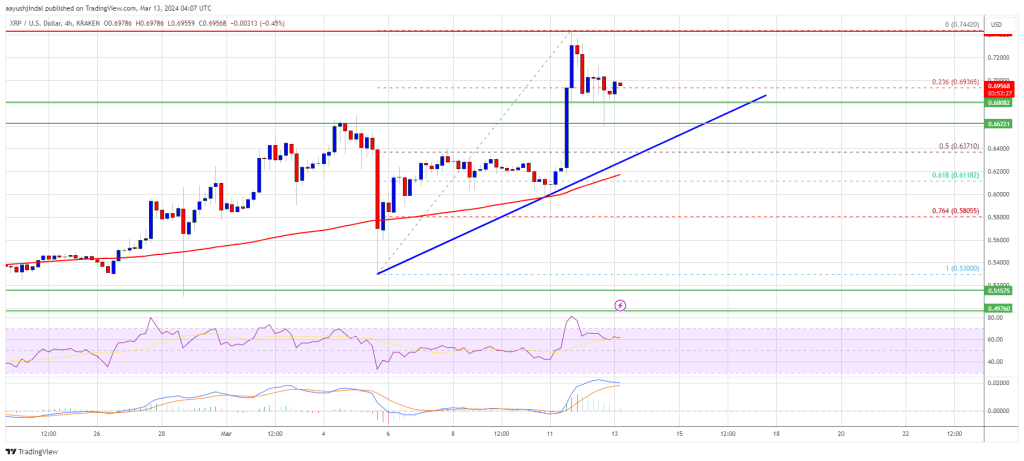
Source: XRPUSD on TradingView.com
The next key resistance is near $0.80. If the bulls remain in action above the $0.80 resistance level, there could be a rally toward the $0.850 resistance. Any more gains might send the price toward the $0.880 resistance.
Another Decline?
If XRP fails to clear the $0.720 resistance zone, it could start another decline. Initial support on the downside is near the $0.660 zone and the trend line.
The next major support is at $0.6350 or the 50% Fib retracement level of the upward move from the $0.530 swing low to the $0.7442 high. If there is a downside break and a close below the $0.6350 level, the price might accelerate lower. In the stated case, the price could retest the $0.600 support zone.
Technical Indicators
4-Hours MACD – The MACD for XRP/USD is now losing pace in the bullish zone.
4-Hours RSI (Relative Strength Index) – The RSI for XRP/USD is now above the 50 level.
Major Support Levels – $0.6600, $0.6350, and $0.600.
Major Resistance Levels – $0.720, $0.7440, and $0.800.


 English (US) ·