
 2 months ago
27
2 months ago
27
XRP price is forming a textbook cup and handle pattern that projects a 16.64% breakout, but two on-chain signals warn that the rally faces structural sellers stacked just above current levels.
XRP (XRP) trades at $1.41 on April 27, sitting inside a falling channel handle that has held since April 17 and pressing against a tight cluster of moving averages. The chart looks ready to break out. Beneath it, exchange flows and cost basis distribution data tell a different story.
Cup and Handle Pattern Sets Up a Bullish Breakout Trigger
XRP is forming a cup and handle pattern, a bullish continuation structure where price recovers from a low in a U-shape, then consolidates in a shallow downward pullback before breaking out. The cup formed between late March and mid-April, with XRP bottoming near $1.27. The handle is the falling channel that has developed since the April 17 peak, and price is now testing the upper boundary.
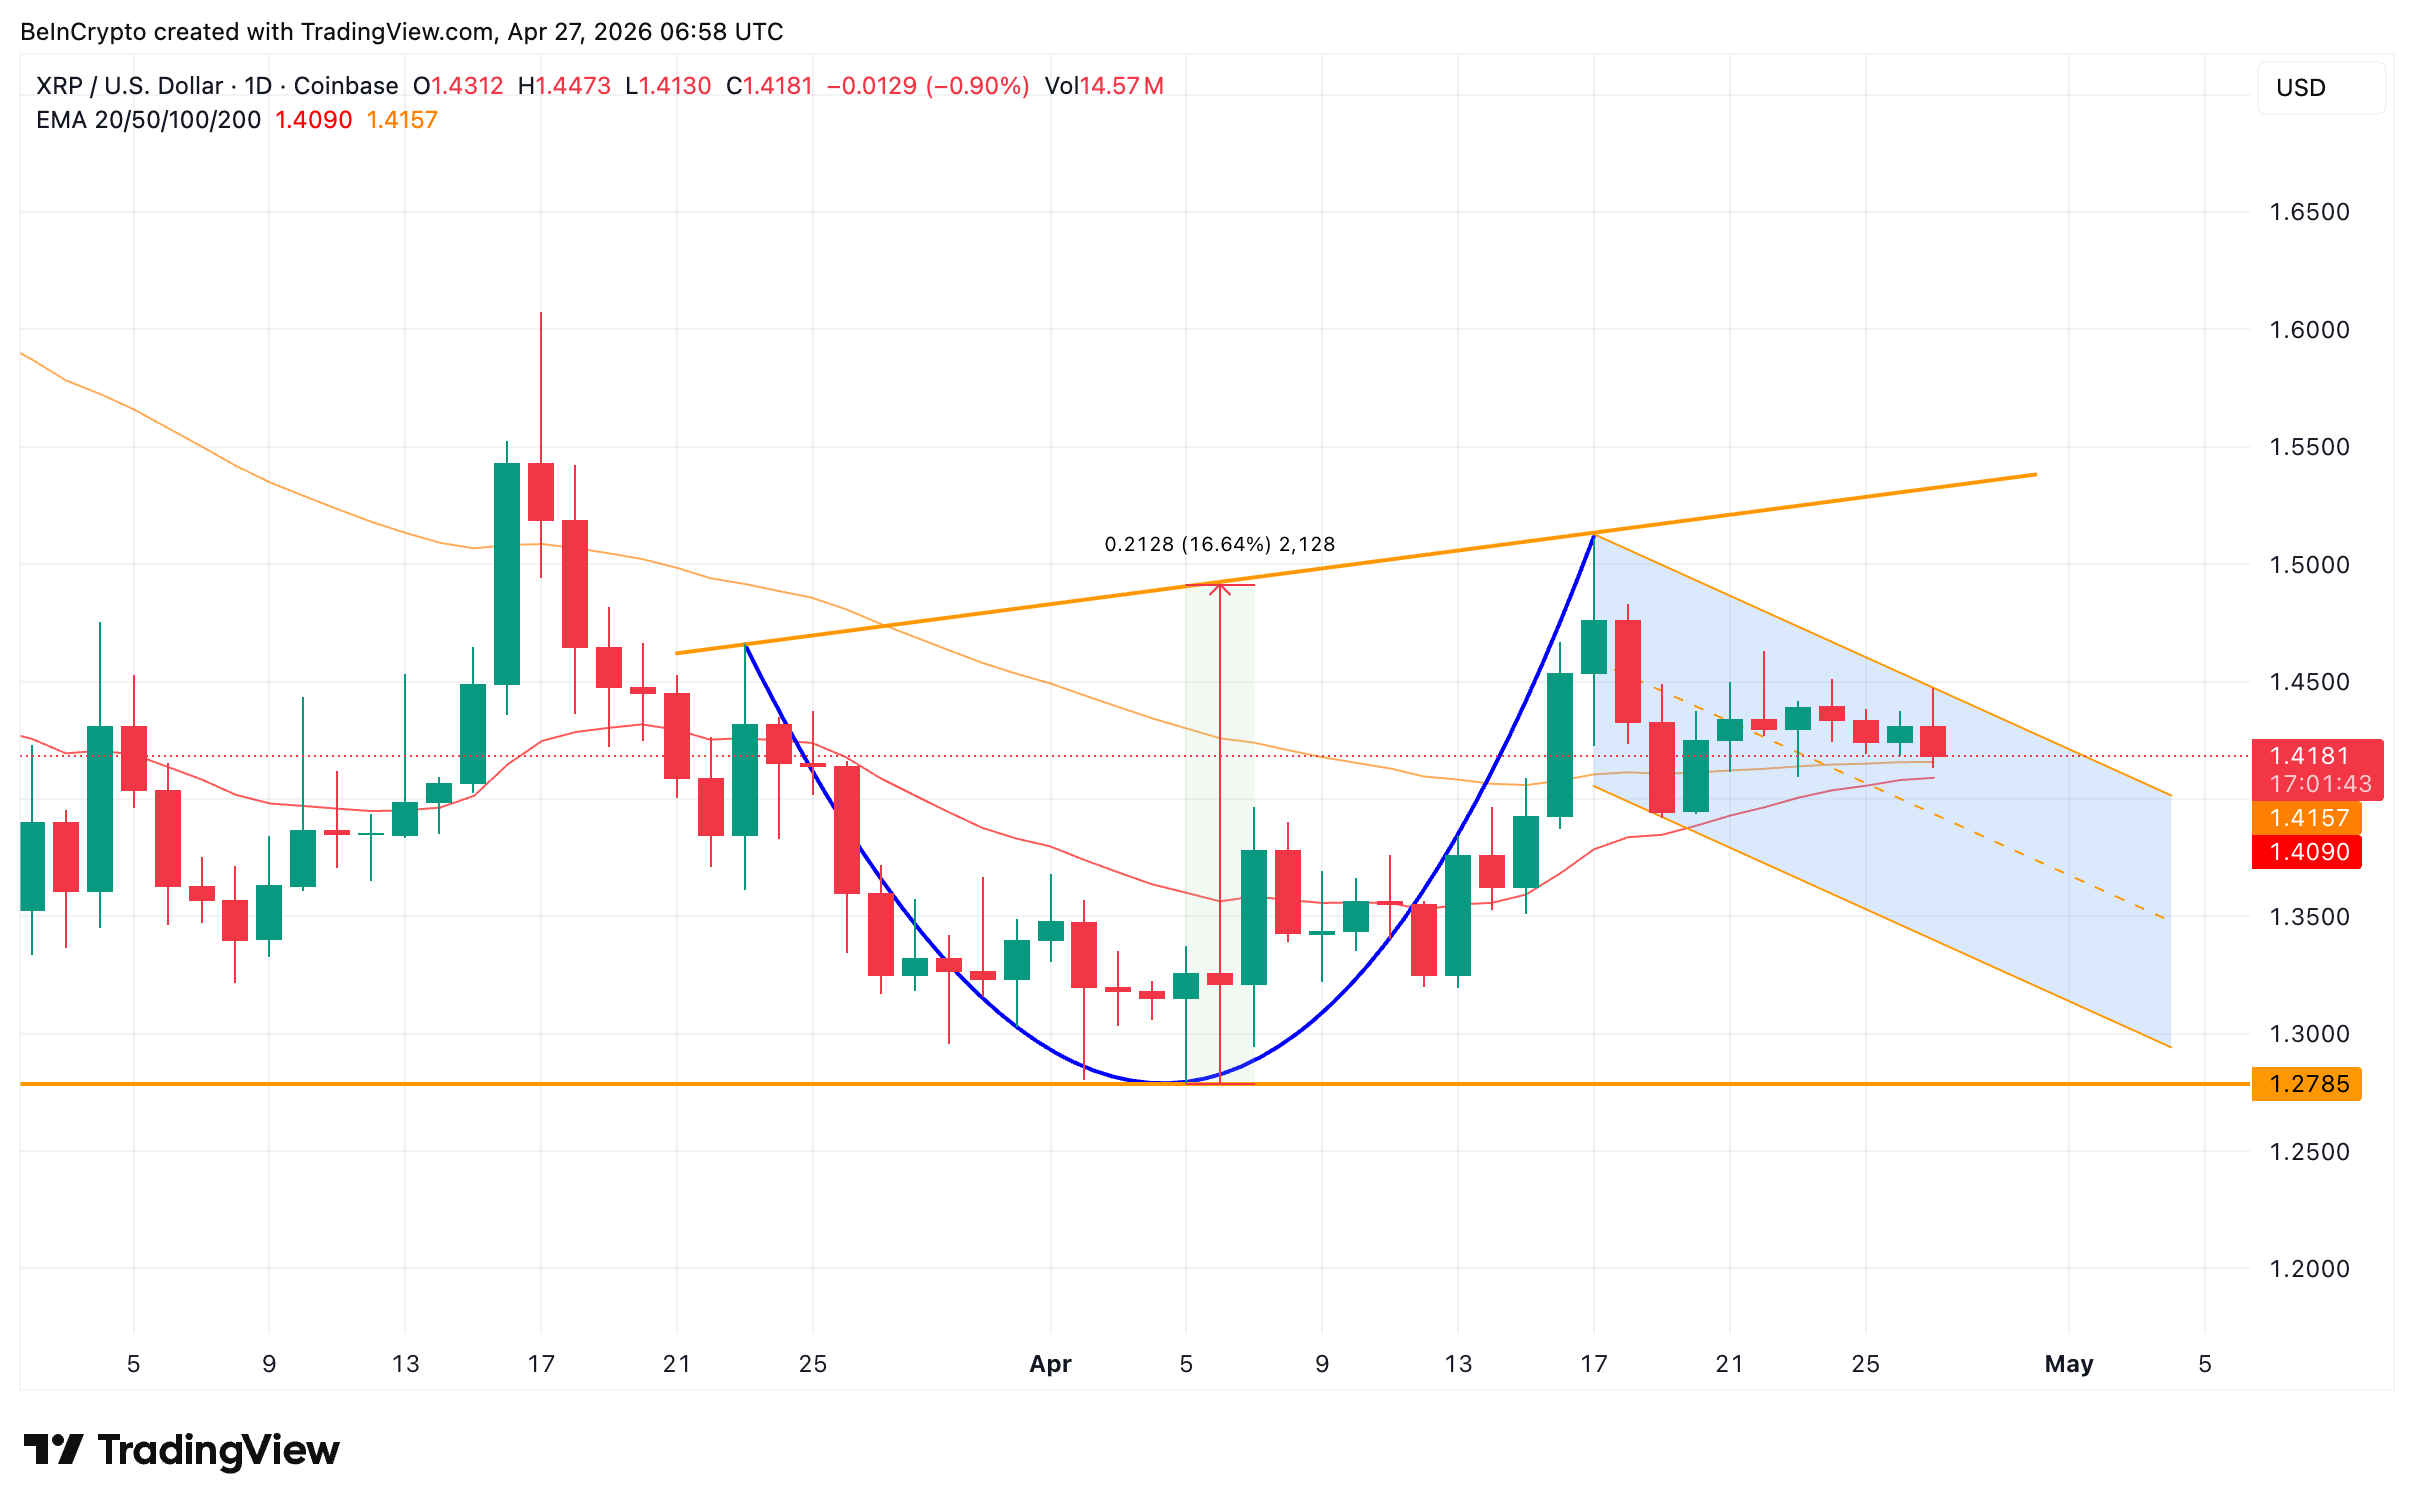 Cup and Handle Analysis: TradingView
Want more token insights like this? Sign up for Editor Harsh Notariya’s Daily Crypto Newsletter here.
The momentum picture supports the bullish read. XRP is trading above its 20-day Exponential Moving Average (EMA) at $1.40 and 50-day EMA at $1.41, where EMA is a trend line that averages price with more weight on recent candles. Both moving averages are converging tightly, setting up a potential golden cross, where the shorter-term moving average crosses above the longer-term one and historically signals the start of a new uptrend.
A handle break combined with the golden cross would activate the cup-to-peak measured move of 16.64%. However, this is the bullish case. The on-chain data points the other way.
Exchange Inflows and a 1.16 Billion XRP Sell Wall Threaten the Breakout
The first warning comes from XRP’s Exchange Net Position Change, an on-chain metric that tracks whether tokens are flowing into or out of exchanges, with positive readings signaling sell-side bias as holders move coins to trade.
On April 24, the metric printed +4.56 million XRP. By April 26, that figure had jumped to +55.29 million XRP, a roughly 12-fold increase. This marked three consecutive days of accelerating exchange inflows. Token holders are moving XRP onto exchanges in size, a positioning shift that historically precedes selling pressure.
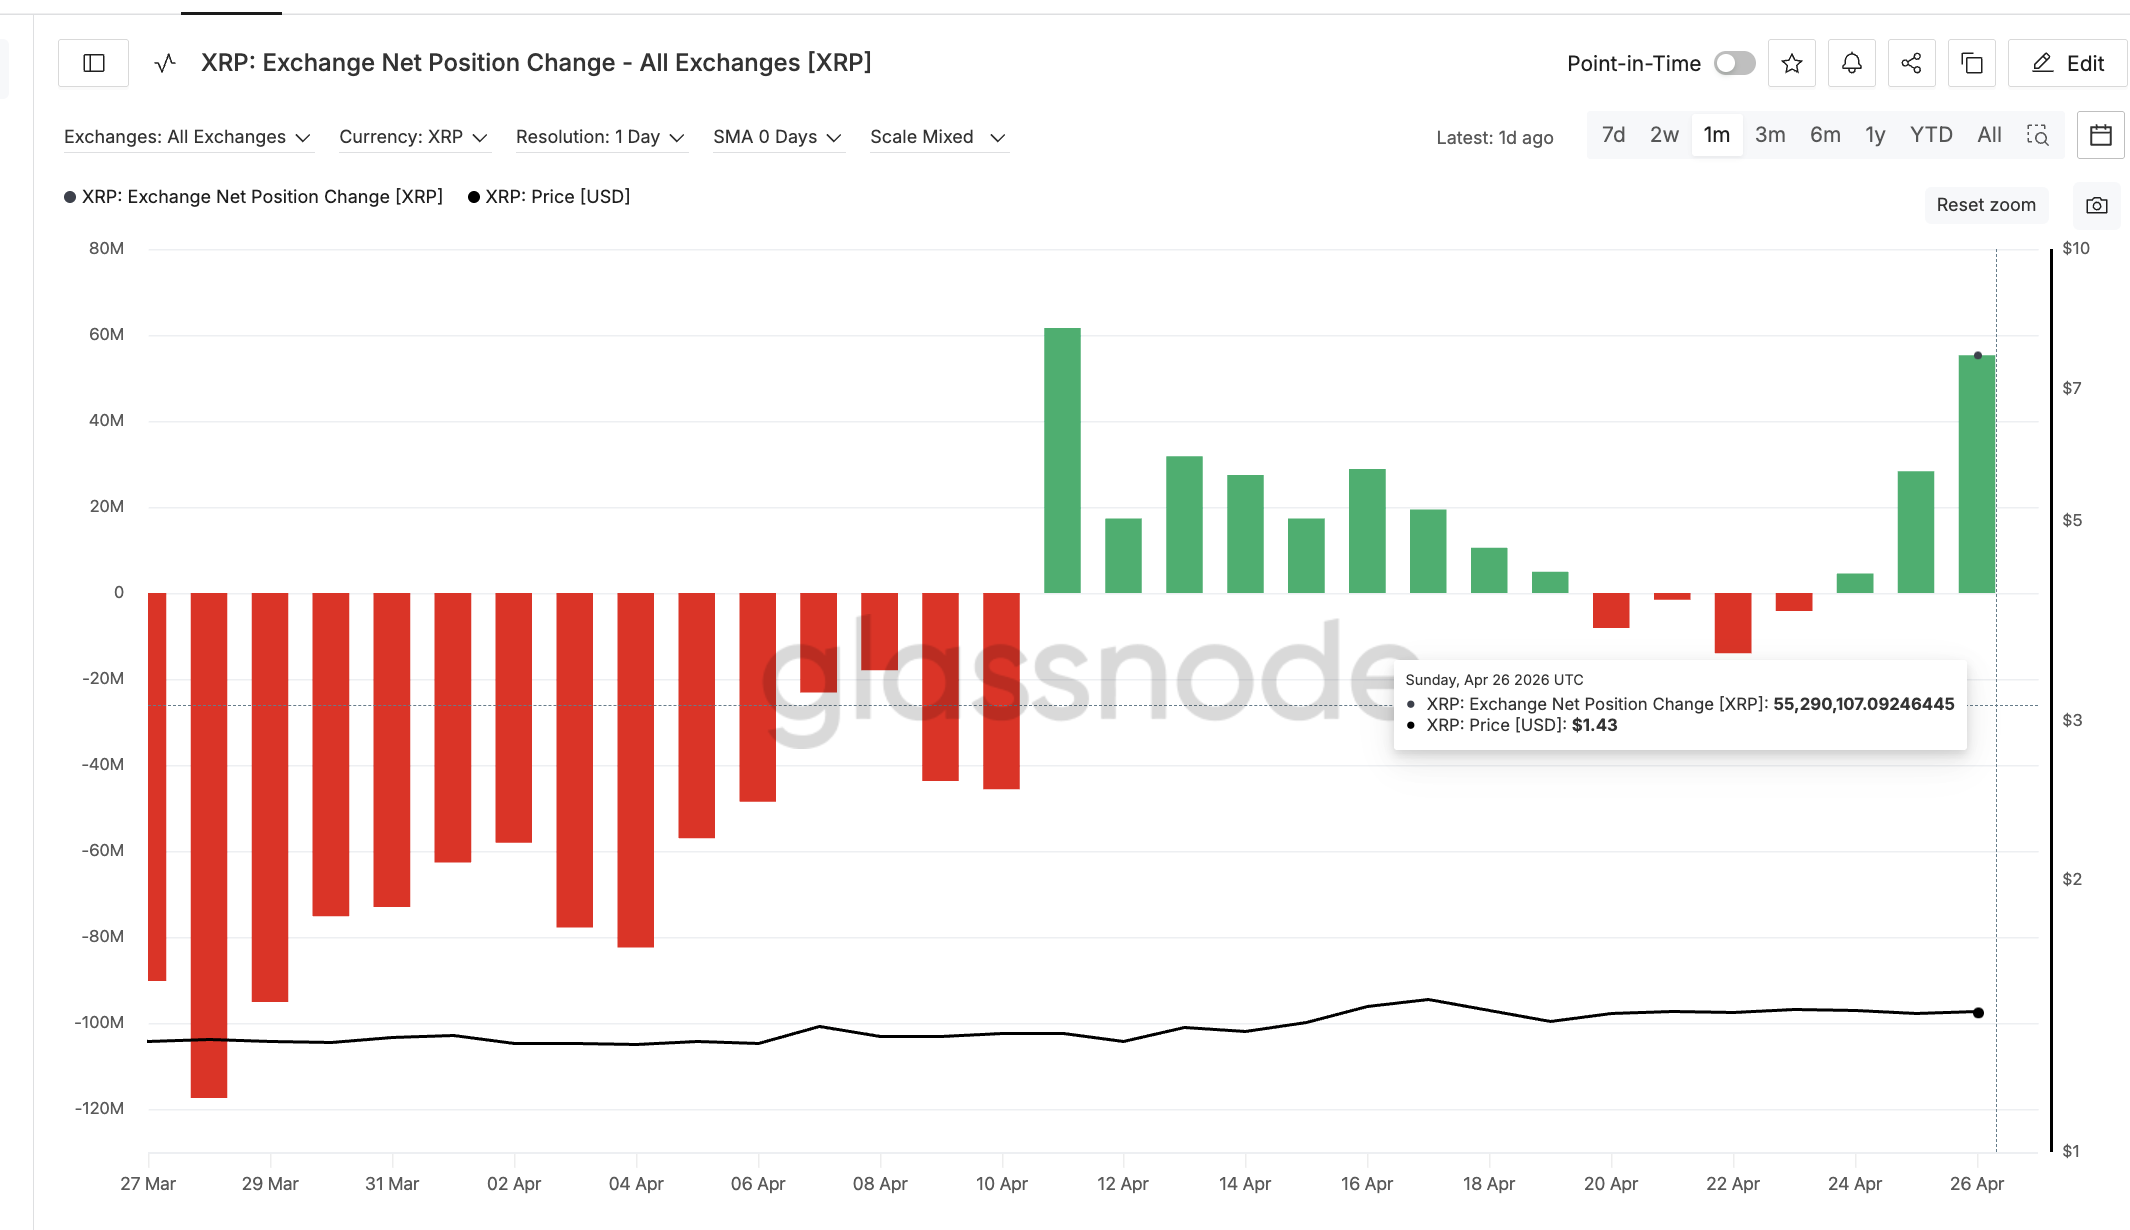 Exchange Net Position Change: Glassnode
The second warning sits directly above current price. Glassnode’s Cost Basis Distribution Heatmap, a metric that maps how much XRP supply was acquired at each price band, shows a heavy supply cluster between $1.45 and $1.46.
Roughly 1.16 billion XRP sit at this exact cost basis, holders who bought in this zone and have been underwater since the recent decline. As XRP rallies into this band, those wallets reach break-even and have a structural incentive to sell. The exchange inflows confirm some of this positioning is already happening.
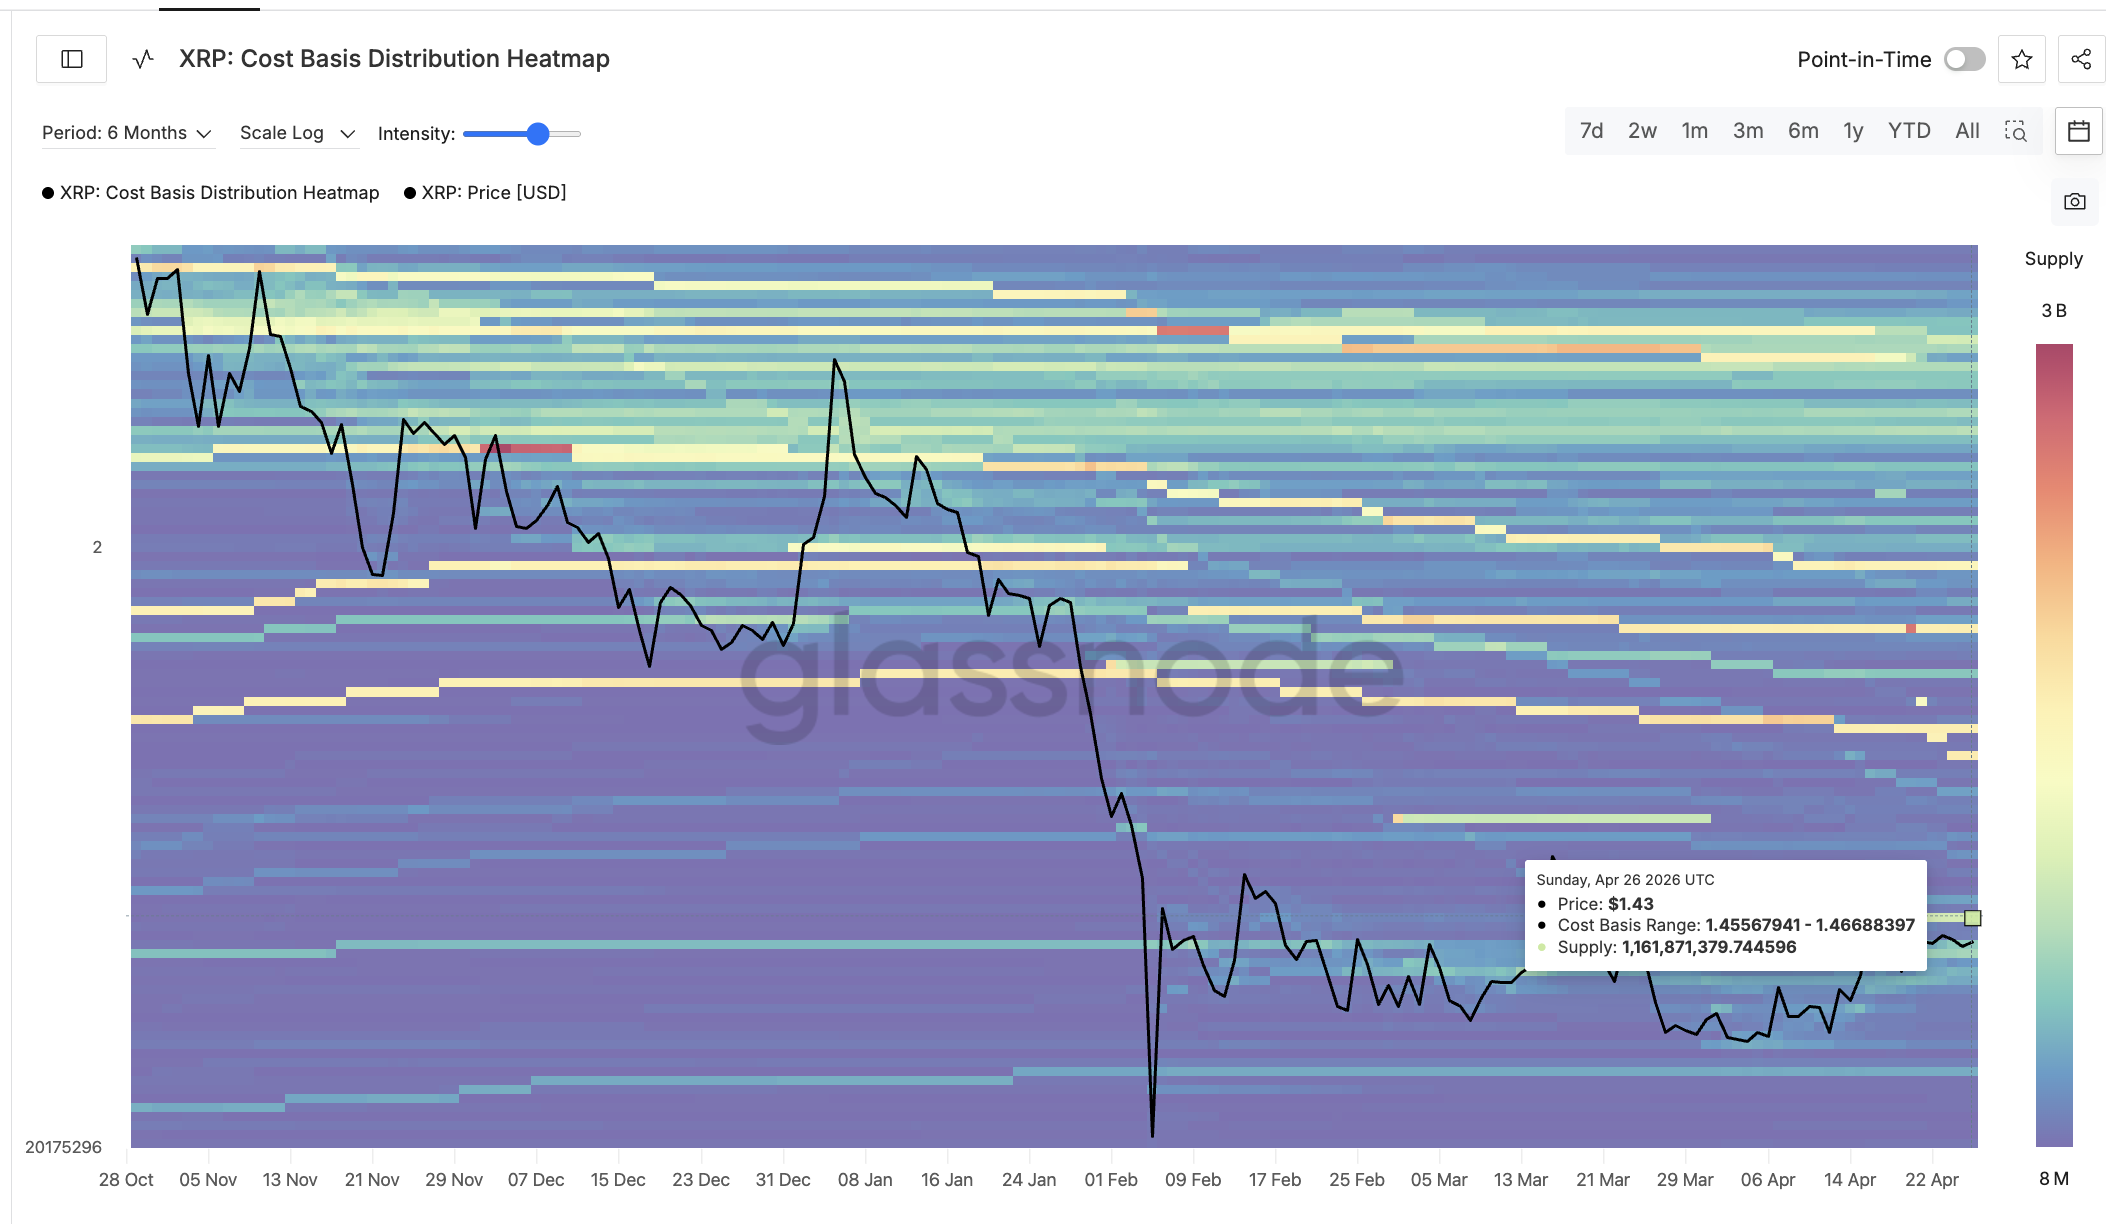 Cost Basis Distribution: Glassnode
The two signals compound. Exchange inflows show the willingness to sell. The cost basis cluster shows where the selling will hit. For the cup and handle to resolve bullish, XRP price has to absorb both layers of supply.
Key XRP Price Levels to Watch
The first hurdle is $1.44, the 0.236 Fibonacci level. A daily close above $1.44 takes XRP into the cost basis cluster zone. The next test is $1.48, the 0.382 Fibonacci, where supply pressure intensifies.
The decisive level is $1.53, the 0.618 Fibonacci level and the neckline of the cup pattern. The alignment matters. When a major Fibonacci level confluences with a structural neckline, the breakout carries higher probability of follow-through. A daily close above $1.53 confirms the cup and handle, beats the 1.16 billion XRP sell wall, and projects the move toward $1.77 and even higher.
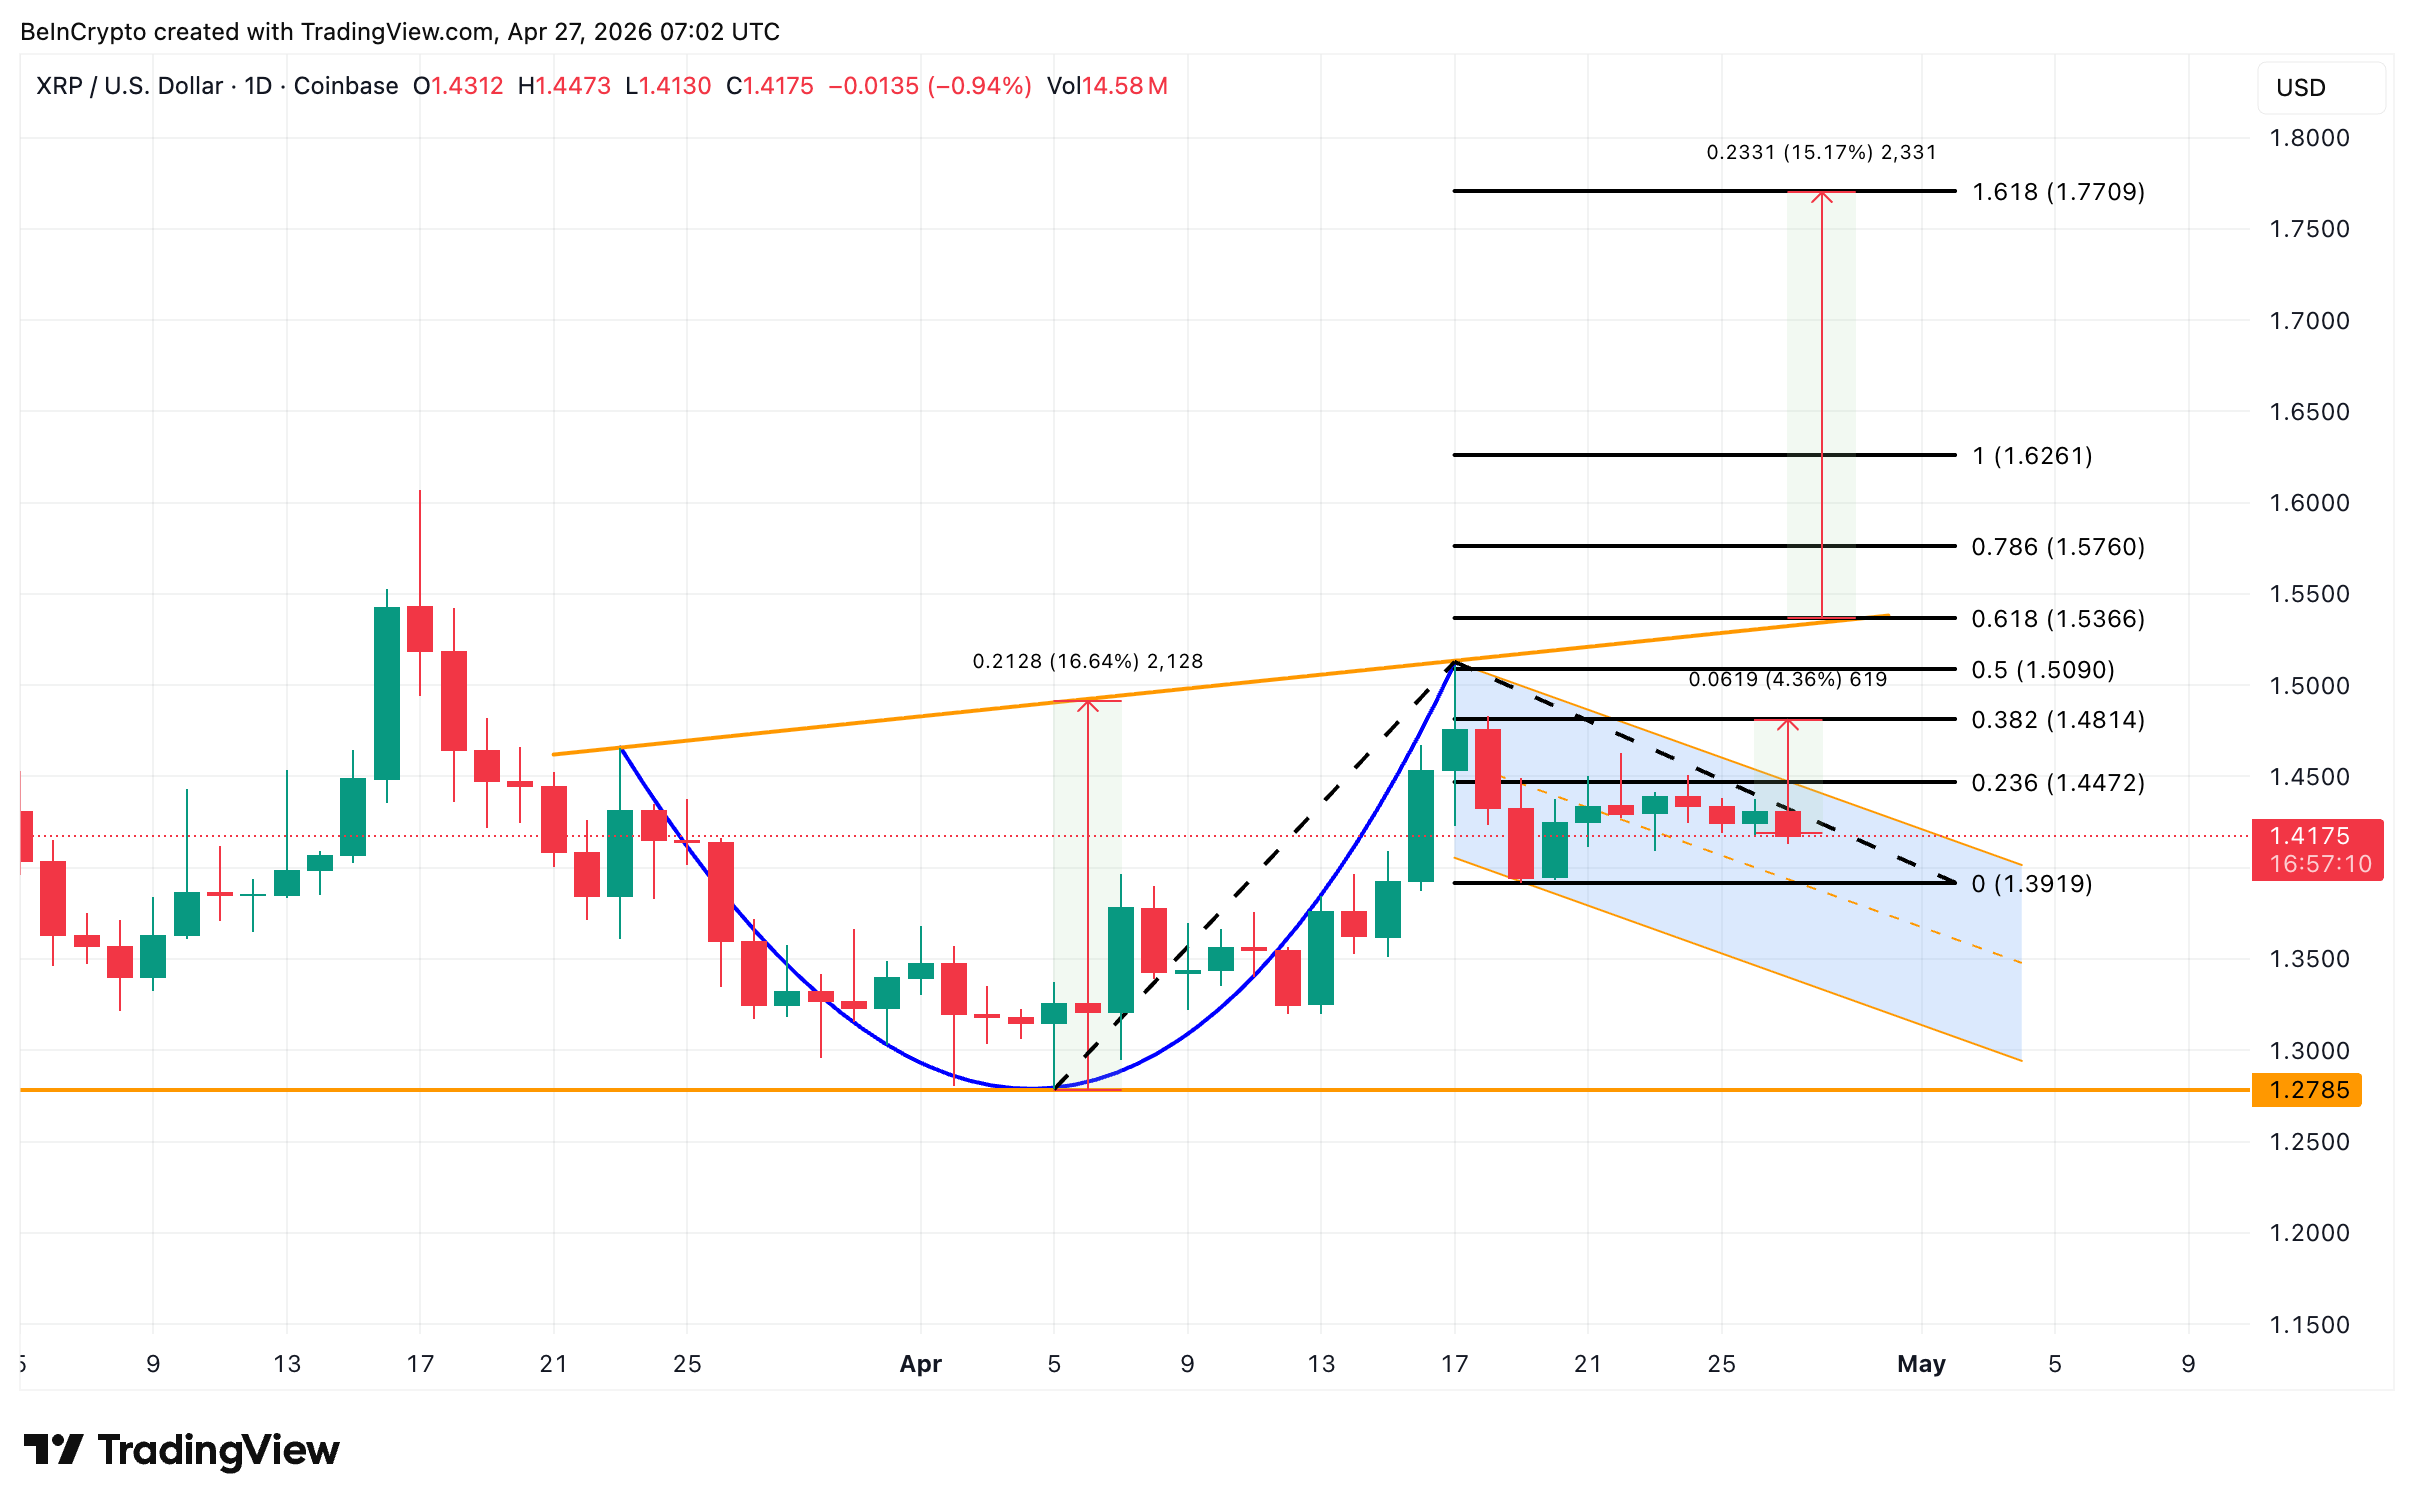 XRP Price Analysis: TradingView
The bear case starts below $1.39. A break below $1.39 weakens the structure and exposes $1.35 lower levels. The pattern fully invalidates on a loss of $1.27, the cup low. For now, a move beyond the $1.48-$1.53 zone separates a confirmed 16% breakout from a slow grind back toward the cup low.
The post XRP Price Targets 16% Breakout but Faces Two On-Chain Warnings appeared first on BeInCrypto.


 English (US) ·