
 1 month ago
32
1 month ago
32

Alphabet stock faces mounting technical pressure after GOOGL closed at $337.39 on June 26. Price sits below all key short-term moving averages. Daily momentum indicators push toward oversold territory. Sellers remain in control while a technical bounce remains unconfirmed.
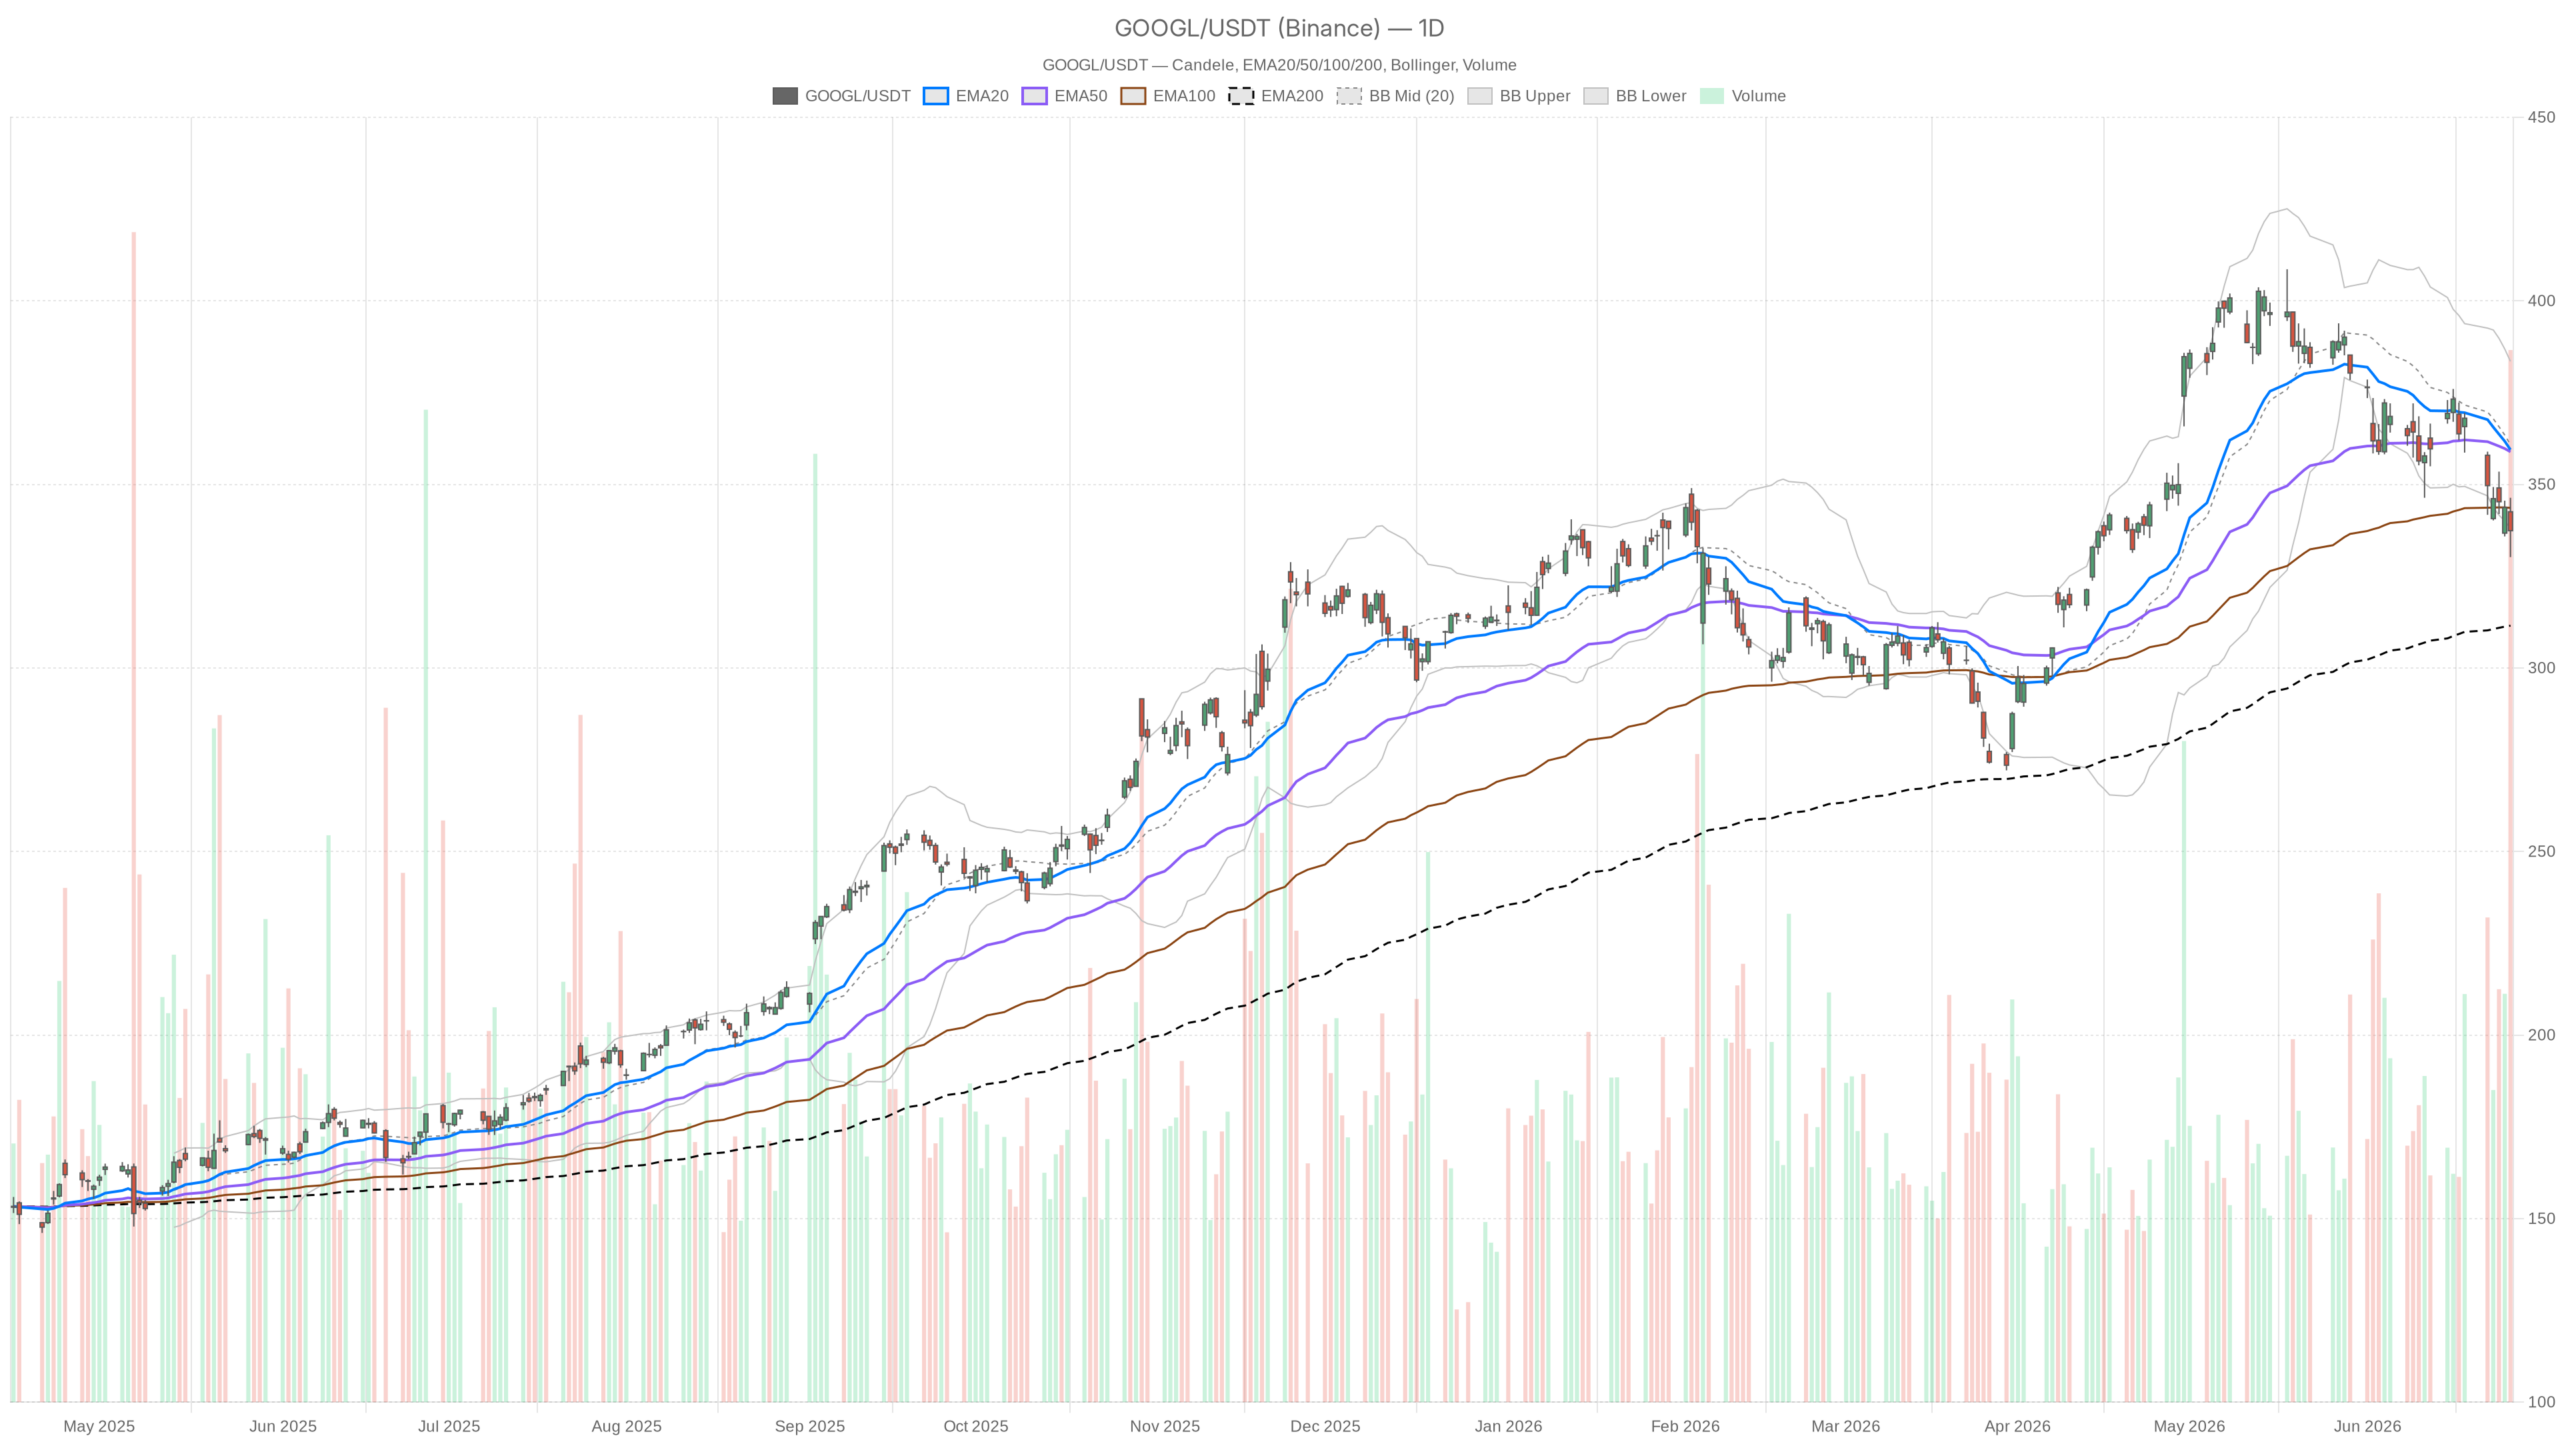 GOOGL — daily chart with candlesticks, EMA20/EMA50 and volume.
Key takeaways
- GOOGL closed at $337.39 on June 26, down roughly 11.6% over the past 30 days.
- The daily RSI at 33.27 approaches oversold territory without yet triggering a confirmed reversal signal.
- Both the 20-day EMA ($359.44) and 50-day EMA ($358.88) sit well above current price, forming a strong resistance ceiling.
- Alphabet joins the Dow Jones Industrial Average on June 29, creating structural demand from index-tracking funds.
- Jefferies maintains a Buy rating with a $445 price target, implying over 30% upside from current levels.
The broader backdrop adds complexity to Alphabet stock’s technical picture. Alphabet’s inclusion in the Dow Jones Industrial Average, effective June 29, marks a historic milestone. Meanwhile, Jefferies reiterated a Buy rating with a $445 price target just days ago, citing cloud computing leadership. Yet GOOGL has shed roughly 11.6% over the past thirty days. Sentiment and price action are, for now, telling different stories.
Daily Chart: Alphabet Stock Under Bearish Pressure
The daily chart confirms Alphabet stock is locked in a bearish structure with the RSI approaching oversold at 33.27. The MACD shows widening negative momentum that has not yet exhausted itself on this timeframe.
On the daily timeframe, the price structure is unambiguously weak. GOOGL trades at $337.39 while the 20-day EMA sits at $359.44 and the 50-day EMA at $358.88. Both moving averages cluster tightly above current price. They form a resistance ceiling that GOOGL must reclaim before any bullish thesis gains traction. The 200-day EMA at $311.52 remains the only major dynamic support below current price.
The daily RSI at 33.27 approaches oversold territory without triggering a confirmed reversal. That reading reflects sustained selling pressure rather than a one-day flush. The MACD paints an even grimmer picture. The MACD line at -7.35 sits well below its signal line at -4.11, producing a negative histogram of -3.24. The divergence between line and signal is widening, not contracting. This signals that downside momentum has not yet exhausted itself.
Bollinger Band positioning adds another layer of context. The lower band sits at $338.12, nearly flush with Thursday’s close. Price hugging or breaking below the lower band typically signals that volatility has expanded to the downside. The daily ATR of $12.69 confirms this. Alphabet is moving roughly $13 per session, which is considerable. Traders need to account for that range when sizing any position.
The daily pivot point sits at $337.98, essentially in line with current price. The nearest pivot support is at $329.61. Meanwhile, resistance at $345.77 must be cleared to suggest any meaningful near-term recovery. The daily regime is tagged as neutral by the system. However, the weight of evidence leans distinctly bearish. Price sits below all short-term EMAs, MACD momentum is negative, and the RSI approaches oversold territory.
Hourly Chart: Bearish Regime Confirms the Weakness
The 1-hour timeframe reinforces Alphabet stock’s bearish outlook. Price sits below all major EMAs and the RSI mirrors the daily reading at 33.44. Every major EMA on the hourly chart sits above price, forming a stacked bearish alignment.
The 1-hour chart confirms the daily weakness without adding any meaningful bullish counterpoint. GOOGL closed the last 1H bar at $336.10, below both the 20H EMA ($343.31) and the 50H EMA ($349.46). The 200H EMA at $363.44 towers further above. This reinforces just how extended the selling has been relative to recent averages.
However, there is one faint signal worth noting. The 1H MACD histogram printed at +0.11, a fractional positive reading despite the MACD line remaining negative at -3.02. This minor divergence suggests that very short-term selling pressure may be easing slightly at the hourly level. It is far too early to call this a reversal. Still, it is the one data point that prevents the hourly picture from being entirely one-directional.
The 1H RSI at 33.44 mirrors the daily reading almost exactly. Both timeframes sit in comparable oversold proximity. This raises the probability of a technical relief bounce. However, such a move would likely be a dead-cat-style recovery toward resistance, not a trend reversal. The hourly Bollinger lower band at $336.20 is right where price trades. This position often precedes short-term stabilization or a snap back toward the midpoint around $343.
15-Minute Chart: Short-Term Momentum Confirms Weakness
The 15-minute chart shows Alphabet stock’s short-term momentum remains firmly bearish. The RSI at 32.10 is the most oversold reading across all three measured timeframes. Any entry targeting a bounce is not yet validated.
At the 15-minute level, the picture is straightforwardly bearish. Price closed the last bar at $336.10, below all three EMAs. The 20m sits at $341.37, the 50m at $342.36, and the 200m at $349.65. The 15m MACD histogram has turned negative again at -0.33. This follows what appears to have been a brief attempt at stabilization. At the same time, the RSI at 32.10 is the most oversold reading across all three timeframes.
For execution purposes, this confirms that any entry targeting a bounce is not yet validated by short-term momentum. The 15-minute chart would need to see a base form before any long entry. Ideally, this would include RSI divergence and a MACD histogram flip. Only then could a position be timed with reasonable confidence. For now, the 15m chart serves as a cautionary signal against premature entries.
Bullish Scenario: What Alphabet Stock Needs to Recover
For Alphabet stock to stage a meaningful recovery, GOOGL must first reclaim the $345.77 daily R1 pivot. A close above the Bollinger lower band midpoint near $360.81 would signal stronger momentum. The 200-day EMA at $311.52 must remain untested for the bull thesis to stay intact.
The bull case for GOOGL is not structurally broken. It is simply deferred. Alphabet’s addition to the Dow Jones Industrial Average is a genuine catalyst with real institutional implications. Index funds tracking the DJIA will now need to hold GOOGL, creating structural demand. Jefferies’ $445 price target implies more than 30% upside from current levels. Hedge fund positioning in the stock as a cloud computing leader has also remained resilient despite the pullback.
Technically, a bullish scenario would require GOOGL to first reclaim the $345.77 daily R1 pivot. Beyond that, a close above the lower Bollinger Band midpoint at $360.81 would signal a more meaningful recovery. A reset of the MACD toward the zero line on the daily chart would also help. Even without a positive cross, this would suggest that bearish momentum is genuinely fading.
Bearish Scenario: What Would Deepen the Decline
Alphabet stock’s bearish case targets $329.61 as the next support level. A break below that pivot would open the path toward the 200-day EMA at $311.52. Given the daily ATR of nearly $13, this move could unfold rapidly.
The bears have clear and well-defined targets. A daily close below the Bollinger lower band at $338.12 would open the door toward the $329.61 pivot support. Price is already trading near this band. Should that level fail, the $311.52 region around the 200-day EMA becomes the next logical destination.
The MACD histogram widening further negative would reinforce the bearish case. Similarly, the RSI breaking below 30 without a bounce would confirm continuation. Notably, the quantum computing narrative and longer-term AI positioning stories carry no immediate technical weight. Positive sentiment from Buffett-adjacent commentary and Motley Fool coverage does not change the technical reality. Price remains below every major moving average across all measured timeframes.
Closing View: Alphabet Stock — Oversold but Not Yet Safe
Alphabet stock trades at a precarious technical juncture. The daily and hourly charts are aligned bearishly with RSI approaching oversold on both. This combination historically precedes volatility events in either direction. Aligned bearish signals demand patience from buyers.
The Dow Jones inclusion is a structural positive. Jefferies’ maintained Buy rating adds institutional credibility to a recovery thesis. In contrast, the price action itself argues for patience. The MACD readings and the EMA stack reinforce this. Both suggest waiting before committing capital to the long side.
Volatility is elevated, daily ranges are wide, and the market is actively repricing Alphabet at these levels. Until GOOGL reclaims at least the $345–$360 zone and momentum indicators begin to reset, the risk of further downside remains real. This is a stock to watch closely. It is not one to chase blindly in either direction.
FAQ
Is Alphabet stock currently in a bearish trend?
Yes, Alphabet stock is in a clearly bearish structure on the daily chart. GOOGL trades below all short- and medium-term EMAs. The MACD shows widening negative momentum, and the RSI at 33.27 approaches oversold territory without a confirmed reversal signal.
What are the key support levels for GOOGL right now?
The nearest support sits at $329.61, which is the daily pivot support level. Below that, the 200-day EMA at $311.52 acts as the next major floor. The Bollinger lower band at $338.12 is already being tested at current prices.
Could Alphabet’s Dow Jones inclusion help the stock recover?
Yes, Alphabet’s addition to the DJIA on June 29 is a structural catalyst. Index funds tracking the Dow will need to accumulate GOOGL shares, potentially creating buying pressure. However, this fundamental tailwind has not yet translated into improved technicals on any timeframe.
What needs to happen for Alphabet stock to turn bullish?
GOOGL must first reclaim the $345.77 daily R1 pivot. A close above the Bollinger Band midpoint near $360.81 would signal a more meaningful recovery. Additionally, the MACD needs to reset toward the zero line, and the 200-day EMA at $311.52 must remain untested.
Disclaimer: This article is for informational purposes only and does not constitute financial advice, an investment recommendation, or a solicitation to buy or sell any financial instrument or cryptocurrency. The analysis provided is not indicative of future results. Investing in crypto assets and financial markets carries a high risk of capital loss. Always do your own research (DYOR) and consult a qualified financial advisor before making any decision.
Article produced with the assistance of artificial intelligence and reviewed by the editorial team.


 English (US) ·