
 1 month ago
20
1 month ago
20
The AMC stock offering — a $200 million registered direct sale of 95.25 million shares — sent the stock crashing 19% on Tuesday, its worst single-day drop in nearly three years. It reignites a familiar conflict: balance-sheet relief versus painful shareholder dilution.
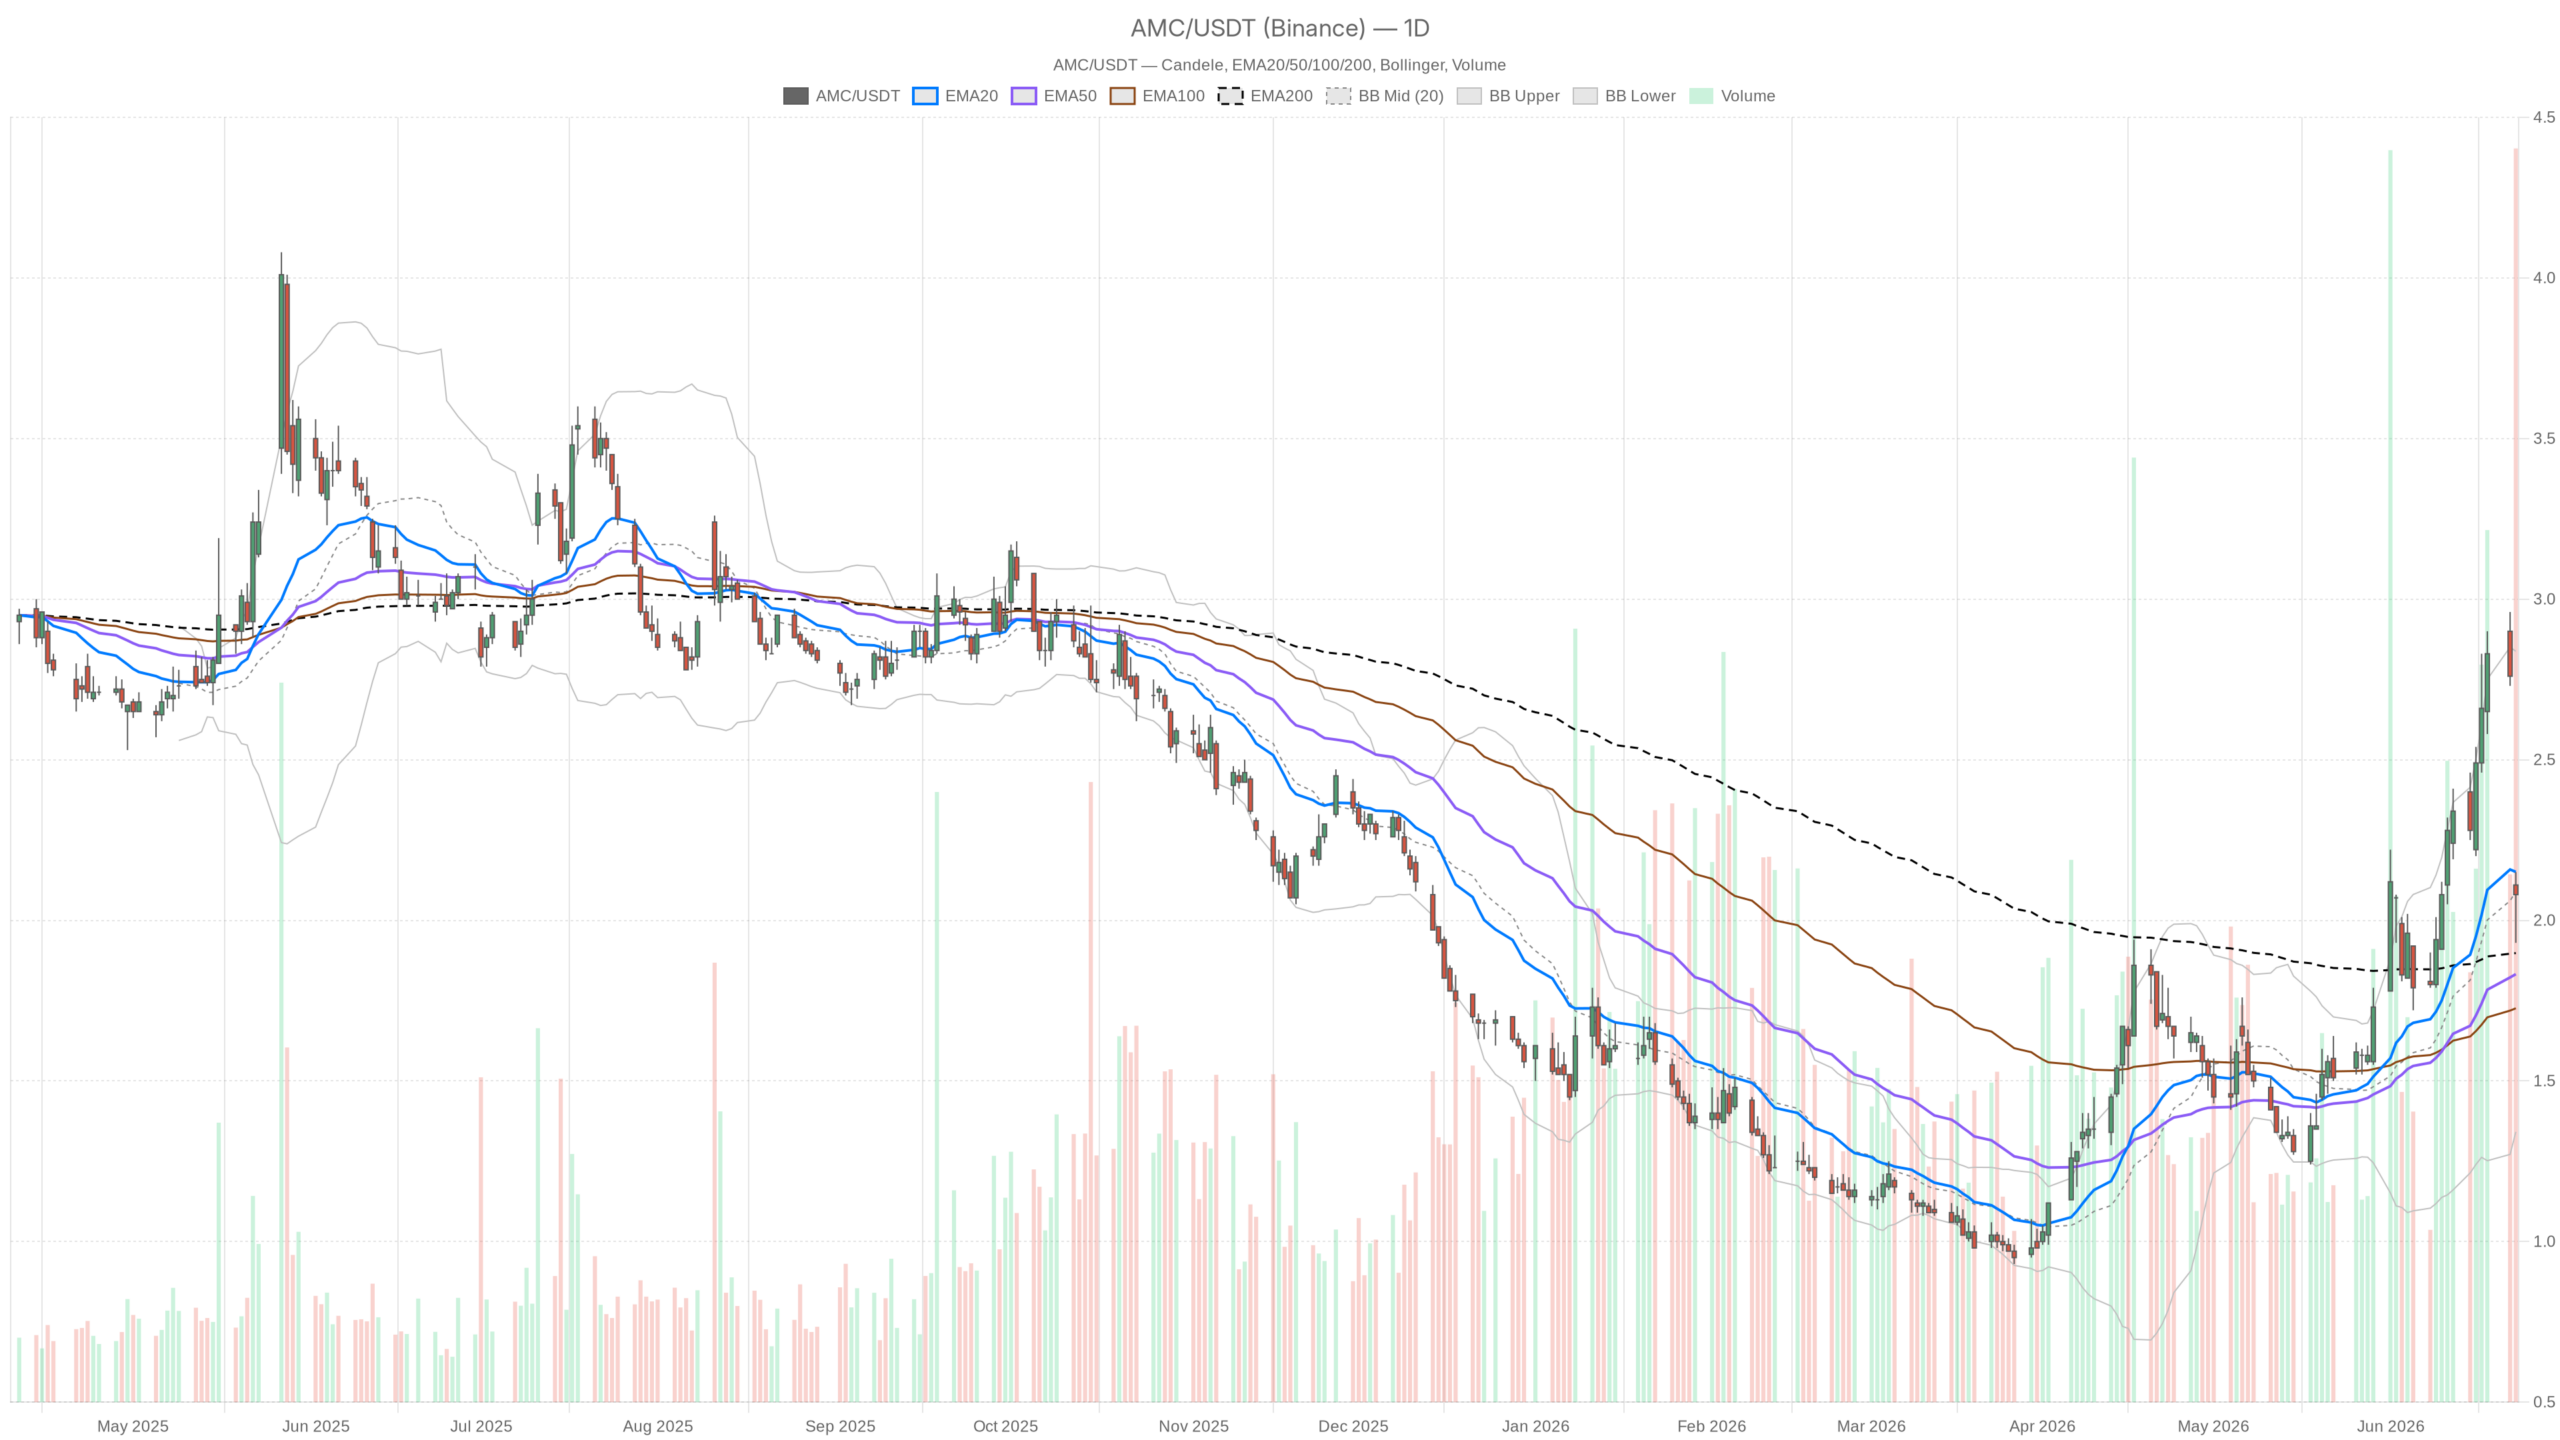 AMC — daily chart with candlesticks, EMA20/EMA50 and volume.
Key takeaways
- AMC announced a 95.25 million share offering to raise approximately $200 million
- Shares plunged 19% on Tuesday — the worst single-day decline in nearly three years
- Daily EMAs remain intact with price above the 50-day ($1.83) and 200-day ($1.90) averages
- Hourly and 15-minute charts show active bearish momentum with broken short-term EMAs
- Critical support sits at $2.04–$2.05 (hourly EMA200 and daily S1 pivot)
- A breakdown below $1.83 would neutralize the entire medium-term EMA structure
Daily Chart: A Fragile Floor After the AMC Stock Offering
The daily chart shows a market absorbing dilutive shock without yet breaking its medium-term structure. AMC closed at $2.08 on June 23, sitting just below its 20-day EMA at $2.15. The close near the Bollinger Band midpoint of $2.09 masks a volatile session. The day’s range told a sharper story — a high of $2.15 tested resistance before selling pressure dragged price to an intraday low of $1.93. This post-crash equilibrium offers more caution than comfort.
EMA Structure Holds — But Only Barely
Price remains above both the 50-day EMA at $1.83 and the 200-day EMA at $1.90. That positioning technically keeps the medium-term trend intact. Yet the margin is uncomfortably thin. A sustained move below $1.93 would threaten structural support. Both long-term averages would then become downside targets rather than safety nets.
Momentum Offers No Directional Conviction
Daily momentum reads neutral at best. The RSI sits at 50.89, offering no directional edge. The MACD line at 0.25 edges above its signal at 0.22, with a histogram of just 0.03. This negligible positive divergence carries little weight against the scale of the day’s decline. Meanwhile, Bollinger Bands remain wide — upper band at $2.84, lower at $1.34 — confirming elevated realized volatility. The ATR of $0.29 on a $2.08 stock implies roughly 14% daily range potential, an uncomfortable environment for most risk-managed positions.
Hourly Chart Breakdown Strengthens the Bearish Case
The hourly chart confirms active bearish momentum that is not yet bottoming. Short-term EMAs are broken, and downside pressure dominates the near-term outlook. The 1H RSI has dropped to 30.34, approaching oversold territory. The MACD on the hourly is deeply negative — line at -0.14 against a signal of -0.05, with a histogram of -0.09. Price has broken well below the 1H EMA20 at $2.41 and EMA50 at $2.42. These now sit far above current levels as overhead resistance. The only short-term technical support on this timeframe comes from the EMA200 at $2.04, which aligns closely with the 1H pivot support at $2.05.
Intraday Regime: Full Bearish Stack on the 15-Minute Chart
The 15-minute chart shows a complete bearish stack with no confirmed reversal signal. Price trades beneath EMA20 at $2.14, EMA50 at $2.33, and EMA200 at $2.40. The 15m RSI at 35.7 reflects oversold-adjacent conditions without a confirmed reversal. Notably, the MACD histogram on the 15m has turned slightly positive at 0.03. This suggests minor near-term stabilization. It is not a trend reversal. At best, it offers an execution-context detail — useful for timing short entries or watching for a brief relief bounce, nothing more.
The Dilution Playbook: What the AMC Stock Offering Means for Shareholders
The AMC stock offering follows a well-established pattern of dilutive equity raises used to service debt. AMC issued 95 million shares when the stock was already under pressure, raising capital primarily to manage its debt load. For retail investors who followed the meme trade in 2021, this is a recurring wound. The CEO has now used dilutive equity raises multiple times as a financing mechanism. Each time, the playbook is the same: short-term share price pain absorbed by existing holders in exchange for balance sheet relief. Some retail participants point to debt paydown as a potential long-term positive. That argument has merit in isolation. But the track record of execution gives the market little reason to price in that optimism immediately.
Bullish and Bearish Scenarios Following the Offering
The technical picture after the AMC stock offering presents two clear scenarios. The bullish case requires holding key support. The bearish case, however, aligns more naturally with the current momentum structure.
Bullish Case: Holding the $1.83–$1.90 Zone
The bullish thesis rests on the $1.83–$1.90 zone holding as a floor. If AMC stabilizes above the 50-day and 200-day EMAs and the hourly RSI begins recovering from near-oversold levels, a technical rebound toward $2.15–$2.18 becomes plausible. That zone aligns with the daily R1 pivot and the 20-day EMA. Debt reduction improving the balance sheet narrative could attract value-oriented buyers over the medium term. This scenario requires patience and confirmation.
Bearish Case: Path of Least Resistance
The bearish case is the path of least resistance right now. The hourly structure is broken. Momentum is negative across both the 1H and 15m timeframes. A failure to hold the $2.04–$2.05 support zone would open the door to $1.93 and potentially below. A breach of $1.83 would neutralize the medium-term EMA structure entirely. Price would then enter technically uncharted recent territory.
FAQ
Why did AMC stock drop 19% on Tuesday?
AMC announced a registered direct offering of 95.25 million shares to raise approximately $200 million. The dilutive share issuance triggered a sharp selloff as the market repriced the stock to reflect the increased share count and near-term dilution pressure.
Where is the most important support level for AMC stock right now?
The critical support zone sits at $2.04–$2.05, where the hourly EMA200 aligns with the daily S1 pivot. Below that, $1.93 marks the recent intraday low. A breakdown below $1.83 — the 50-day EMA — would neutralize the medium-term EMA structure entirely.
Is the AMC stock offering a one-time event or part of a recurring pattern?
This is part of a recurring pattern. AMC’s CEO has used dilutive equity raises multiple times since the 2021 meme stock era as a financing mechanism. Each offering has followed the same playbook: short-term share price pain in exchange for balance sheet relief through debt paydown.
Disclaimer: This article is for informational purposes only and does not constitute financial advice, an investment recommendation, or a solicitation to buy or sell any financial instrument or cryptocurrency. The analysis provided is not indicative of future results. Investing in crypto assets and financial markets carries a high risk of capital loss. Always do your own research (DYOR) and consult a qualified financial advisor before making any decision.
Article produced with the assistance of artificial intelligence and reviewed by the editorial team.


 English (US) ·