
 7 months ago
87
7 months ago
87
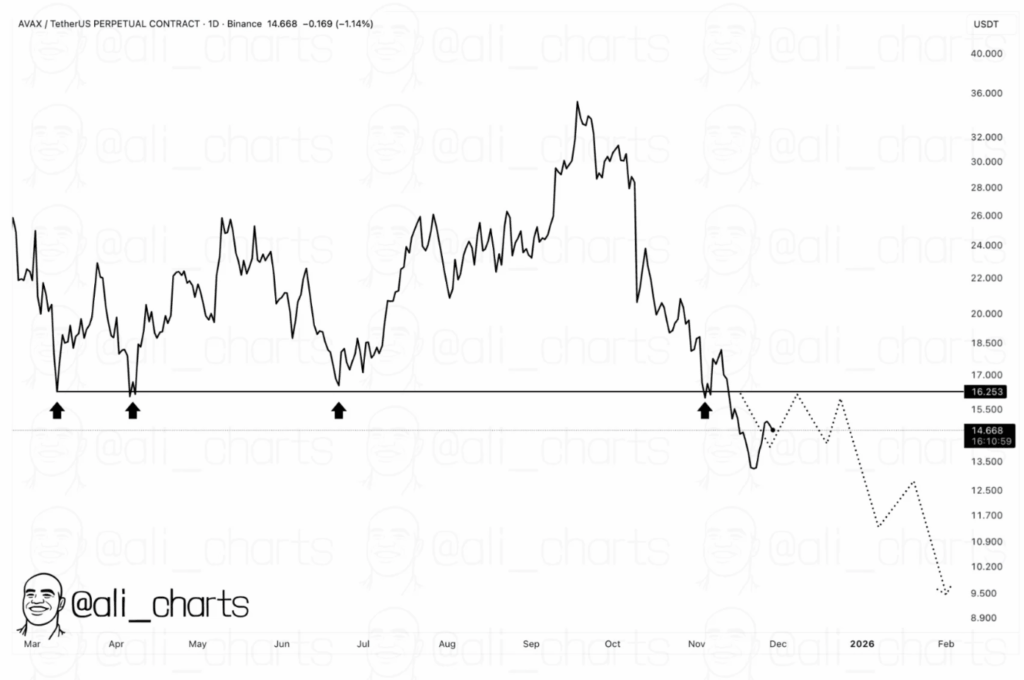
- AVAX trades near crucial support that could trigger a drop to $9 or a future rally toward $80.
- Analysts highlight a falling triangle pattern hinting at major long-term volatility.
- Holding current levels could open a breakout toward the upper channel resistance.
Avalanche (AVAX) is sitting at one of those tense points on the chart where things could swing wildly in either direction. Trading near $15, the coin is pressing against a critical support level that might decide whether it sinks toward the $9 zone… or flips into a multi-month bullish reversal that eventually pushes it back toward $80. Right now, AVAX is priced around $14.14, with about $474 million in daily trading volume and a market cap just over $6 billion. Market dominance is low at 0.20%, sliding nearly 4% in the last 24 hours — a sign the broader market isn’t exactly helping.
Analysts Warn of Key Breakout Test
Analysts watching AVAX closely say it’s testing a breakout region that carries a lot of weight. If price slips beneath this zone, the chart opens up room to drop into the green support area — and possibly even the lower blue band beneath it. Both regions represent global targets where volatility tends to compress before bigger moves. Simply put, a break below this cluster would lean bearish for the short term.
But the upside scenario isn’t dead. If AVAX holds these levels, there’s room for a rebound toward the purple region inside the falling channel — a zone that could trigger a larger breakout. That’s the part bulls are watching carefully because it’s one of the few structural paths that lets AVAX reclaim momentum.
AVAX Retesting Key Levels Before a Larger Decision
Analyst Ali Marteniz highlighted the same thing: AVAX is retesting its previous breakout zone. He suggests the price action here could shape a continuation move, potentially dipping toward $9 before forming a new base — which oddly enough could end up being bullish long-term. Pullbacks into strong zones have often marked trend reversals for Avalanche, especially during heavy market uncertainty.
Falling Triangle Pattern Suggests Long-Term Compression
Looking further out, the larger technical picture shows AVAX moving within a falling triangle pattern. This formation usually signals a major breakout on the horizon — though the direction isn’t guaranteed. The forecast suggests AVAX might even touch the $4.40 region sometime in 2026 before reversing sharply toward $80. It’s a pretty wide range, yes, but falling triangles often create these kinds of high-volatility setups before the market decides on a long-term direction.
AVAX Still in Price Discovery Mode
For now, Avalanche is still wandering through a price discovery phase where every support and resistance tap matters. The next few moves will decide whether AVAX keeps sliding deeper into the structure… or snaps upward and starts rebuilding a broader bullish trend. Here is where the market might reveal its hand sooner than expected.
The post Avalanche Hovers Near Make-or-Break Support as Traders Brace for a Big Move first appeared on BlockNews.


 English (US) ·