
 3 hours ago
6
3 hours ago
6

BA Boeing stock approaches a critical inflection point at $211.50 as of July 27. Trading below every major daily moving average, it remains locked in a confirmed bearish regime. With Q2 earnings imminent and CEO Kelly Ortberg speaking Tuesday, the next 48 hours could define Boeing’s directional bias.
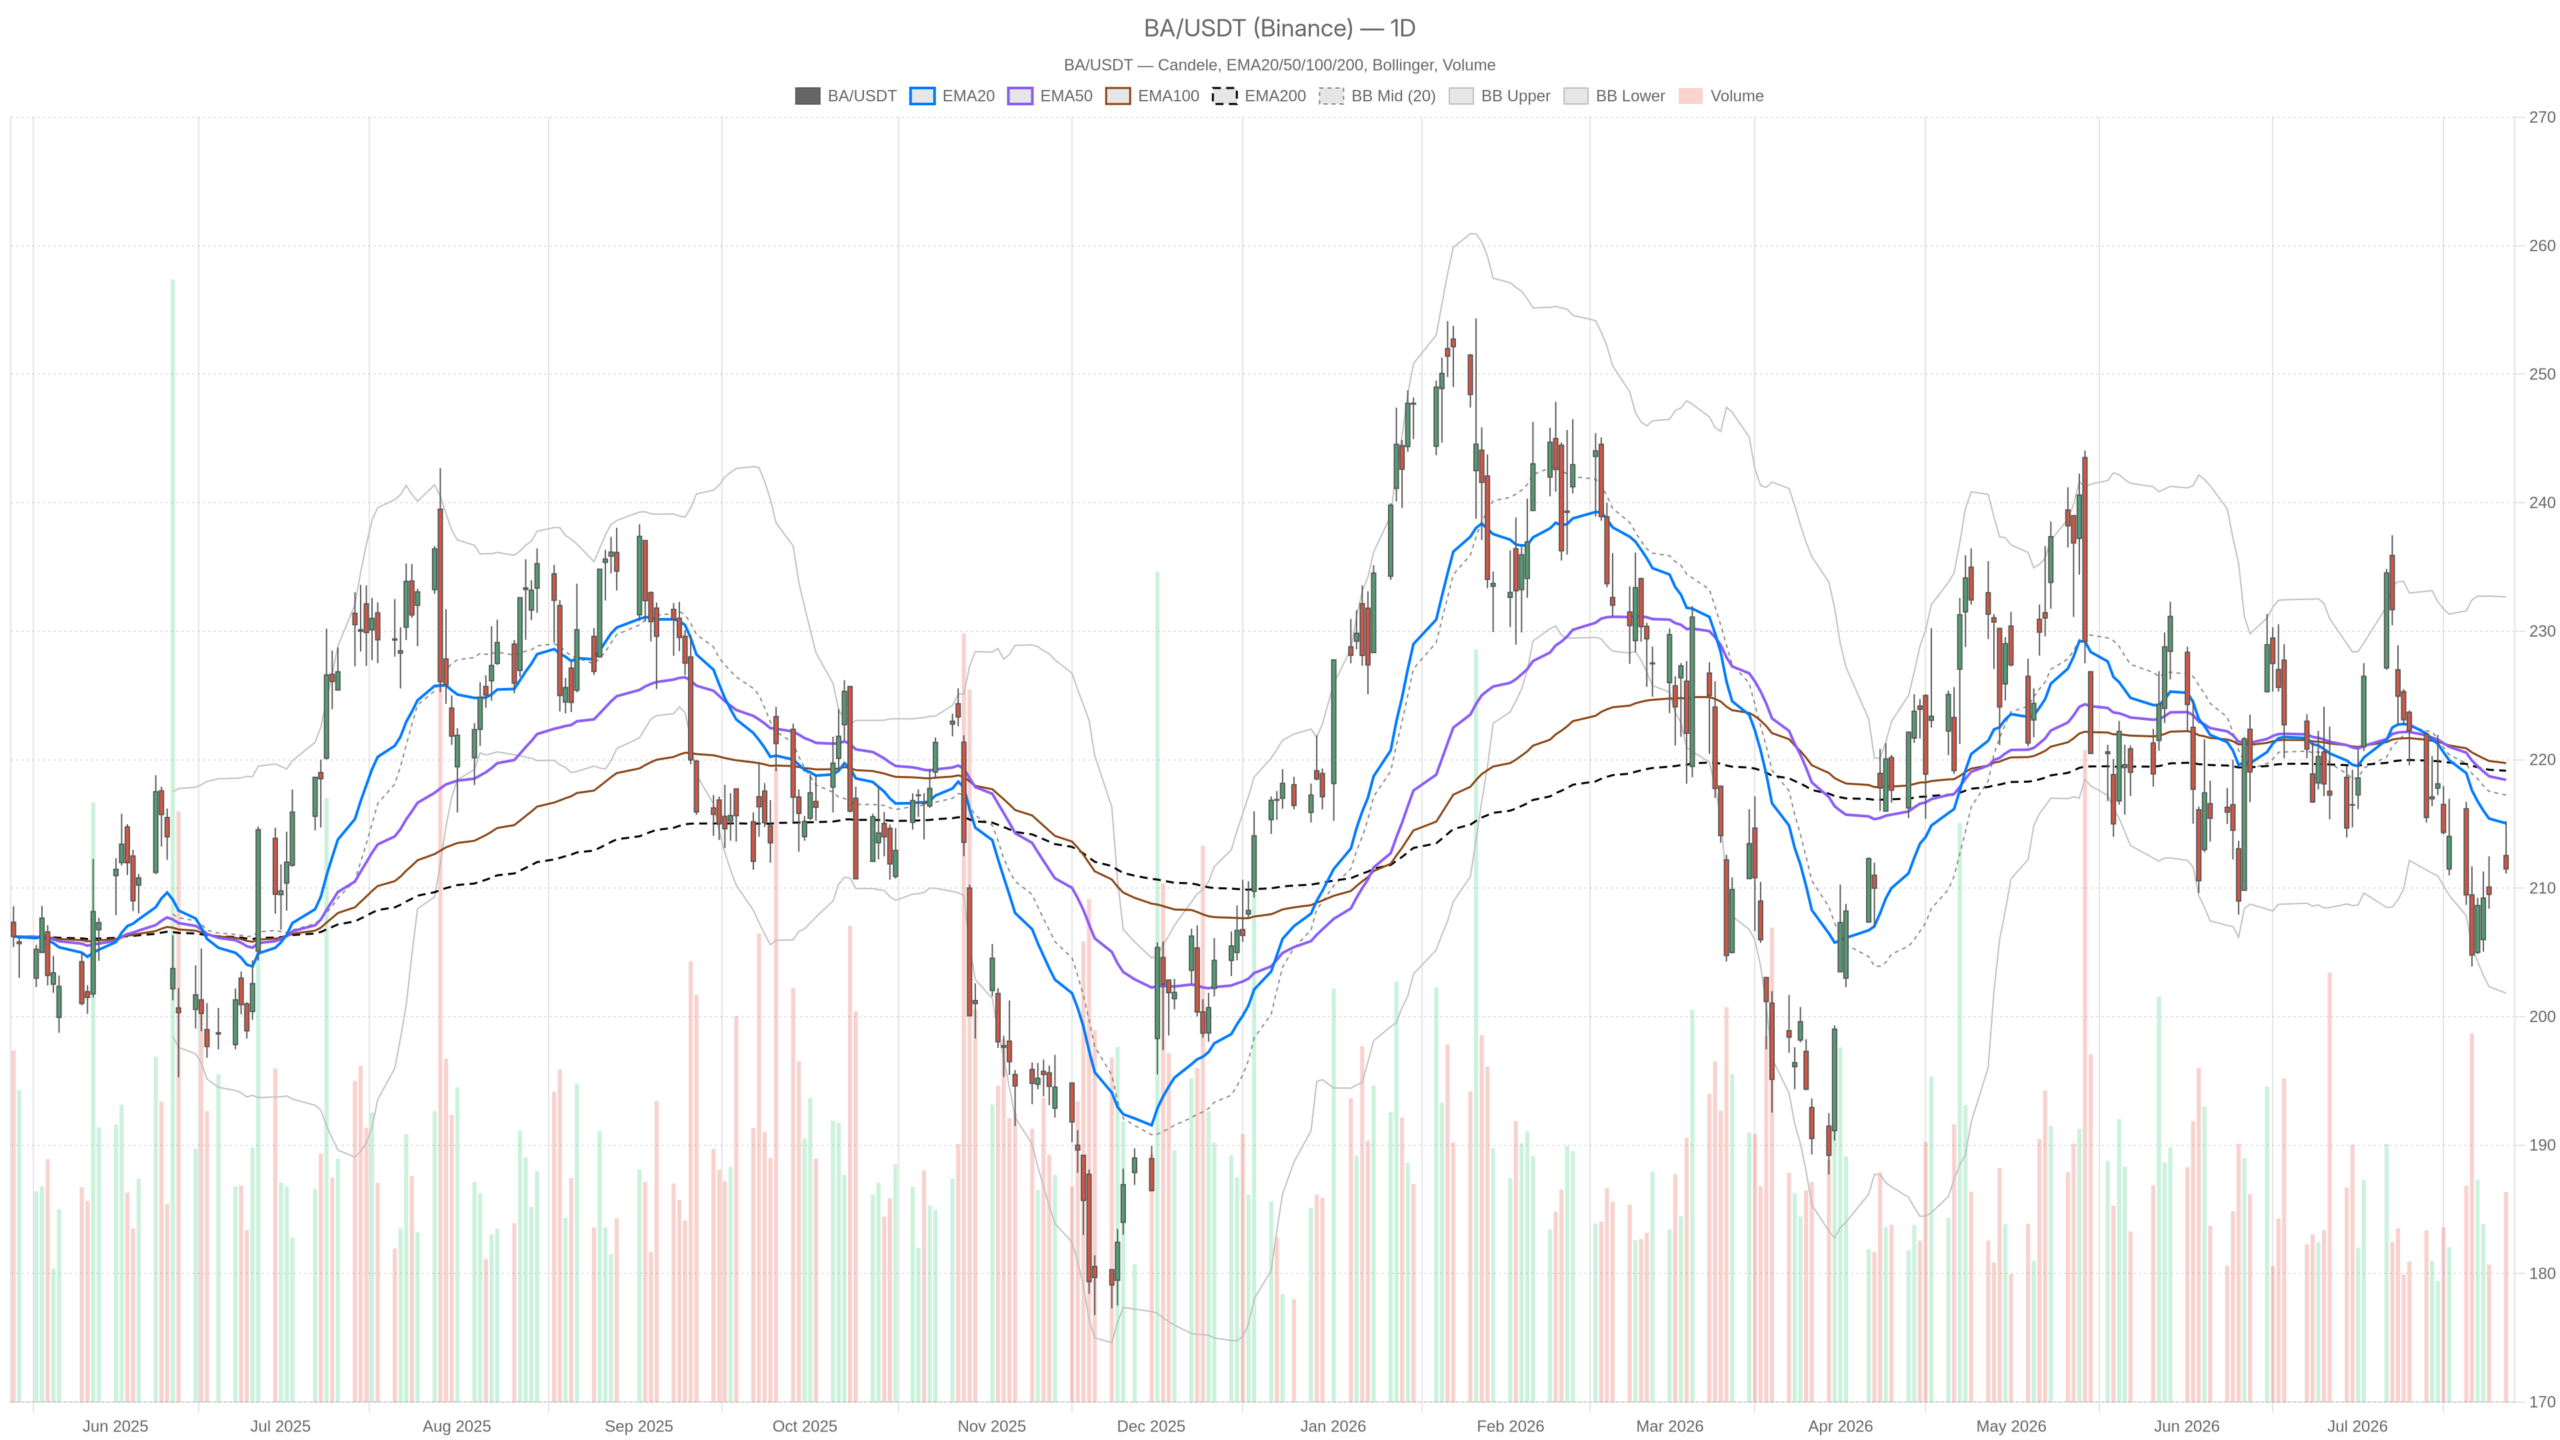 BA — daily chart with candlesticks, EMA20/EMA50 and volume.
Key takeaways
- BA Boeing stock closed at $211.50 on July 27, below the EMA20 ($215.05), EMA50 ($218.43), and EMA200 ($219.14).
- Daily MACD sits at -3.32 with a negative histogram of -0.91, confirming deteriorating momentum with no reversal signal.
- Daily RSI at 43.98 leaves room for further downside before oversold conditions emerge.
- The Bollinger lower band at $201.83 and daily S1 at $210.03 are the key downside levels to watch.
- Q2 earnings and CEO Kelly Ortberg’s Tuesday comments on 737 MAX production represent the dominant near-term catalysts.
Daily Timeframe: Boeing Stock Locked in a Bearish Regime
Boeing’s daily chart confirms an unambiguous bearish regime. Price sits below all three major moving averages with deteriorating momentum and no meaningful reversal signals.
Momentum and Support Levels Confirm the Structure
Notably, Boeing closed at $211.50, beneath the EMA20 at $215.05, the EMA50 at $218.43, and the EMA200 at $219.14. That stacked bearish alignment across all three major moving averages reflects sustained selling pressure. It has been building for weeks, not in a single session.
Momentum indicators reinforce this view. The MACD line sits at -3.32, well below the signal at -2.41. A negative histogram of -0.91 confirms momentum is not just negative — it is still deteriorating. There is no histogram compression or crossover attempt visible here.
Meanwhile, the RSI at 43.98 is notable for what it is not. It is not yet oversold. There is still room to the downside before buyers are forced in by exhaustion alone. This RSI level reflects a market weakening steadily rather than collapsing sharply.
At $217.25, the Bollinger midline sits well above current price. Boeing trades in the lower half of the band. The lower bound at $201.83 acts as a plausible downside target if pressure accelerates. Daily ATR of 5.64 signals meaningful volatility — particularly relevant given the earnings event ahead.
Daily pivot analysis places the pivot point at $212.62, with S1 at $210.03 and R1 at $214.10. Boeing closed just below the pivot, giving the bears a marginal edge. A close below S1 at $210.03 would add further confirmation to the bearish structure.
Hourly View: Boeing Stabilizes, But No Reversal Yet
The hourly chart offers temporary stabilization but no genuine reversal. Short-term indicators have improved modestly while the broader bearish structure remains fully intact.
Short-Term Improvement Meets Structural Resistance
On the 1H chart, the picture is more nuanced. It genuinely complicates the daily thesis at the margin. The hourly regime is classified as neutral, not bearish. Price closed at $211.50, sitting above both the EMA20 ($210.99) and EMA50 ($211.60). That marks a short-term technical improvement.
At the same time, the hourly MACD line at 0.68 is above its signal at 0.45. A positive histogram of 0.23 signals a mild but real short-term momentum shift. The RSI at 52.83 is mildly constructive. However, it remains far from a strong bullish signal.
Still, the EMA200 on the 1H chart remains far overhead at $216.85. The hourly rally has not broken any meaningful structural resistance. In context, this hourly stabilization looks more like a pause within a downtrend. It is not yet the beginning of a recovery.
In short, the 1H timeframe weakens but does not invalidate the daily bearish bias. It introduces short-term ambiguity — especially with a high-impact catalyst on the horizon.
15-Minute Context: Indecision Near the Pivot
The 15-minute chart shows a market wrestling with indecision near the pivot. Intraday momentum fades as traders await the earnings catalyst rather than committing to directional positions.
At the execution level, price closed at $211.50, below the EMA20 at $212.31 and the Bollinger midline at $212.36. The MACD histogram turned slightly negative at -0.12. That signals fading short-term momentum after what appeared to be a brief intraday push higher. The RSI at 45.37 leans modestly bearish without conviction.
Notably, the 15m ATR of 1.04 reflects tight intraday conditions. Traders are clearly waiting for the earnings report rather than committing to large directional positions. The 15m pivot sits at $212.16, with S1 at $210.75. That level aligns closely with intraday support. A break below $210.75 in the early session would likely accelerate downside momentum.
Earnings Catalyst: Delivery Momentum and BA Stock in Focus
The dominant near-term variable for BA Boeing stock is fundamentally driven by Q2 earnings. Delivery growth and the 737 MAX production ramp will determine whether the bearish technical structure holds or breaks.
Q2 earnings previews highlight delivery growth, the 737 MAX production ramp, supply chain progress, and order backlog as key metrics. Investors will scrutinize each of these closely. Framing from multiple sources positions this as Boeing’s biggest test yet. The turnaround narrative is attempting to gain steam.
Meanwhile, CEO Kelly Ortberg‘s appearance on Tuesday adds a layer of forward guidance risk. His comments on production targets and supply chain execution could move the stock significantly — in either direction. At the same time, Boeing’s technical positioning heading into the report is defensive. The stock needs positive earnings surprises just to justify a return to its moving average cluster above $215.
Bullish Scenario: What Would Change the Thesis
A credible bullish case exists, but it requires external validation from earnings. Strong Q2 results and upbeat guidance could catalyze a sharp rebound above key resistance.
Specifically, a strong Q2 earnings beat on deliveries and 737 MAX production volumes could catalyze a sharp rebound. Combined with upbeat guidance from Ortberg, that fundamental trigger would carry weight. On the technical side, a daily close above R1 at $214.10 followed by a recapture of the EMA20 at $215.05 would begin to erode the bearish structure.
A further move through the EMA50 at $218.43 would be needed to genuinely shift the daily regime toward neutral. The hourly setup already provides a base for such a move. However, it all depends on the fundamental trigger arriving.
Bearish Scenario: Validating the Existing Trend
Disappointing earnings or cautious commentary would validate every warning embedded in the daily chart. A break below key support opens a clear path toward deeper downside.
On the other hand, a disappointing earnings print would validate the daily chart’s bearish warnings. Cautious management commentary on production timelines would have the same effect. A break below daily S1 at $210.03 would open a path toward the Bollinger lower band at $201.83.
With the MACD still deteriorating and no momentum divergence visible, the bears carry structural momentum. A failed earnings catalyst would likely confirm that the current bearish regime has further to run.
Positioning and Volatility Outlook for Boeing Stock
BA Boeing stock enters its earnings event technically compromised. The bears remain in control, and the hourly stabilization offers only a thin cushion.
Overall, the daily regime is bearish. The moving average stack is hostile, and momentum indicators offer no meaningful hope yet. The hourly chart provides a thin stabilization cushion — nothing more. With daily ATR at 5.64, implied moves post-earnings could easily exceed that range.
Therefore, traders and investors should treat current levels as a high-uncertainty zone. The earnings outcome — not the chart — will dictate the next meaningful directional move. Until clarity emerges, the technical bias remains with the bears.
FAQ
What is the current price of BA Boeing stock?
BA Boeing stock closed at $211.50 on July 27, trading below the EMA20 ($215.05), EMA50 ($218.43), and EMA200 ($219.14) on the daily chart.
What are the key support levels for Boeing stock?
Key support sits at the daily S1 pivot of $210.03. A break below this level would open a path toward the Bollinger lower band at $201.83, the next major downside target.
What could move BA Boeing stock in the near term?
Q2 earnings results, 737 MAX delivery numbers, supply chain progress updates, and CEO Kelly Ortberg’s public comments on Tuesday are the dominant near-term catalysts for BA Boeing stock.
Is Boeing stock in a bearish or bullish trend?
Boeing is in a confirmed bearish regime on the daily chart with deteriorating MACD momentum. The hourly chart shows mild stabilization but no reversal signal.
Disclaimer: This article is for informational purposes only and does not constitute financial advice, an investment recommendation, or a solicitation to buy or sell any financial instrument or cryptocurrency. The analysis provided is not indicative of future results. Investing in crypto assets and financial markets carries a high risk of capital loss. Always do your own research (DYOR) and consult a qualified financial advisor before making any decision.
Article produced with the assistance of artificial intelligence and reviewed by the editorial team.







 English (US) ·