
 2 hours ago
21
2 hours ago
21

Apple Stock (AAPL) is trading in a tight, indecisive band just above $309, pausing after a pullback from its 52-week high. The last session closed at $309.90, ranging between $308.21 and $313.58. Price sits at the intersection of the 20-day and 50-day EMAs, $311.69 and $309.44.
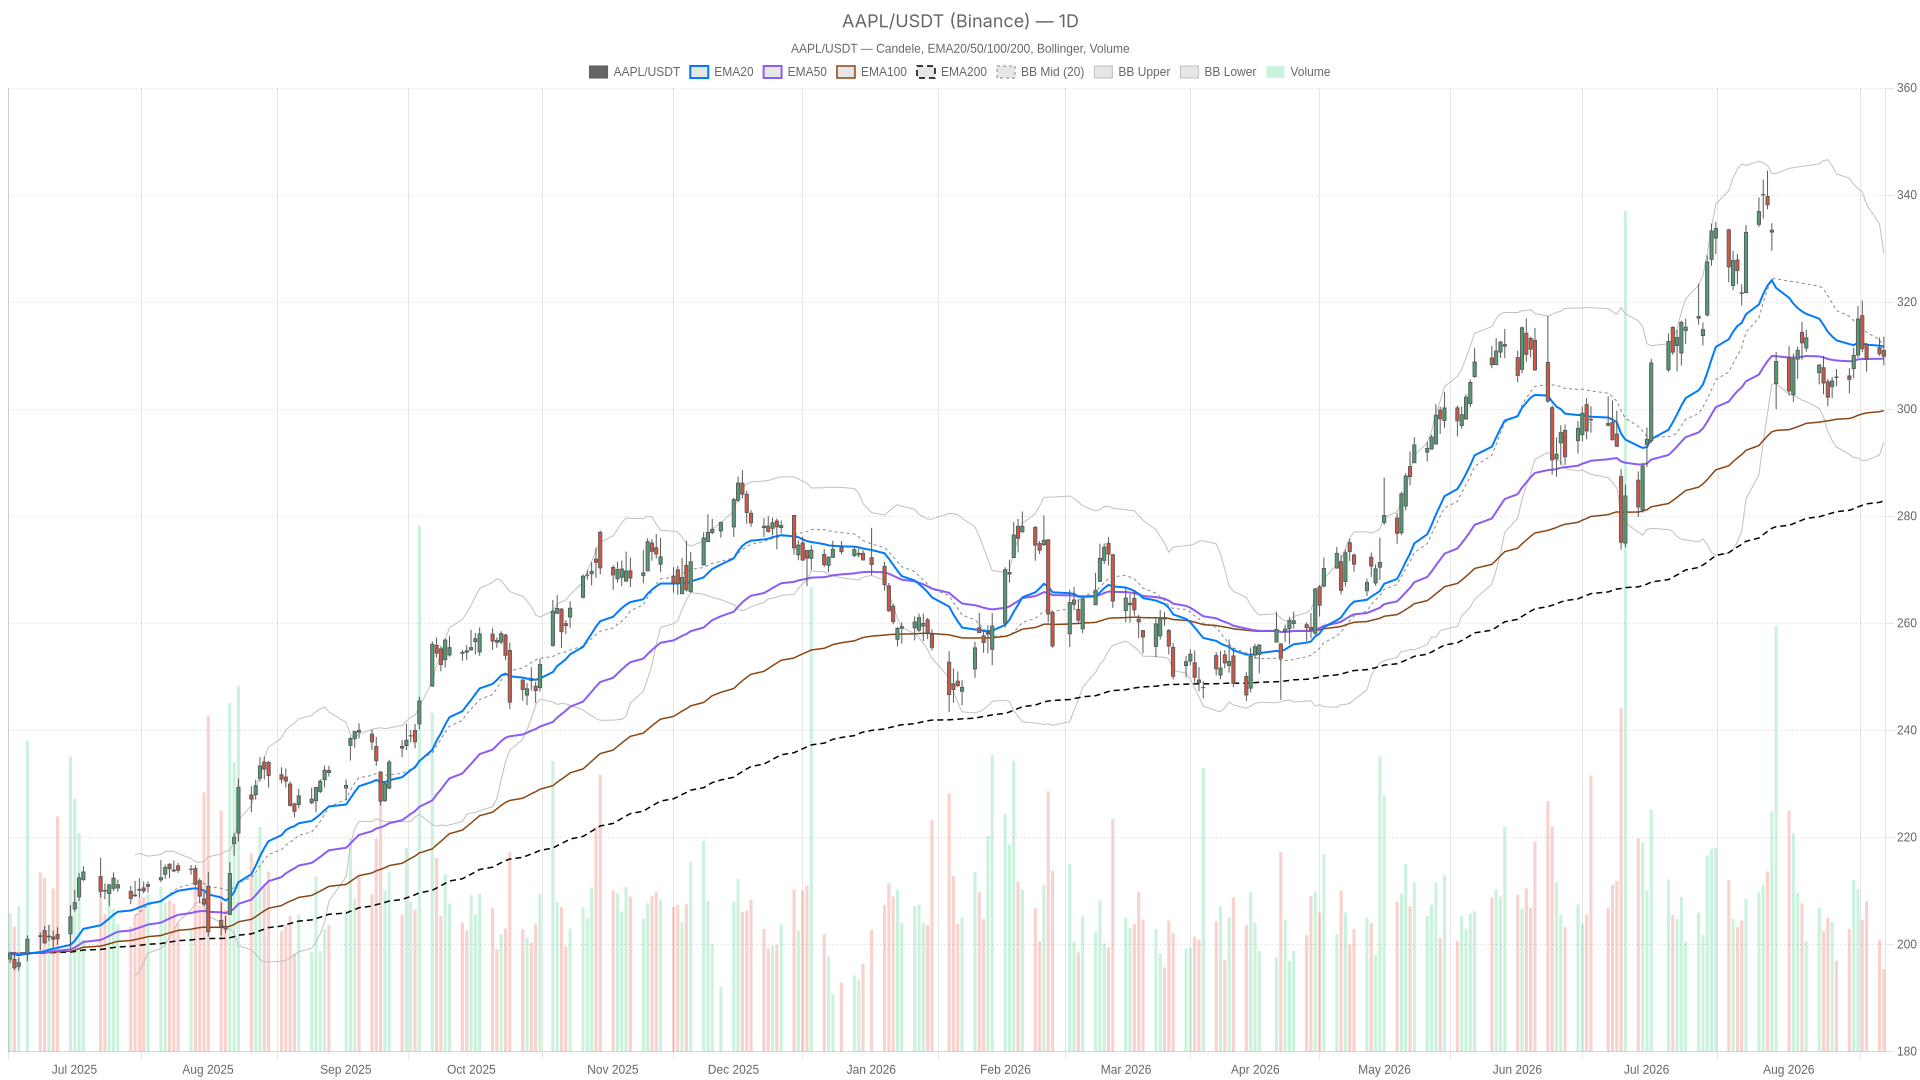 AAPL — daily chart with candlesticks, EMA20/EMA50 and volume.
Key takeaways
- Apple stock closed at $309.90, ranging between $308.21 and $313.58 in a neutral consolidation above $309.
- The 200-day EMA at $282.87 keeps the longer-term uptrend structurally intact.
- Daily RSI14 reads 47.82, while the daily MACD histogram sits at -0.15, signaling fading downside momentum.
- The hourly MACD histogram has widened to -0.21, showing short-term selling pressure that has not exhausted.
- Daily support at $307.55 and resistance at $312.92 frame the near-term battleground.
Apple Stock Daily Chart: Uptrend Intact but Momentum Cooling
The daily chart keeps Apple stock in a longer-term uptrend, but short-term momentum is cooling. The 200-day EMA sits far below current price at $282.87. Therefore, the broader trend that has carried Apple stock higher over the past year remains structurally intact.
Momentum and volatility are neutral
However, the short-term momentum picture is far less convincing. Daily RSI14 reads 47.82, a neutral reading. It shows neither overbought excess nor oversold panic, just a market pausing.
The MACD adds a mildly bearish nuance. With the MACD line at -1.44 against a signal line of -1.29, the histogram sits at -0.15. It remains negative but is not accelerating aggressively. In practice, this points to fading downside momentum rather than a fresh bearish impulse.
Meanwhile, the daily Bollinger Bands show a mid-line at 311.5, an upper band at 329.15 and a lower band at 293.85. Price sitting near the mid-band, well inside both extremes, confirms this is a consolidation phase. It is not a breakout or breakdown. The regime reading is classified as neutral.
ATR14 on the daily chart stands at 6, a moderate volatility reading. This suggests price swings remain orderly rather than erratic. The daily pivot sits at 310.56. Resistance is at 312.92 and support is at 307.55. These levels frame the near-term battleground for Apple stock heading into the next sessions.
Hourly Chart Confirms Near-Term Weakness
The 1-hour chart confirms near-term weakness within the broader consolidation. Price closed at 309.83, wedged almost exactly between the 20, 50 and 200-period EMAs. Those EMAs cluster tightly between 310.59 and 310.91. That kind of EMA compression typically signals indecision, and here it reinforces the daily chart’s neutral stance rather than contradicting it.
Hourly RSI14 at 45.99 sits just below the midline, echoing the soft momentum seen on the daily chart. More telling is the MACD histogram, which has widened to -0.21. The MACD line reads -0.57 against a signal of -0.36. This deepening negative histogram suggests short-term selling pressure has not yet exhausted itself.
At the same time, the Bollinger Bands on this timeframe show price hugging the lower half of the range. The mid-point sits at 310.52 and the lower band at 308.12. This points to a market leaning slightly defensive within the broader consolidation. Hourly ATR14 of 1.71 and a neutral regime reading round out a picture of contained, but slightly bearish-tilted, short-term price action.
15-Minute Chart: Early Signs of Stabilization
The 15-minute chart shows early signs that the hourly weakness may be losing steam. RSI14 has climbed back to 51.39, crossing just above the neutral midpoint. More notably, the MACD histogram has flipped positive at 0.05. The MACD line itself remains negative at -0.37 versus a signal of -0.42.
That crossover attempt is subtle, but it is the first sign of buyers stepping back in at lower levels. The 15-minute Bollinger Bands show a mid-line of 309.45 and a tight range between 308.66 and 310.25. A low ATR14 of 0.69 describes a market compressing ahead of a potential directional move.
The intraday pivot at 309.65, with resistance at 310.48 and support at 308.99, gives traders a precise map for the next few hours. Overall, this timeframe should be read strictly as timing context. It should not be read as a standalone signal within the larger daily and hourly bias.
Where the Conflict Lies
The multi-timeframe picture is genuinely mixed rather than aligned. The daily chart is neutral with a long-term uptrend backdrop. The hourly chart leans mildly bearish with deepening MACD negativity. The 15-minute chart shows a tentative stabilization attempt. This is not a clean setup in either direction.
Instead, it looks like a market caught between profit-taking and opportunistic buyers. The pullback from the 52-week high meets buyers testing whether support will hold. News flow around Apple stock adds texture to this technical tug-of-war without resolving it.
Evercore ISI reiterated its rating on Apple following the Mac mini refresh. Apple itself launched new Mac Mini and Mac Studio desktops explicitly aimed at AI developers. That signals the company continues pushing its hardware roadmap toward the AI theme. Separately, a Yahoo Finance piece framed the pullback from the 52-week high as a possible entry signal. It also noted that retail sentiment has soured and analysts argue the current valuation leaves little room for error.
Bullish Scenario for Apple Stock
A bullish continuation requires Apple stock to reclaim the daily EMA20 at 311.69 and hold above the daily pivot at 310.56. On the hourly chart, a push back above the EMA cluster near 310.6-310.9 would be the clearest confirmation. It would show that the recent softness was just noise within a larger uptrend. A move through the daily R1 at 312.92 would open the door toward the upper Bollinger band at 329.15 and beyond.
Supporting this case, Apple has been actively managing regulatory friction in Europe. On August 18, 2026, the company announced that alternative app stores in the EU will be charged a 5% commission on in-app purchases. This is part of a new fee structure intended to resolve disagreements with regulators over the Digital Markets Act. Removing that overhang could be read as a modest positive for sentiment.
Additionally, reporting from Reuters on August 14, 2026 indicated Apple has trained its own large language model for the China market. The model was developed with support from Alibaba Group Holding. Continued strategic execution on AI, both domestically and in China, could reinforce the long-term bull case that the 200-day EMA already reflects.
Bearish Scenario: What Could Invalidate the Recovery
The bearish path becomes more credible if Apple stock breaks below the daily S1 at 307.55. A break below support would suggest the pullback is deepening rather than stabilizing. This would be especially true if the hourly MACD histogram keeps widening beyond -0.21. Should hourly RSI14 roll back down through the mid-40s, that would reinforce the downside case. If the 15-minute MACD histogram fails to hold its recent positive tick, the early stabilization signal would be invalidated.
In this scenario, the daily Bollinger lower band at 293.85 becomes the next reasonable downside reference. The concern flagged in the Yahoo Finance coverage would become more relevant if technical support fails. That concern is that valuation leaves little margin for disappointment amid souring retail sentiment. A downside break of the current consolidation would essentially confirm that the neutral daily regime is tilting bearish rather than resolving higher.
Closing Take
Apple stock is sitting in a genuine decision zone. The daily chart’s neutral regime, moderate ATR14 of 6, and tightly packed hourly EMAs all point to a market waiting for a catalyst. It is not yet committing to a direction.
Meanwhile, the tentative bullish tick on the 15-minute MACD histogram offers a hint of near-term stabilization. However, it remains fragile against the deeper hourly weakness. Given the pivot levels in play, volatility around these boundaries should be expected. The key downside level is 307.55, and the key upside level is 312.92 on the daily timeframe.
Positioning here calls for patience. Confirmation is likely to come from whichever side of the pivot structure breaks first.
FAQ
What is the current technical regime for Apple stock?
The daily chart shows a neutral regime. The longer-term uptrend remains intact with the 200-day EMA at 282.87, but daily RSI14 at 47.82 and a daily MACD histogram at -0.15 point to cooling short-term momentum.
What are the key levels to watch for Apple stock?
Daily support sits at 307.55 and daily resistance at 312.92. On the hourly chart, the EMA cluster near 310.6-310.9 is the clearest short-term confirmation zone.
Is the 15-minute chart signaling a rebound?
The 15-minute chart shows a tentative stabilization attempt. RSI14 has climbed to 51.39 and the MACD histogram has flipped positive at 0.05, but the signal remains fragile against hourly weakness.
What could invalidate the bullish case for Apple stock?
A break below the daily S1 at 307.55, combined with a widening hourly MACD histogram beyond -0.21, would suggest the pullback is deepening. The daily Bollinger lower band at 293.85 would then become the next downside reference.
Disclaimer: This article is for informational purposes only and does not constitute financial advice, an investment recommendation, or a solicitation to buy or sell any financial instrument or cryptocurrency. The analysis provided is not indicative of future results. Investing in crypto assets and financial markets carries a high risk of capital loss. Always do your own research (DYOR) and consult a qualified financial advisor before making any decision.
Article produced with the assistance of artificial intelligence and reviewed by the editorial team.







 English (US) ·