
 2 hours ago
17
2 hours ago
17

SNOW stock is trading near all-time highs ahead of the September 2 earnings report. The daily chart still points to a bullish structure. However, the hourly timeframe shows cooling momentum. Price closed at 317.02, above the 20, 50, and 200-day EMAs.
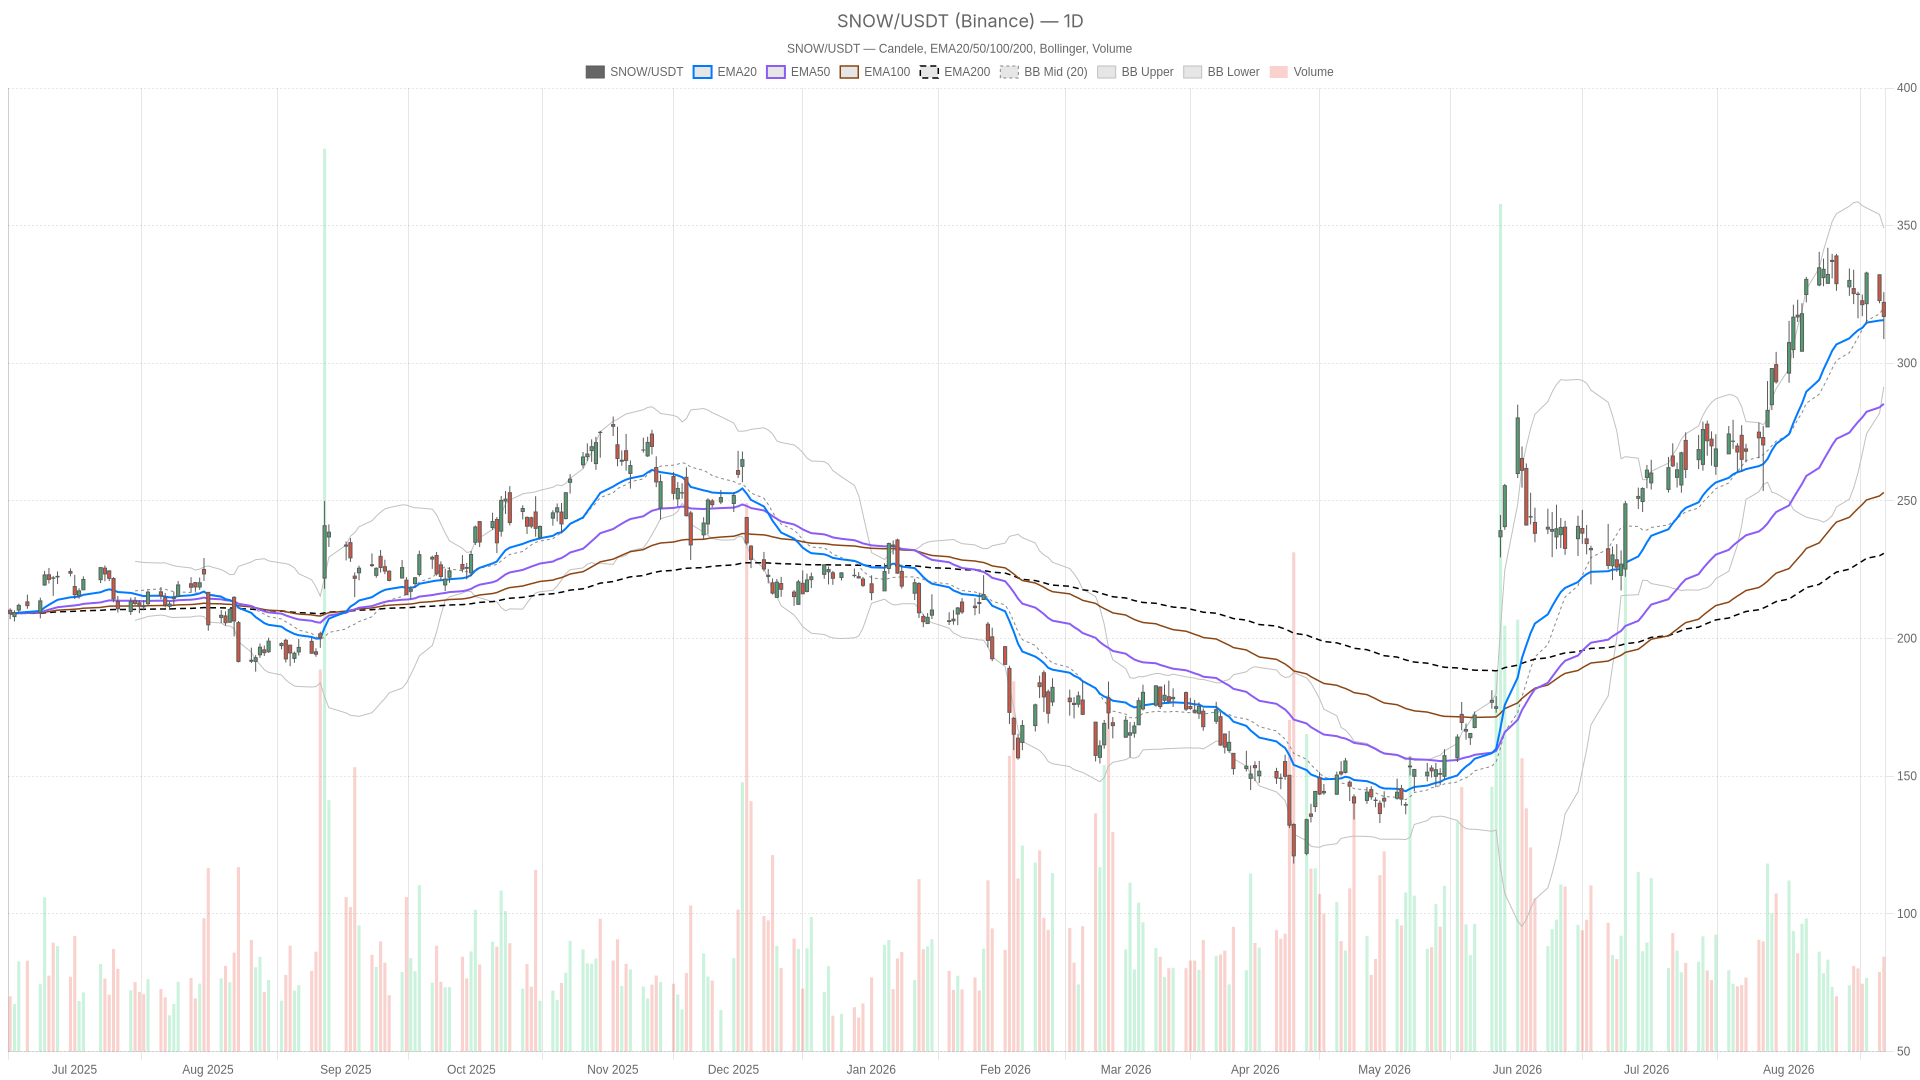 SNOW — daily chart with candlesticks, EMA20/EMA50 and volume.
Key takeaways
- SNOW stock closed at 317.02, above its 20-day (315.68), 50-day (285.30), and 200-day (230.97) EMAs.
- Daily RSI14 at 55.89 is constructive, but the MACD histogram at -3.28 shows fading momentum.
- Hourly price at 316.90 sits below the 20-hour (320.52) and 50-hour (323.10) EMAs, signaling short-term weakness.
- Key levels: support at 308.61, resistance at 325.64, and the lower Bollinger band at 291.49.
- Snowflake reports earnings on September 2, with daily ATR at 12.55 reflecting elevated volatility.
SNOW Stock Daily Trend: Bullish Structure, but Momentum Is Fading
The daily trend remains bullish, but momentum is fading. On the daily timeframe, the regime is explicitly bullish. RSI14 sits at 55.89, which is constructive without being overbought. That leaves room for further upside if buyers step back in. At the same time, the MACD is sending a more cautious signal. The MACD line at 13.07 remains below its signal line at 16.34. Its histogram is negative at -3.28. In practice, upward momentum is decelerating even though the trend itself remains intact.
Notably, price trades below the daily Bollinger midline of 320.28. The upper band sits at 349.07, and the lower band sits at 291.49. That positioning suggests the stock has pulled back slightly from recent strength without breaking the broader bullish envelope. ATR14 at 12.55 confirms that volatility is elevated, which is typical ahead of a major earnings event. Daily pivot levels frame the near-term battle clearly: pivot at 317.23, resistance at 325.64, and support at 308.61.
1H Timeframe: Short-Term Weakness Complicates the Bullish Case
The hourly chart shows short-term weakness. It complicates the bullish case without confirming a full reversal. Price at 316.90 sits below both the 20-hour EMA (320.52) and the 50-hour EMA (323.10). At the same time, it remains above the 200-hour EMA (306.95). That is a corrective setup inside a longer-term uptrend, not a full trend reversal. Hourly RSI14 reads 40.53, leaning toward weakness. The MACD line at -2.54 sits below its signal at -1.57. Its histogram is negative at -0.97. Momentum is clearly bearish for now.
Therefore, the hourly picture weakens the daily bullish bias rather than confirming it. The regime is labeled neutral on this timeframe. Price sits right around the hourly pivot at 316.33, between resistance at 318.11 and support at 315.11. In other words, SNOW stock is consolidating at a decision point. The next directional move should clarify whether this is a shallow pullback or the start of something more significant.
15-Minute View: Execution Context
The 15-minute chart shows a tentative stabilization attempt. It is not strong enough to be a trend change. Price at 316.90 is above its 20-period EMA (316.05) but below the 50 and 200-period EMAs (319.16 and 324.29). RSI14 at 49.84 is neutral. The MACD histogram flipped slightly positive at 0.51. Still, the MACD line (-1.61) remains below its signal (-2.11). That small shift hints at early stabilization within the broader pullback. Price hugs the 15m pivot at 316.34. This reinforces a market searching for direction before the catalyst.
Earnings and Sentiment Backdrop
Expectations are elevated heading into earnings. Sentiment is split between institutional confidence and insider caution. Snowflake reports earnings on September 2, with shares trading near all-time highs. According to one report, a beat is already largely priced in. The real debate is whether AI agent activity reflects paid production workloads or well-funded experimentation. Meanwhile, comparative coverage has framed Snowflake against MongoDB on risk/reward into the print. That underscores elevated expectations across the sector.
On the sentiment side, reports note insider selling alongside a 200% surge in the shares. At the same time, they point to analyst price targets and institutional buying as signs of confidence. Notably, 13F filings show Brad Gerstner of Altimeter Capital and Cathie Wood holding Snowflake. That adds institutional validation. On the other hand, one analysis argues SNOW stock is priced for growth at a lower gross margin. AI products carry thinner margins than the core platform. The report describes a bandwidth-cost offset as central to holding the margin guide together.
Bullish Scenario
The bullish case requires reclaiming key hourly EMAs and defending daily structure. SNOW stock would need to reclaim the hourly 20 and 50 EMAs (320.52 and 323.10). RSI14 would also need to push back above the 50 mark on the hourly timeframe. Holding above the daily pivot at 317.23, and defending support at 308.61, would keep the broader uptrend structurally intact. A strong earnings print that eases margin concerns, combined with continued institutional accumulation, would likely reignite momentum toward the daily resistance at 325.64 and beyond.
Bearish Scenario
The bearish case strengthens if daily support at 308.61 fails. In contrast to the bullish setup, a loss of that level would open the door toward the lower Bollinger band at 291.49. It would also confirm that hourly weakness has spread into the daily structure. Meanwhile, a daily MACD that keeps widening its bearish histogram would reinforce the shift. An earnings result that fails to justify already-priced-in expectations would be the clearest invalidation of the bullish daily regime. Accelerating insider selling alongside disappointing margin guidance would only reinforce that downside risk.
Closing Take
SNOW stock sits at a technical crossroads. The daily trend remains bullish, but short-term signals conflict. Still, the hourly chart flashes clear short-term weakness, and the 15-minute chart shows only a tentative stabilization attempt. Volatility is elevated, as reflected in the daily ATR of 12.55, and that is unlikely to ease before the September 2 earnings report.
Positioning into that event should account for both the structural uptrend and the near-term uncertainty. The mix includes insider selling, institutional confidence, and margin questions tied to AI-driven growth. As a result, the coming days are likely to bring outsized moves in either direction.
FAQ
What are the key SNOW stock levels ahead of earnings?
Daily support sits at 308.61, with the lower Bollinger band at 291.49. Resistance is at 325.64, while the daily pivot is 317.23. Price closed at 317.02.
Is SNOW stock in an uptrend on the daily chart?
Yes. Price closed above the 20-day (315.68), 50-day (285.30), and 200-day (230.97) EMAs. However, daily MACD momentum is decelerating, with a negative histogram of -3.28.
Why does the hourly chart complicate the SNOW stock outlook?
Hourly price at 316.90 sits below the 20-hour (320.52) and 50-hour (323.10) EMAs. Hourly RSI14 at 40.53 leans bearish, signaling short-term weakness inside the broader uptrend.
When does Snowflake report earnings?
Snowflake reports earnings on September 2. Daily ATR at 12.55 reflects elevated volatility heading into the event.
Disclaimer: This article is for informational purposes only and does not constitute financial advice, an investment recommendation, or a solicitation to buy or sell any financial instrument or cryptocurrency. The analysis provided is not indicative of future results. Investing in crypto assets and financial markets carries a high risk of capital loss. Always do your own research (DYOR) and consult a qualified financial advisor before making any decision.
Article produced with the assistance of artificial intelligence and reviewed by the editorial team.







 English (US) ·