
 3 hours ago
14
3 hours ago
14

Celestica, Inc. stock spiked sharply on July 27 after Q2 2026 results beat the high end of guidance on revenue and adjusted EPS. Yet beneath the earnings euphoria, the daily technical picture remains structurally challenged — a tension worth understanding before drawing conclusions about direction.
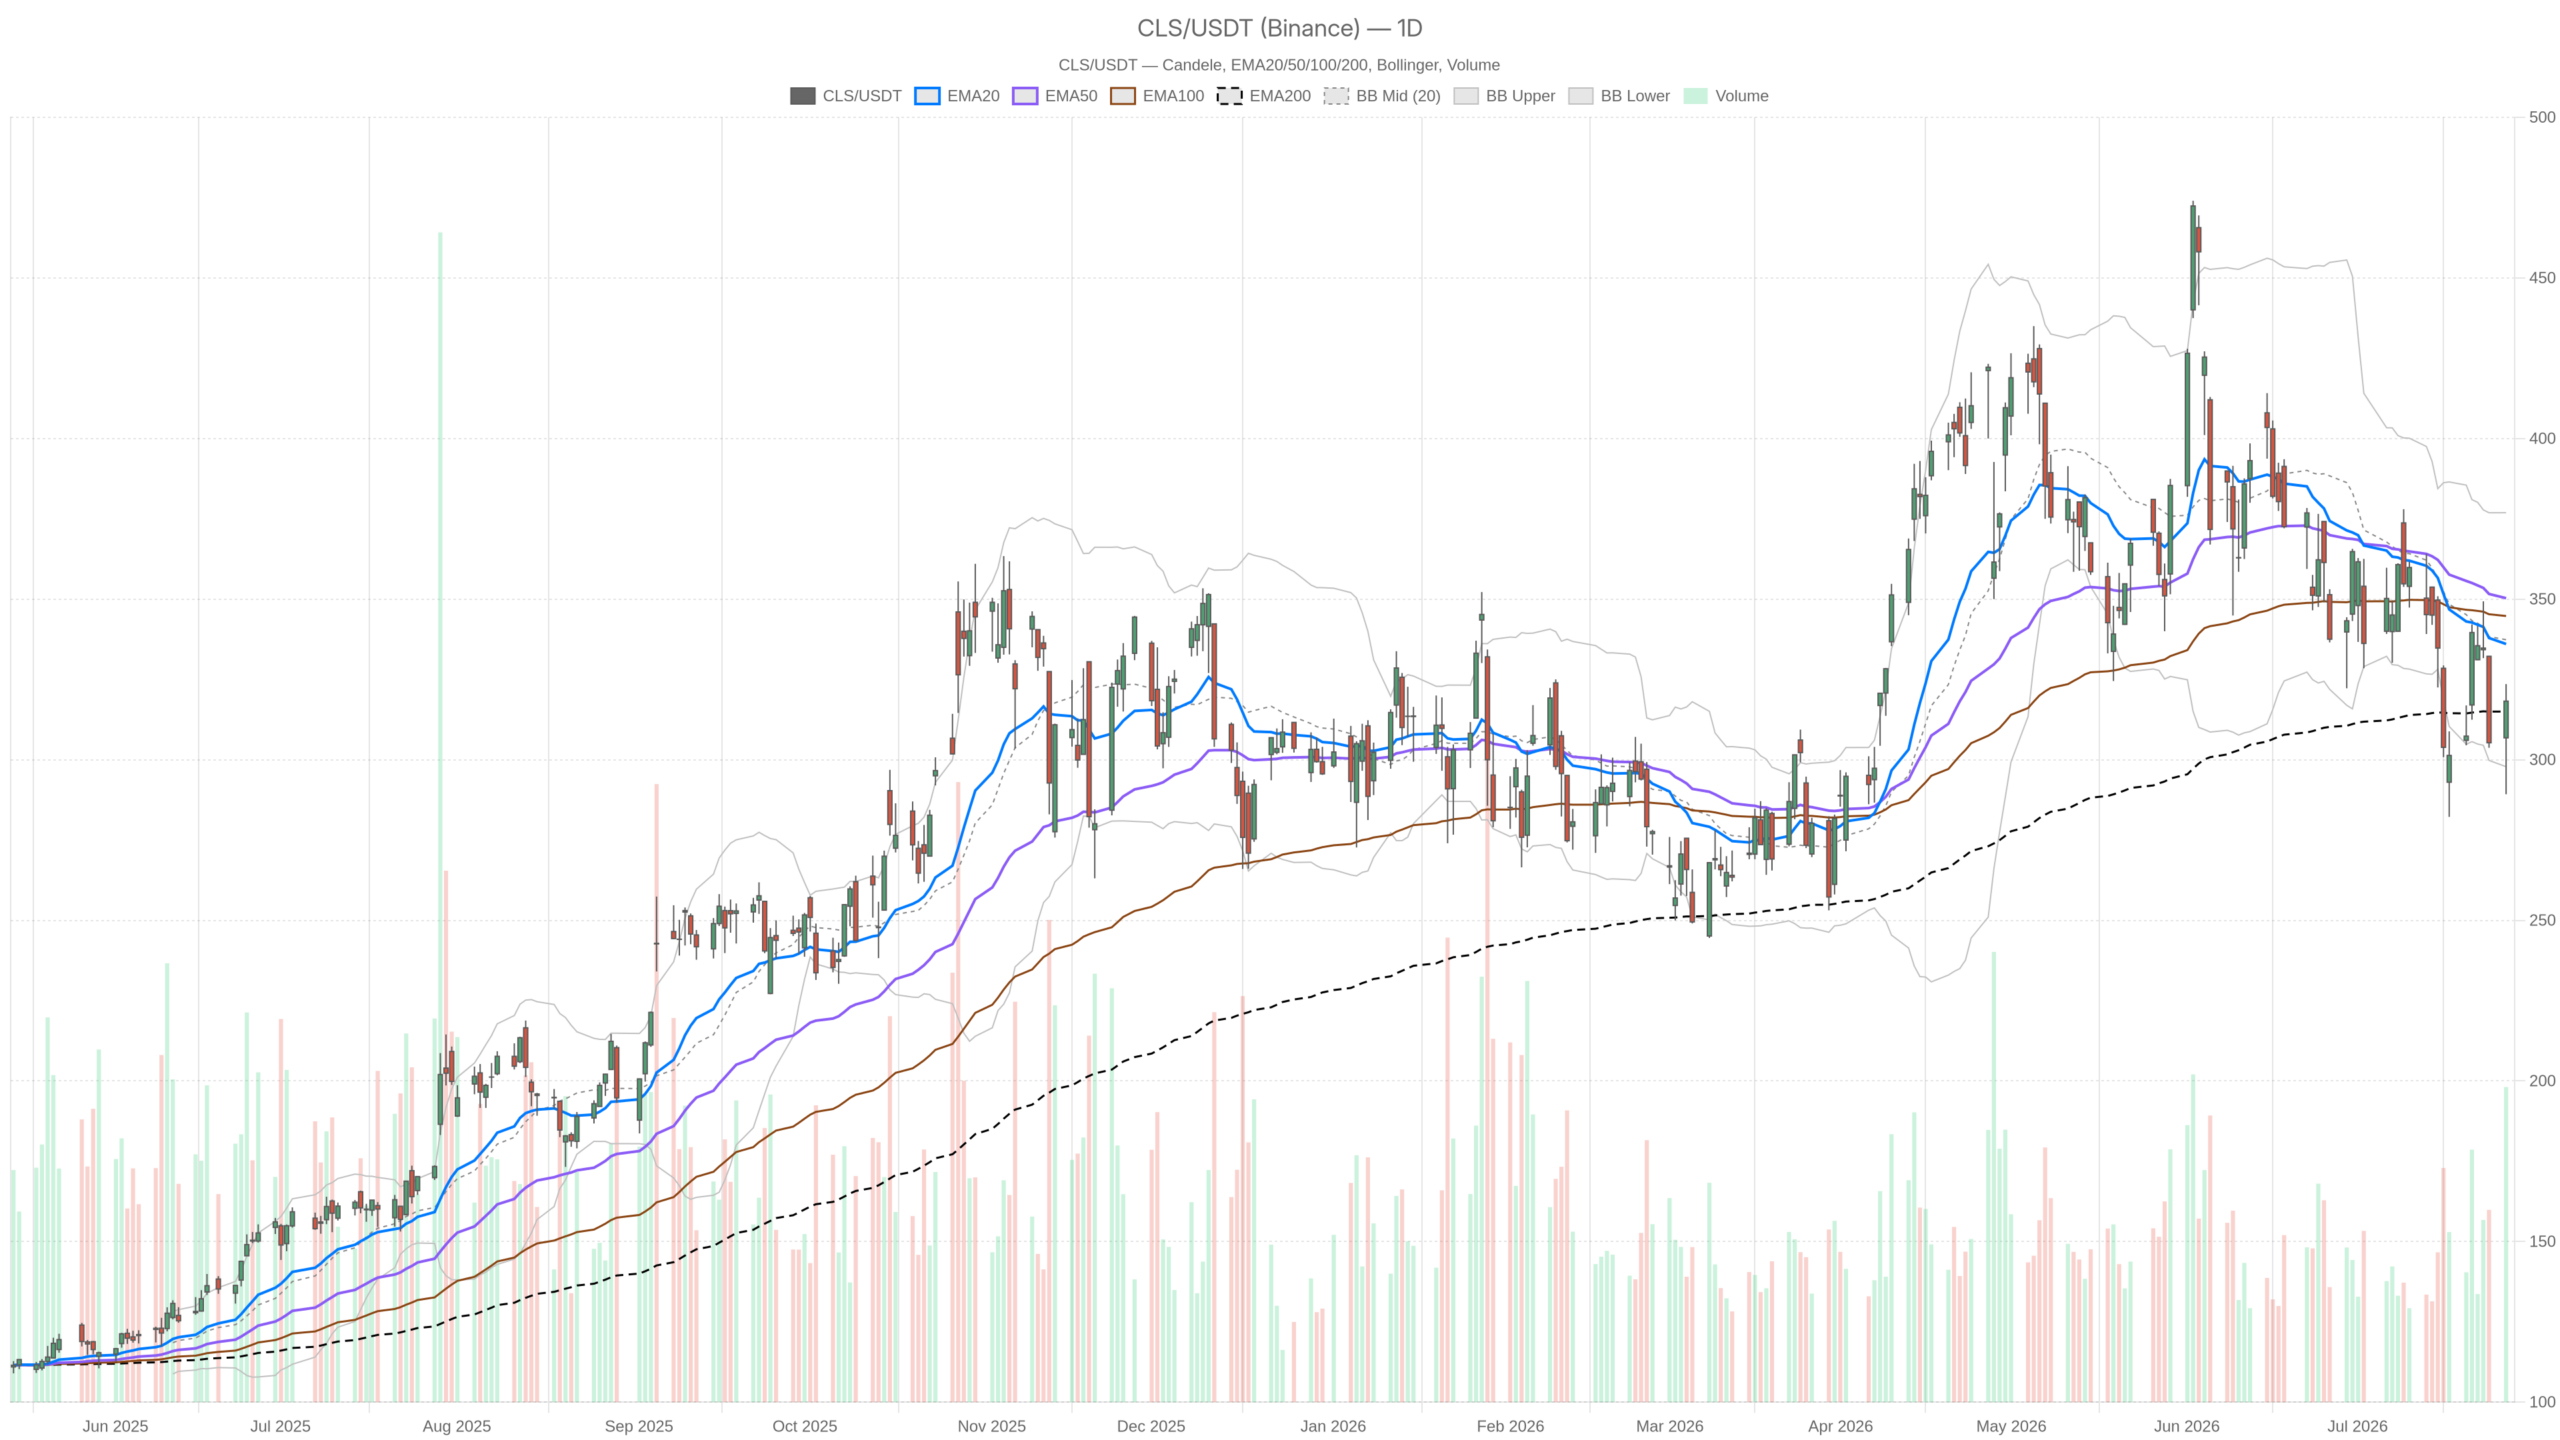 CLS — daily chart with candlesticks, EMA20/EMA50 and volume.
Key takeaways
- Celestica, Inc. stock closed at $318.24 on July 27 after swinging from $289.26 to $323.55 intraday.
- Q2 2026 results beat the high end of guidance on both revenue and adjusted EPS, and management raised the full-year 2026 outlook.
- Management also projected accelerating growth into 2027, citing AI infrastructure and data center demand as key drivers.
- The daily chart remains bearish: price sits below the EMA20 at $336.03 and the EMA50 at $350.30.
- Daily RSI at 43.21 and MACD still in negative territory — no confirmed trend reversal has occurred yet.
Daily Bias: Celestica, Inc. Stock Recovery Attempt in a Bearish Structure
Celestica, Inc. stock remains in a bearish daily structure despite the post-earnings spike. Price closed below both short-term moving averages, with only the EMA200 at $315.01 providing nearby support.
Price closed at $318.24, sitting below the EMA20 at $336.03 and the EMA50 at $350.30. That positioning confirms the intermediate trend remains under pressure. However, the EMA200 at $315.01 offers one redeeming feature. The stock now trades just above that long-term moving average. This may serve as gravitational support after the sharp post-earnings spike.
Meanwhile, the Bollinger Band structure reinforces the cautious read. The midline sits at $337.37, well above the current close. The lower band rests at $297.83, with the upper at $376.90. Price remains in the lower half of that range. That is not a sign of bullish momentum on the daily frame. The regime is flagged as neutral, reflecting genuine indecision rather than clear directional conviction.
Momentum Indicators Remain in Negative Territory
Daily RSI at 43.21 is another telling detail. It is neither oversold nor recovering with authority. The level suggests selling pressure has dominated recent sessions. The Q2 rally has not yet shifted the broader momentum profile.
Similarly, the MACD line at -13.16 sits below the signal at -12.32. The histogram of -0.84 remains in negative territory. However, the histogram is narrowing. That may signal momentum exhaustion to the downside. But it has not yet crossed into positive ground. Therefore, a true trend reversal on the daily has not been confirmed.
Daily ATR of $23.51 underscores just how volatile this name has become. A single session can cover the entire distance between key support and resistance levels. The pivot point sits at $310.35. R1 stands at $331.44 and S1 at $297.15. The current close of $318.24 holds above the pivot. That is a mildly constructive technical signal.
Hourly View: Short-Term Momentum Emerging for CLS
The 1H chart shows early signs of stabilization for CLS, though overhead resistance levels remain intact. Price trades above the 1H EMA20 but still faces multiple hurdles above.
Meanwhile, the 1H timeframe offers a more supportive picture. Price at $318.23 trades above the 1H EMA20 at $313.86. That is a short-term positive. However, the 1H EMA50 at $320.77 and EMA200 at $341.86 remain overhead resistances. The hourly structure still reflects a market where bears control medium-term momentum. Even so, the session close tries to carve out a base.
In contrast to the daily MACD, the 1H MACD histogram has flipped fractionally positive at 0.16. The line at -5.61 has crossed above the signal at -5.77. That is a subtle but notable shift. It suggests intraday buying pressure from the earnings release has started to stabilize momentum. The broader trend, however, has not reversed.
The 1H RSI at 51.88 sits effectively neutral. It holds just above the midpoint. This is consistent with a market that is balancing rather than trending.
Notably, the 1H Bollinger midline at $317.08 aligns closely with the current price. That proximity places CLS right at the center of its recent hourly range. Room exists to expand toward $349.04 on the upside or compress toward $285.13 on the downside. The hourly pivot at $318.43 also clusters tightly with the close. This reinforces a zone of equilibrium around the $318 area.
15-Minute Frame: Overbought Momentum After the Spike
On the 15-minute chart, Celestica, Inc. stock shows overbought conditions after the earnings-driven spike. This suggests a near-term pause or retracement is likely before any further upside.
The earnings-driven move has pushed momentum into stretched territory. RSI at 72.7 is technically overbought on this timeframe. The MACD histogram is strongly positive at 2.37. This confirms the momentum spike. Still, at these RSI levels, short-term traders typically look for a pause or retracement before adding exposure.
The 15m EMA200 at $321.37 sits just above the current price of $318.23. That level now acts as immediate overhead resistance for intraday participants. The 15m pivot R1 at $323.15 and the session high of $323.55 form a tight resistance cluster.
On the support side, $313.71 marks the 15m S1 level. It roughly aligns with the 1H EMA20 at $313.86. Execution-oriented traders will watch that zone closely on any pullback.
The Bullish Scenario: Earnings Inflection Drives a Structural Reset
The bull case for Celestica, Inc. stock hinges on the Q2 earnings beat acting as a fundamental inflection point. If the market treats this print as a reset, the technical structure could eventually follow.
The bull case rests firmly on the earnings narrative. A beat above the high end of guidance represents a fundamental inflection. So does the raised annual outlook and projected acceleration into 2027. If the market treats this print as a reset, buyers could push price toward the EMA20 at $336. Eventually, they could challenge the EMA50 at $350.
Technically, the key confirmation level is $331.44. That is the daily R1 pivot. A sustained break and hold above it would signal genuine follow-through from the post-earnings move. At the same time, the daily MACD histogram is narrowing toward zero. This supports the idea that downside momentum is fading. A cross into positive territory would materially strengthen the bullish case.
Notably, AI infrastructure and data center demand were cited as key growth drivers into 2027. These provide the fundamental backdrop that could sustain buying interest over multiple sessions. Cloud growth and healthcare traction were also highlighted ahead of results. These are not one-quarter tailwinds.
The Bearish Scenario: Structural Damage Limits the Upside
The bearish case for Celestica, Inc. stock emphasizes that structural damage on the daily chart limits upside potential. The risk of a fade back toward $297 remains very much in play.
On the other hand, the daily chart’s structure cannot be dismissed. Price remains below both the EMA20 and EMA50. The daily RSI at 43.21 reflects a market that has spent significant time under selling pressure. One strong session does not erase that history. If this earnings pop proves to be a sell-the-news event, the risk is a fade lower. Price could revisit the lower Bollinger Band at $297.83 or the daily S1 at $297.15.
Still, the 15m RSI at 72.7 adds a short-term concern. Overbought conditions on the intraday frame often precede brief pullbacks. This is especially true when the broader trend remains technically bearish. A failure to hold above the daily pivot at $310.35 would be a red flag for bulls.
Notably, volume of 3.9 million shares was elevated. That signals genuine interest. But it also means participants are now positioned and watching closely for the next move.
Positioning in a High-Volatility, Post-Earnings Environment
Celestica, Inc. stock sits at a genuine crossroads. The fundamental case has strengthened materially, yet the daily technical structure still leans bearish by most conventional measures.
Overall, the fundamental case has strengthened materially after the Q2 beat and raised guidance. Yet the daily technical structure remains bearish by most conventional measures. Price sits below key moving averages. RSI is sub-50. MACD remains in negative territory.
The 1H frame offers early signs of stabilization. Meanwhile, the 15m signals short-term overbought conditions. That warrants caution on immediate entries.
With a daily ATR of $23.51, this is not a low-volatility environment. Meaningful price swings are the baseline expectation, not the exception. The next several sessions will be critical. They will determine whether the Q2 catalyst can break the daily downtrend convincingly. Or whether the structural overhead at $336–$350 proves too heavy to clear.
Until the daily MACD turns positive and price reclaims the EMA20, the balance of evidence still leans toward recovery. It does not yet signal a confirmed reversal.
FAQ
What drove Celestica, Inc. stock higher on July 27?
Q2 2026 results beat the high end of guidance on both revenue and adjusted EPS. Management also raised its full-year 2026 outlook and projected accelerating growth into 2027, citing AI infrastructure and data center demand as key drivers.
Is Celestica, Inc. stock in a bullish or bearish trend on the daily chart?
The daily chart remains structurally bearish. Price closed at $318.24, below the EMA20 at $336.03 and the EMA50 at $350.30. Daily RSI sits at 43.21, and the MACD remains in negative territory. No confirmed trend reversal has occurred.
What are the key resistance levels for CLS?
Immediate resistance sits at the daily R1 pivot of $331.44 and the EMA20 at $336.03. Further overhead, the EMA50 at $350.30 and the 1H EMA200 at $341.86 represent additional hurdles for any sustained rally.
What support levels should traders watch?
The EMA200 at $315.01 serves as nearby support. Below that, the daily pivot at $310.35 offers the next line of defense, followed by the lower Bollinger Band at $297.83 and the daily S1 at $297.15.
Disclaimer: This article is for informational purposes only and does not constitute financial advice, an investment recommendation, or a solicitation to buy or sell any financial instrument or cryptocurrency. The analysis provided is not indicative of future results. Investing in crypto assets and financial markets carries a high risk of capital loss. Always do your own research (DYOR) and consult a qualified financial advisor before making any decision.
Article produced with the assistance of artificial intelligence and reviewed by the editorial team.





 English (US) ·