
 1 hour ago
19
1 hour ago
19

As of August 13, 2026, Ether.fi crypto trades around $0.40, pinned to its daily pivot while hourly momentum turns tentatively bullish. The daily chart remains neutral, and a Fear & Greed reading of 29 keeps conviction low. The market is waiting for a trigger rather than a direction.
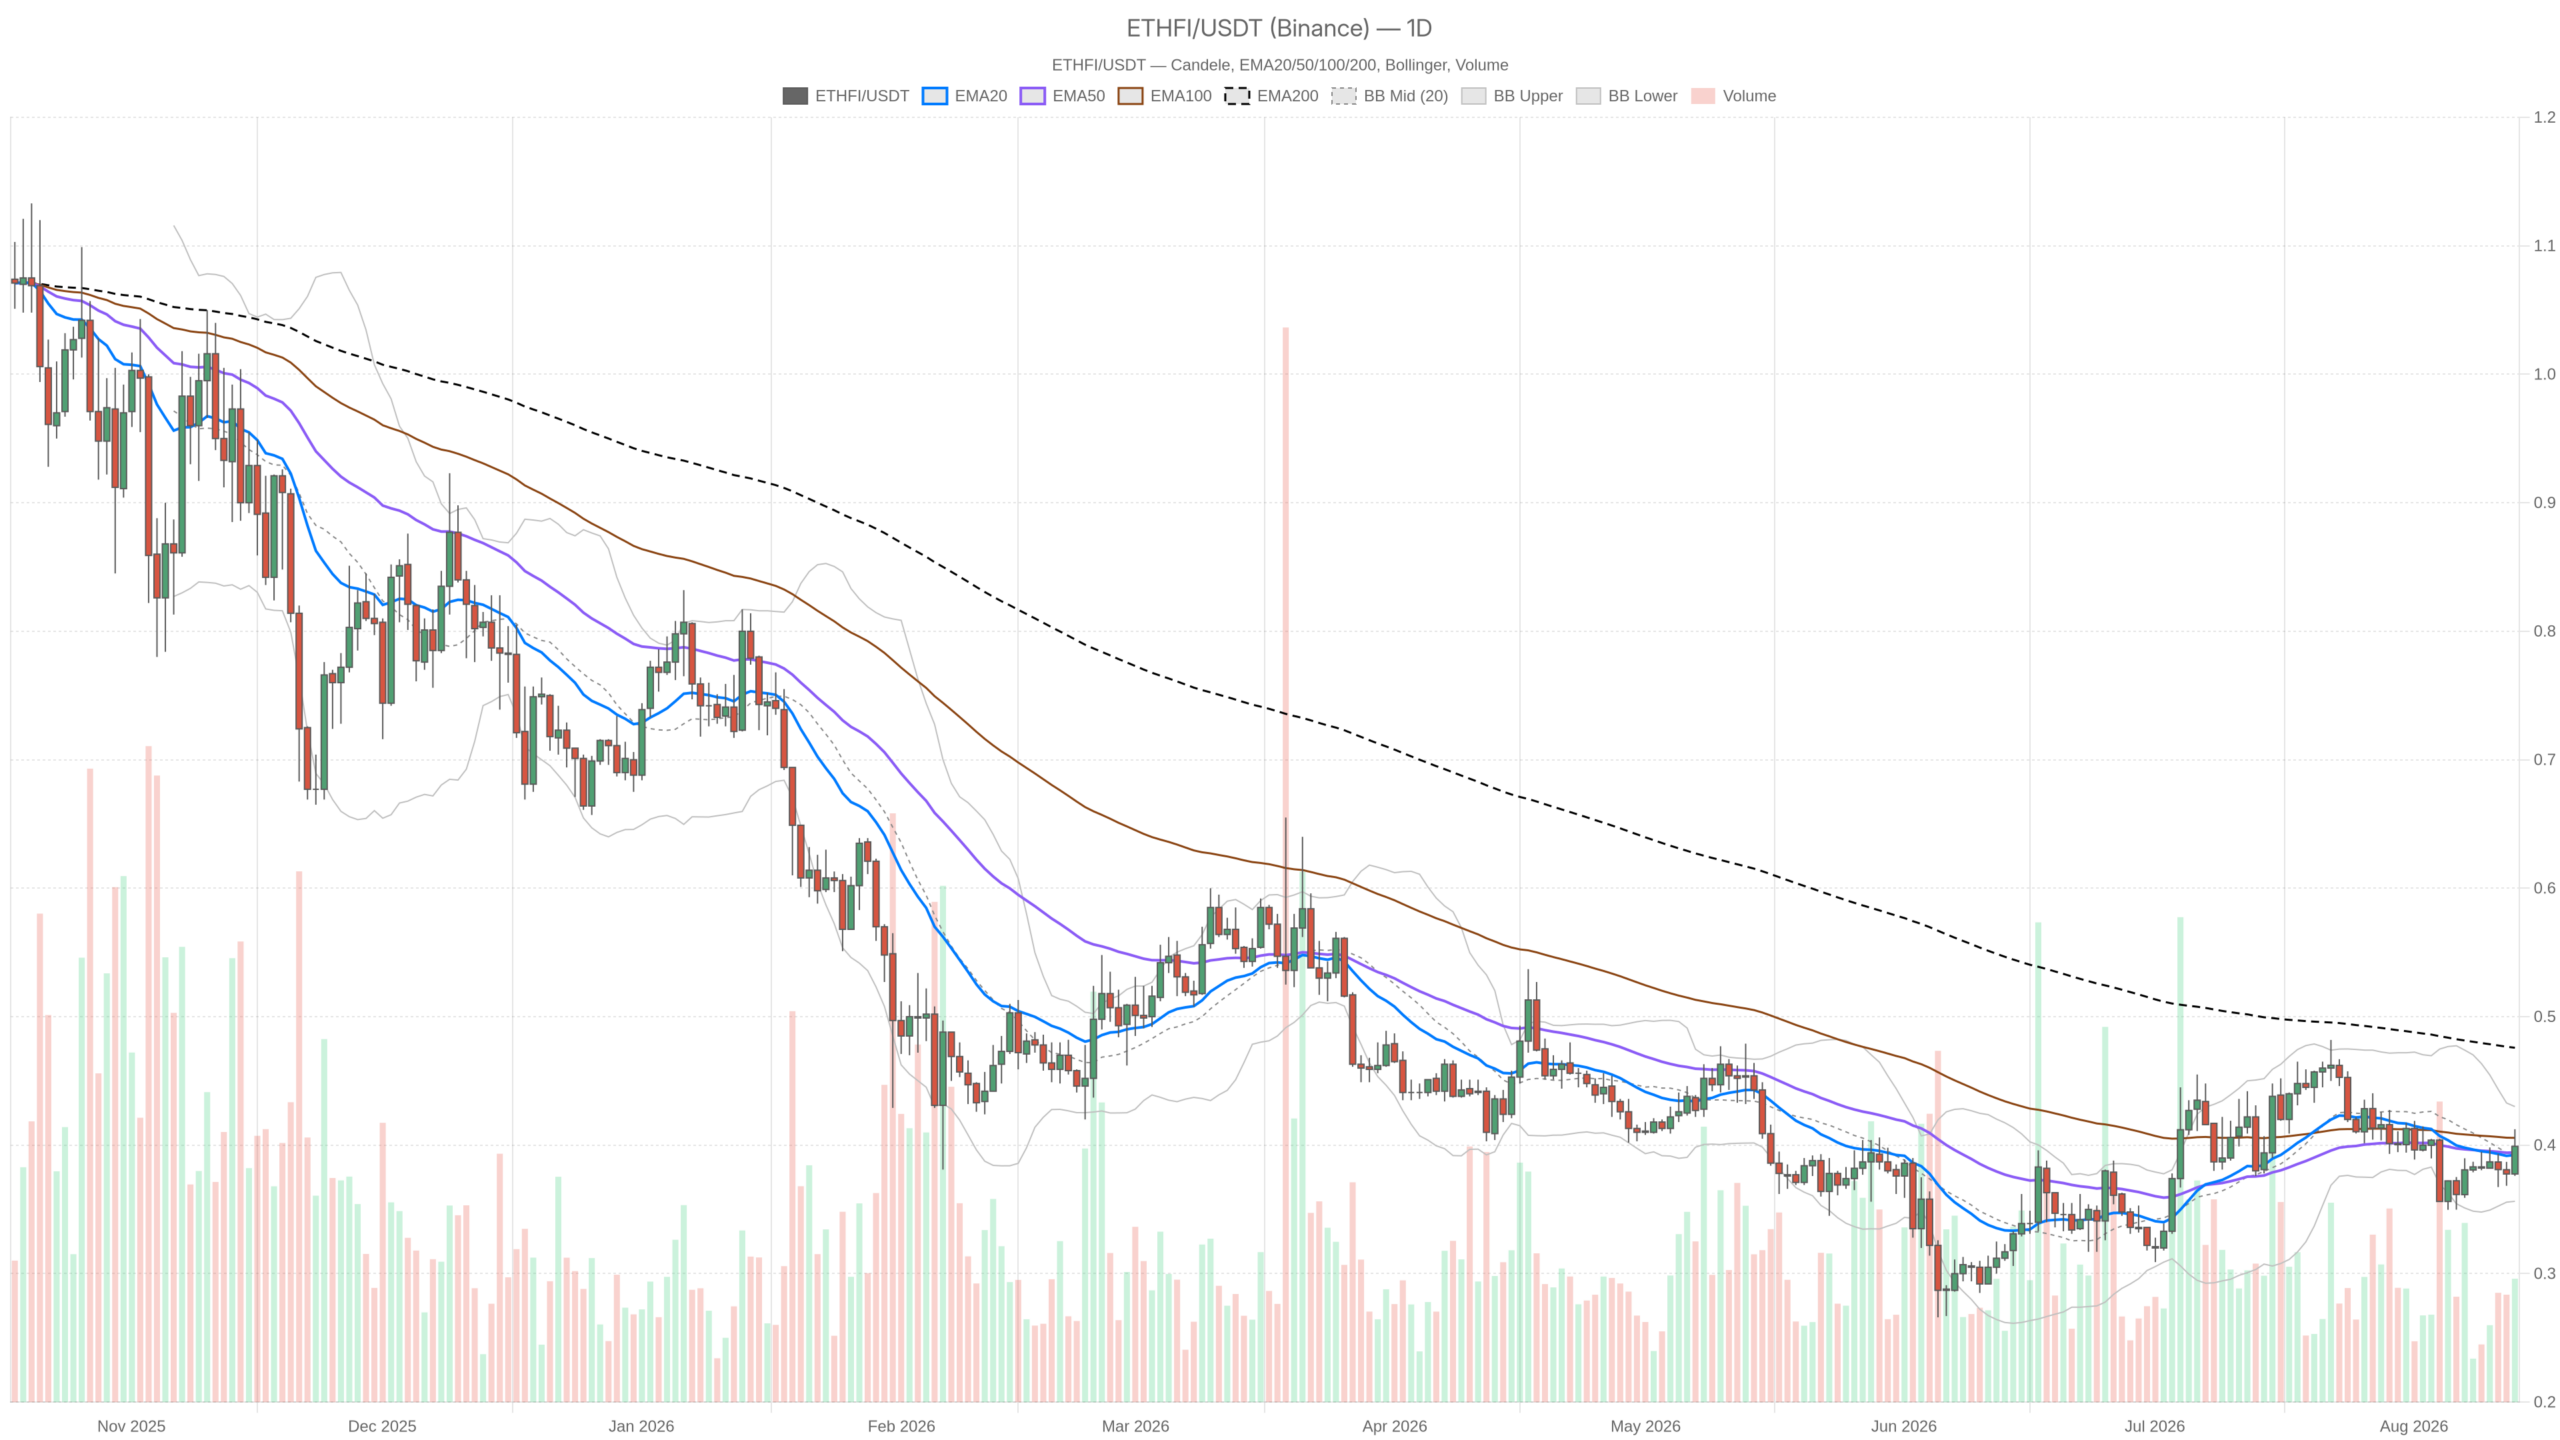 ETHFI/USDT — daily chart with candlesticks, EMA20/EMA50 and volume.
Key takeaways
- The token trades near $0.40, essentially on its daily pivot, with the daily EMA200 still above at $0.48.
- Daily indicators are neutral: RSI14 sits at 51.51 while the MACD histogram flattens near zero.
- Short-term momentum leans bullish, with 1H RSI14 at 65.61 and 15m RSI14 at 68.98.
- The Fear & Greed Index reads 29 (Fear), and Bitcoin dominance sits at 56.31%.
- Key levels: resistance at $0.42 (R1) and $0.43 upper band; support at $0.38 (S1) and $0.36 lower band.
The Setup: Caught Between Macro Caution and Intraday Strength
The setup is indecision layered on a longer downtrend that has not been resolved. Ether.fi crypto trades at $0.40 while the daily EMA200 sits well above at $0.48. That gap keeps the bigger picture corrective. Until that longer-term average is reclaimed, every bounce deserves treatment as a recovery attempt inside a heavier structure rather than a full trend reversal.
Daily Timeframe: The Real Bias
The daily chart is neutral, not directional. Price sits basically glued to the EMA20 and EMA50, both at $0.39, while RSI14 rests at 51.51 — dead center. The MACD line and signal both sit near -0.01 with a histogram flattening to zero. In other words, prior bearish momentum has run out of gas without flipping bullish yet.
Moreover, Bollinger Bands show a mid at $0.39, an upper band at $0.43, and a lower band at $0.36 — a fairly tight, contained range for now. ATR14 at $0.02 implies daily volatility near 5% of price, so moves are not explosive but not dead either. The daily pivot at $0.40, with resistance at $0.42 (R1) and support at $0.38 (S1), frames the near-term battlefield. The system tags this regime as neutral, and that is the fair call.
1H and 15m: Momentum Trying to Build a Base
The shorter timeframes tell a more interesting story: buyers are in control and momentum is heating up. On the 1H chart, RSI14 jumps to 65.61, and the EMA stack — 20 at $0.39, 50 and 200 both at $0.38 — slopes upward and supportive, with price trading above all three. That is a short-term bullish tell.
On the 15-minute chart, RSI14 climbs further to 68.98, brushing against overbought territory, with the regime explicitly flagged as bullish and the same supportive EMA stack underneath. The 15m pivot is compressed — pivot, R1 and S1 all cluster near $0.40. That signals a market coiled tightly at a decision point rather than one with room to breathe in either direction.
That said, the tension is worth naming directly. The daily chart says neutral, still below the long-term average, with no real trend, while the 1H and 15m charts say short-term buyers are in control. Neither view is wrong — they simply operate on different clocks. The intraday strength could be the first leg of a bigger recovery, or a bounce inside a market still under pressure from the daily EMA200.
Bullish Scenario
For bulls, the path is clear: reclaim and hold the daily pivot at $0.40, push through R1 at $0.42, and test the upper Bollinger Band near $0.43. If that happens without RSI rolling over from overbought levels on the 1H or 15m charts, it opens the door toward a real attempt at closing the gap with the daily EMA200 at $0.48. A rejection at R1 or the upper band, combined with RSI turning down from elevated 65-69 readings, would kill this scenario and suggest the bounce was exhausted.
Bearish Scenario
For bears, the setup is about failure at current levels. If the token cannot hold the $0.39 EMA20/EMA50 confluence on the daily and loses S1 at $0.38, the next logical magnet is the lower Bollinger Band near $0.36. Since the daily MACD histogram still hovers at zero rather than turning positive, there is no strong momentum evidence that buyers have truly taken control on the higher timeframe. This bearish case gets invalidated once price reclaims $0.40 and the daily MACD histogram turns positive while RSI holds above 55.
Market Backdrop: Fear, Dominance and Cooling DeFi Fees
The broader backdrop is cautious: fear prevails, Bitcoin dominance stays elevated, and DeFi fees are cooling. The Fear & Greed Index reads 29, classified as Fear — not panic, but a market where participants are cautious rather than aggressive. Bitcoin dominance is elevated at 56.31%, according to CoinGecko-sourced market data, which typically means capital is parked in BTC rather than rotating aggressively into altcoins. Total crypto market cap sits around $2.27 trillion, up just 0.37% over 24 hours — essentially flat.
Meanwhile, on the DeFi side, fees across major decentralized exchanges are mixed but lean toward cooling. Uniswap V3 fees spiked 37.82% in a single day, yet remain down 18.78% over seven days and 33.71% over the month. Curve DEX told a rougher story, down 38.54% daily and 65.68% over the week. Uniswap V4 and Ekubo both show 30-day declines exceeding 50%. That broad-based fee compression suggests on-chain activity has retreated over the past month, which aligns with the cautious Fear & Greed reading.
Final Read
Nothing about this setup demands urgency. The daily chart is neutral by its own classification, the 1H is leaning bullish, and the 15m is already flashing overbought-adjacent readings on a very tight pivot structure. That combination — short-term strength inside a longer-term chart that has not cleared its EMA200 — is exactly the kind of environment where volatility can cut either way quickly.
Position sizing and patience matter more than conviction right now, because the higher timeframe has not confirmed what the lower timeframes are suggesting. Watch whether the daily can clear R1 with follow-through, or whether this intraday strength fades back into the same range. That answer will tell you more than any single indicator reading.
FAQ
What is Ether.fi’s current price level?
As of August 13, 2026, the token trades around $0.40, sitting almost exactly on its daily pivot.
Is the daily chart bullish or bearish?
The daily chart is neutral. RSI14 sits at 51.51, the MACD histogram is flat near zero, and price remains below the daily EMA200 at $0.48.
What are the key levels to watch?
Resistance sits at $0.42 (R1) and $0.43 at the upper Bollinger Band. Support sits at $0.38 (S1) and $0.36 at the lower band.
Disclaimer: This article is for informational purposes only and does not constitute financial advice, an investment recommendation, or a solicitation to buy or sell any financial instrument or cryptocurrency. The analysis provided is not indicative of future results. Investing in crypto assets and financial markets carries a high risk of capital loss. Always do your own research (DYOR) and consult a qualified financial advisor before making any decision.
Article produced with the assistance of artificial intelligence and reviewed by the editorial team.




 English (US) ·